
Abstract
Emergent events of urban rail transit may cause train delay, even service disruption, and then lead to a large number of passengers stranded. Urban rail transit system is difficult to maintain normal operation, so passengers shall be transported through other traffic modes outside the station. Traffic management plan outside the station is analyzed and evaluated in advance, which can increase evacuation efficiency and reduce the influence of events on society. The plan is evaluated through analyzing and simulation. Firstly, this paper analyzes the influence of events on traffic outside the station and introduces common means of traffic management. Then, this paper studies integrated simulation method and chooses key evaluation indicators, thus use the order of preference by similarity to ideal solution to evaluate the traffic management plan based on simulation. Finally, taking Jiangsu Road station as an example, this paper evaluates the effectiveness of different plans by simulation, the evaluation results show that plan 2 (partial priority) is optimal, which provides a reference for urban rail transit emergency management.
1 Instruction
Emergent events of urban rail transit (URT) belong to the category of public emergencies. It mainly refers to train emergency situation that happens in the process of operation, such as fire, explosion, gas attack, earthquake, bad weather, train derailment, disruption of rail line, sudden large passenger flow, and so on. This paper studies on event of disruption of rail line, this event means that section of URT route is interrupted, which rail transit train cannot run on the section. Emergent events will cause a large number of passengers stranded, which shall be evacuated by ground public transportation. Traffic management measures around the URT station should be taken, which can ensure passengers safely evacuated and promote emergency vehicles to carry out the evacuation and rescue work. The stand or fall of traffic management measures has a direct influence on treatment effect of emergent events, so we shall evaluate and analyze the measures in advance.
The objective of this research is to evaluate traffic management plan outside the station with simulation and comprehensive evaluation. The paper is organized as follows: firstly, traffic impact was analyzed in the emergent events, and traffic management plan was illustrated; then, the evaluation method was presented, which is based on the simulation; furthermore, evaluation process was illustrated through a case; finally, we offered the summary and explanation to the conclusion, and gave an outlook to the future research.
2 Researches of Traffic Management when Emergency
Traffic management plan evaluation outside the station belongs to research of traffic evacuation strategy. Traffic evacuation can be divided into car evacuation [1–3] and bus evacuation [4–9]. Passengers are mainly evacuated by buses in emergent events of URT; therefore, we focus on bus evacuation in our study.
For the research of bus evacuation in emergent events of URT, it is mainly in bus service replaces URT service. Kepaptsoglou and Karlaftis [4] propose a methodological framework for planning and designing an efficient bus bridging network. Darmanin et al. [5] propose disruption recovery strategies for the specific case of the existing bus routes of the Melbourne metro system. Jin et al. [6] introduce a localized rail-bus integration approach aimed at enhancing the urban transit rail networks resilience to disruptions. Jin et al. [7] present an optimization-based approach that responds to disruptions of urban transit rail networks by introducing smartly designed bus bridging services.
For the research of bus evacuation in other emergent events, Karlaftis et al. [8] study on paratransit bus service optimization for special events, and develop a programming model for jointly obtaining optimal headways and vehicle type. Carson and Bylsma [9] present a mathematical model of bus dispatch for special events, which the minimum bus travel time is taken as the optimized object.
From the above, the researches mainly study on bus evacuation strategy and scheduling optimization model, but bus evacuation research with computer simulation is less, which lacks accuracy in effect assessment of strategy application.
Besides, for the research of passenger evacuation simulation, Huang [10] employees Exodus V4.06 and Smartfire V4.1 to simulate the evacuation under different risks in one metro station in Shanghai. Wang and Chen [11] use any logic to study the influence on evacuation time in different passenger evacuation simulation scenarios. Liu and Wu [12] use Simulex to carry out evacuation simulation analysis of fires. The object of researches [10–14] is passenger evacuation simulation inside the station, which does not combine with passenger evacuation simulation outside the station; therefore, these integrations are not proposed. In addition, in the event of disruption of rail link, traffic management plan shall consider the impact on background traffic, so traffic management plan evaluation needs to analyze comprehensive influence on traffic outside the station. In view of the above analysis, it need further research that how to combine simulation and comprehensive evaluation to evaluate traffic management plan.
3 Traffic Impact Analysis in Emergent Events of URT
In emergency events of URT, traffic outside the station mainly consists of passengers, emergency vehicles, and general vehicles. Emergency vehicles are divided into emergency buses and emergency rescue vehicles. (As tabulated in Table 1).
Passengers cannot be dissipated in time because of train delay, so stranded passengers continue to increase, which will cause station platform crowded and even cause hidden trouble to safety. In this situation, some of passengers will give up URT to choose ground public transportation. Emergency rescue vehicles will arrive at the scene to carry out rescue and maintenance work, such as police car, ambulance car, tool car, and so on. Besides, as background traffic, general vehicles shall be an important part of traffic outside the station.
To ensure the normal operation of traffic outside the station, it should make transfer passengers convenient, guarantee emergency buses quickly transport passengers, and make general vehicles running smoothly and orderly. The influence factors of traffic operation mainly include passenger traffic demand, the capacity of emergency bus, and the capacity of intersection and road. These factors are closely related to traffic management plan outside the station.
4 Traffic Management Plan Outside the Station
When emergent events of URT happen, firstly, URT emergency management department adjusts train operation scheme according to specific circumstances, generally takes part route on both sides of the interruption interval, which choose turn back station to turn back, besides, it can adopt bidirectional operation on single track; then, the URT stations implement passenger flow organization, which guides passengers quickly and to be safely evacuated; furthermore, traffic management department implements traffic management plan outside the station, which arranges for passengers to use ground transportation to reach destination, and determines whether to use bus bridging according to passenger demand. (As shown in Fig. 1).

The disposal process in emergent events of URT
In addition, the passenger choice behavior in the emergency event is mainly divided into the following aspects: (1) choosing other metro lines to reach the destination; (2) choosing shuttle bus to reach the destination; and (3) choosing other traffic modes to reach the destination, such as taxi. The shuttle bus is a major traffic modes for passengers transfer to ground traffic, so traffic management outside the station should focus on this kind of passengers who choose shuttle bus.
For traffic management plan outside the station, it consists of three main aspects: passenger flow organization outside the station, emergency bus organization, and road traffic organization.
-
(1)
Passenger flow organization outside the station: It may include setting reasonable pedestrian passageway. Besides, passengers could be guided to the bus waiting area in batches.
-
(2)
Emergency bus organization: It may include setting reasonable emergency bus stops and managing general vehicles around the bus stops, which is convenient for emergency buses to arrive. Besides, we can choose suitable parking mode for emergency buses stop at bus stop, and select surface car parking or bicycle lane as temporary parking area for emergency buses.
-
(3)
Road traffic organization: It mainly includes road traffic organization and intersection traffic organization. As for road traffic organization, it may include reverse traffic organization, emergency lane settings, and controlling flow and speed of general vehicles. As for intersection traffic organization, we can adjust the signal timing of intersection, prohibit left turn on the intersection for general vehicles, and adopt one-way green wave control.
5 Evaluation Method Based on Simulation
5.1 Simulation Model
This paper presents simulation logical model of traffic management outside the station, which provides support for evaluation (as shown in Fig. 2). The traffic management simulation needs to cooperate with train operation adjustment simulation and station passenger flow organization simulation. Train operation adjustment simulation needs to finish train operation diagram adjustment for emergent events. Station passenger flow organization simulation needs to finish evacuation simulation for passengers transfer from station platform to outside of the station. Traffic management simulation is mainly for road and intersection traffic organization, emergency buses in and out of the bus stop, and organization for stop and parking. We can get evaluation indicators through simulation results, then evaluate the traffic management plan.

Simulation logical model of traffic management outside the station
According to Fig. 2, the input parameter of traffic management simulation is based on train operation adjustment simulation and station passenger flow organization simulation. The main steps of the simulation are as follows: (1) Arriving and departing time of trains can be got through train operation adjustment simulation. (2) Combining with passenger flow data, passenger arrival rate can be got through station passenger flow organization simulation. According to the rate, the number of emergency buses and departure interval can be determined, which are the key input parameters for traffic management simulation. (3) We can simulate the traffic management outside the station with these parameters.
In addition, the input parameters for the simulation are as follows. As for train operation adjustment simulation, the input parameters mainly include rail line data, rail transit station data, and signal system data; as for station passenger flow organization simulation, the input parameters mainly include the station building layout data, passenger flow data, and passenger characteristic data; as for traffic management simulation, the input parameters mainly include road network data, traffic demand data, traffic management, and control data.
Due to the lack of integrated simulation environment, we can simulate the train operation adjustment through RailSys software, the software includes accurate tools for running time calculation, infrastructure mapping, timetable construction and evaluation, and the planning of vehicle rosters [15], simulation steps for this software include infrastructure model creation, train model creation, traction calculation, train diagram design, trains operation simulation, and simulation result output. There are other related softwares, such as OpenTrack, STRESI, and so on. In addition, we simulate the station passenger flow organization and traffic management through Vissim software; the software is a microscopic simulation tool that can simulate vehicles running condition on links, junctions, and small networks at a high level of detail [16], there are other related softwares, such as Paramics, TransModeler, Aimsun, and so on. In order to ensure the evaluation results of different traffic management plans are comparable, we make the following assumptions: passenger demand is same in different plan, size, and performance of emergency buses are same, and road traffic environment for vehicle running is same.
5.2 Evaluation Model
It shall be first considered that how to quickly evacuate passengers to safe destination in emergency events of URT, so the capacity of the emergency evacuation shall be the primary indicator to estimate the rationality of plan, unreasonable plan is out of our study. The capacity of the emergency evacuation \( P \) means the number of passengers evacuated per hour, which is calculated by the following expression:
\( n \) is the simulation time, \( T \) the simulation cycle (h), \( N_{i} \) the number of passengers evacuated in simulation cycle.
The main body of traffic management includes evacuation passenger, emergency bus, and general vehicle. According to the three main bodies, we choose comprehensive indicators that can be available through simulation. (As tabulated in Table 2).
Traffic management plan outside the station is evaluated through a way for the combination of individual evaluation and comprehensive evaluation. At first, we estimate the rationality of plan. Then, we synthetically evaluate reasonable plan by TOPSIS model.
The technique for order of preference by similarity to ideal solution (TOPSIS) is a multi-criteria decision analysis method [17], which was originally developed by Hwang and Yoon in 1981 with further developments by Yoon in 1987, and Hwang, Lai and Liu in 1993. Besides, there are other comprehensive evaluation models, such as AHP, FCE, DEA, and so on, but TOPSIS model has the advantage of simple calculation process, and no strict requirements for sample size and distribution. However, it will lead the evaluation result unstable because of subjective weight. Therefore, we determine the weights of evaluation indicators with entropy evaluation method, so as to avoid subjectively determining weights. The following specific introduces the new TOPSIS model.
Supposing there is a decision problem, which the number of plans is \( n \) and the number of evaluation indicators is \( m \). The original data form is shown in the below table.
Evaluation object | Indicator 1 | Indicator 2 | … | Indicator m |
|---|---|---|---|---|
1 | \( x_{11} \) | \( x_{12} \) | … | \( x_{1m} \) |
2 | \( x_{21} \) | \( x_{22} \) | … | \( x_{2m} \) |
… | … | … | … | … |
n | \( x_{n1} \) | \( x_{n2} \) | … | \( x_{nm} \) |
Therefore, we can get a decision matrix, \( A = (x_{ij} )_{n \times m} \).
-
(1)
Standardizing the value of indicators in the decision matrix \( A \), then getting a standard decision matrix \( Z^{\prime} \), which is calculated by the following expression:
$$ z_{ij}^{\prime } = \frac{{x_{ij} }}{{\sqrt {\sum\nolimits_{i = 1}^{n} {x_{ij}^{2} } } }}\quad i = 1,2, \ldots ,n; \quad {\mkern 1mu} j = 1,2, \ldots ,m $$(2) -
(2)
Constructing the weighting decision matrix \( Z \), which is calculated by the following expression:
$$ z_{ij} = w_{j} z^{\prime}_{ij} \;\;\;\;\;\;i = 1,2, \ldots ,n; \quad j = 1,2, \ldots ,m $$(3)\( w_{j} \) the weight of evaluation indicator j.
We determine the weights of evaluation indicators with entropy evaluation method, and the entropy value of evaluation indicator \( j \) is \( H_{j} \), which is calculated by the following expression:
$$ H_{j} = \frac{1}{ - \ln n}\left( {\sum\limits_{i = 1}^{n} {f_{ij} } \ln f_{ij} } \right)\;\;\;\;\;\;i = 1,2, \ldots ,n;j = 1,2, \ldots ,m $$(4)$$ f_{ij} = \frac{{(1 + z^{\prime}_{ij} )}}{{\sum\nolimits_{i = 1}^{n} {(1 + z^{\prime}_{ij} )} }} $$(5)The weight of evaluation indicator is \( w_{j} \), which is calculated by the following expression:
$$ w_{j} = \frac{{1 - H_{j} }}{{n - \sum\nolimits_{j = 1}^{m} {H_{j} } }},\sum\limits_{j = 1}^{m} {w_{j} = 1} $$(6) -
(3)
Determine the ideal solution \( Z^{ + } \) and negative ideal solution \( Z^{ - } \), which are calculated by the following expression. The evacuation indicators are divided into “benefit type” and “cost type,” the greater benefit type indicators are better, and the smaller cost type indicators are better. The index set of benefit type is \( L \), and the index set of cost type is \( L^{\prime} \).
$$ Z^{ + } = (z_{1}^{ + } ,z_{2}^{ + } , \cdot \cdot \cdot ,z_{m}^{ + } ) = \{ ({ \hbox{max} }z_{ij} \left| {j \in L} \right.),({ \hbox{min} }z_{ij} \left| {j \in L^{\prime}} \right.)\left| {i = 1,2, \ldots ,n} \right.\} $$(7)$$ Z^{ - } = (z_{1}^{ - } ,z_{2}^{ - } , \cdot \cdot \cdot ,z_{m}^{ - } ) = \{ ({ \hbox{min} }z_{ij} \left| {j \in L} \right.), ( {\text{max}}z_{ij} \left| {j \in L^{\prime}} \right.)\left| {i = 1,2, \ldots ,n} \right.\} $$(8) -
(4)
Calculating the distance \( S_{i}^{ + } \) that plan i to the ideal solution \( Z^{ + } \), and the distance \( S_{i}^{ - } \) that plan i to the negative ideal solution \( Z^{ + } \), which are calculated by the following expression:
$$ S_{i}^{ + } { = }\sqrt {\sum\limits_{j = 1}^{m} {(z_{ij} - z_{j}^{ + } )^{2} } } \;\;\;\;\;\;i = 1,2, \ldots ,n $$(9)$$ S_{i}^{ - } { = }\sqrt {\sum\limits_{j = 1}^{m} {(z_{ij} - z_{j}^{ - } )^{2} } } \;\;\;\;\;\;i = 1,2, \ldots ,n $$(10) -
(5)
Calculating the relative adjacent degree \( C_{i} \) that plan i to the ideal solution, which is calculated by the following expression. If the value of \( C_{i} \) is greater, the implementation effect of the plan is better.
$$ C_{i} { = }\frac{{S_{i}^{ - } }}{{S_{i}^{ - } + S_{i}^{ + } }}\;\;\;\;\;\;i = 1,2, \ldots ,n $$(11)
6 Case Analysis
We chose the metro accident case in Shanghai Metro Line 2 for analysis. Assume that the rail line disruption happens in Jiangsu Road station to West Nanjing Road station section. According to Shanghai Metro Emergency Response Plan [18], Metro emergency management department shall take a part route running mode in East Xujing station to Jiangsu Road station section, and People’s Square station to Pudong International Airport station section. (As shown in Fig. 3).

Illustration of metro accident case in Shanghai Metro Line 2
6.1 Determining Traffic Management Area Outside the Station
We chose Jiangsu Road station as the object of study, which is the turn back station that is responsible for emptying all the passengers, so it has a great influence on traffic operation outside the station. Jiangsu Road station is located in Changning District of Shanghai, which is the transfer station that includes Metro Line 2 and Metro Line 11. In order to make study more targeted, we referenced the standard about traffic impact assessment scope in Transportation Impact Analyses for Site Development [19] and then determined the traffic management area (as shown in Fig. 4). In the area, Line 11 station is located in Jiangsu Road, and Line 2 station is located in Yuyuan Road. There are bus stops around No. 1/3/5 subway exit, No. 3 bus stop is far from No. 8 subway exit. In addition, there are two bus routes through Jiangsu Road station to People’s Square station section, which parallels the Metro Line 2.

The traffic management area outside the Jiangsu Road station
We investigated the traffic conditions and architectural layout in the area On June 1, 2015, between 7:00 am and 9:00 am, which provided real data for simulation experiments. The regional OD traffic flow is tabulated in Table 3.
6.2 Traffic Management Plan Design
Jiangsu Road station is the turn back station that is responsible for emptying all the passengers, so bridging passenger flow demand is mainly decided by the number of passengers that the train empty when it arrives at the station, and the proportion that passengers choose bridging bus. The number of passengers can be calculated by passenger flow OD and arriving and departing time of trains; the calculation of the proportion that passengers choose bridging bus can refer to our previous research [20], this research is based on passenger travel behavior characteristics in emergent events of URT, which used the result of passenger travel behavior survey and Stated Preference survey as basic data and proposed passenger behavior distribution Logit model. We chose cost, SDB, and MRSQ as influencing factors, and calculate the utility value of three modes (URT, bus, and other modes). Then, the results were imported into Logit model. We can get selected portion of three modes, respectively, as 75, 14, and 11 %. Finally through station passenger flow simulation, we can get bridging passenger flow demand as 2082 people per hour in Jiangsu Road station.
For the design of traffic management plan outside the station, it should be considered from the following four points: firstly, ensuring passenger evacuation safety and quickly; secondly, passenger evacuation should be mainly through public transportation, thirdly, it can implement traffic separation in the area; lastly, minimizing the impact on background traffic. In view of this, we proposed three representative traffic management plans; design logic of the plans is shown in Fig. 5. In the figure, emergency bus priority level reflects passenger evacuation efficiency and the influence degree on general vehicles reflects the degree of background traffic disturbed. The higher emergency bus priority level shows that traffic management was more biased toward to bus transportation; therefore, influence degree on general vehicles is higher. In addition, emergency rescue vehicles have strict priority, which do not exist plan optimization problems.

Design logic of traffic management plans
-
(1)
Plan 1 (No emergency traffic management)
This plan do not have emergency traffic management, which maintains the current traffic management. (As shown in Fig. 6)
Fig. 6 
Illustration of traffic management plan 1
-
(2)
Plan 2 (Partial priority)
Main content is as follows (as shown in Fig. 7).
Fig. 7 
Illustration of traffic management plan 2
-
Jiangsu Road vehicles ban left in Jiangsu Road Yuyuan Road intersection (except emergency vehicles) and the intersection signal phase changes into two phase.
-
Setting bridging bus route, which starts from Jiangsu Road station to People’s Square station, buses depart from two stations at the same time. There are 5 buses every batch and departure interval is 10 min.
-
Setting emergency bus stop around the No 8. subway exit. Emergency buses enter into the traffic management area from the west side of Yuyuan Road or the north side of Jiangsu Road.
-
Setting bicycle lane as temporary parking area for emergency buses in Jiangsu Road, return trip buses empty all the passengers at No 2. Buses stop, then return to temporary parking area through Anxi Road and Changning Road.
-
-
(3)
Plan 3 (Absolute priority)
Mainly content is as follows (as shown in Fig. 8).
Fig. 8 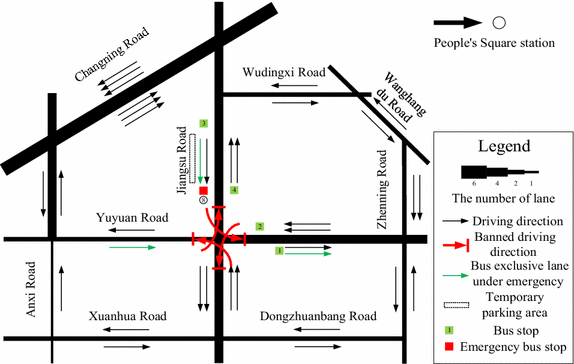
Illustration of traffic management plan 3
-
All the vehicles ban left in Jiangsu Road Yuyuan Road intersection (except emergency vehicles) and the intersection signal phase changes into three phase, which includes emergency bus special signal.
-
Setting bridging bus route, which starts from Jiangsu Road station to People’s Square station, buses depart from two stations at the same time. There are 5 buses every batch and departure interval is 10 min.
-
Setting emergency bus stop around the No 8. subway exit. Emergency buses enter into the traffic management area from the west side of Yuyuan Road or the north side of Jiangsu Road. Setting bus exclusive lane under emergency in Jiangsu Road and Yuyuan Road.
-
Setting bicycle lane as temporary parking area for emergency bus in Jiangsu Road, return trip buses empty all the passengers at No 2. Buses stop, then return to temporary parking area through Anxi Road and Changning Road.
-


6.3 Analysis of Simulation Result
We got simulation results through Vissim and Railsys software. The input parameters for RailSys and Vissim are shown in Table 4.
Then, we obtained evaluation indicators through the calculation. The following specific analysis shows the evaluation results.
-
(1)
Estimate the rationality of plans:
As shown in Fig. 9, in plan 2 or plan 3, the number of passengers evacuated per hour is much greater than plan 1. Bridging passenger flow demand is 2082 people per hour, so plan 2 or plan 3 can satisfy flow demand; however, plan 1 cannot satisfy flow demand. Therefore, plan 2 or plan 3 is a reasonable plan.
Fig. 9 
The simulation result of the capacity of emergency evacuation
-
(2)
Comprehensive evaluation:
In order to test the availability of the evaluation model, we analyzed all the three plans’ evaluation indicators, it just shall compare evaluation results of plan 2 and plan 3 during the actual operation. Comprehensive evaluation indicators are shown in Table 5.
Table 5 The simulation result of comprehensive indicators In the evaluation results of service level of evacuation passenger, we can see plan 1 is at a low level. In the evaluation results of running condition of emergency bus, we can see evacuation efficiency of emergency bus is the highest in plan 3. In the evaluation results of running condition of general vehicle, we can see plan 3 has the greatest impact on traffic background.
Evaluation results were calculated through TOPSIS model, then we can get the weight of indicator and the relative adjacent degree \( C_{i} \) of plan (as tabulated in Table 6). According to the explanation of \( C_{i} \), \( C_{2} > C_{3} > C_{1} \), we can draw a conclusion that plan 2 is optimal.
Table 6 The weight of indicator and the relative adjacent degree of plan

6.4 Evaluate Feedback
For plan 1, it can rearrange train operation adjustment scheme, which choose other stations to empty passengers in addition to Jiangsu Road station. Besides, it shall control transit passenger flow, and guide passengers to transfer in URT system, which can reduce bridging passenger flow demand.
For plan 2 or plan 3, it can encourage passengers transfer to the ground public transportation. At the same time, it can speed up facilities speed in the station, thus reduce passenger transfer time. Especially for plan 3, it can induce general vehicles make a detour, which can ensure general vehicles driving smoothly. If the measure could be executed, we can consider choosing plan 3.
In addition, based on the same background traffic, we conduct sensitivity analysis for bridging passenger flow demand, which includes average evacuation network clearance time VS demand, and relative adjacent degree VS demand (as shown in Fig. 10). As shown in Fig. 10a, average evacuation network clearance time for plan 1 is the longest, when passenger demand is greater than 3000 people, the clearance time for plan 2 is longer than plan 3. As shown in Fig. 10b, when passenger demand is 0 people, relative adjacent degree for plan 1 is the largest, plan 1 is optimal. When passenger demand is between 500 people and 2000 people, relative adjacent degree for plan 2 is largest, plan 2 is optimal. When passenger demand is between 2500 people and 3500 people, relative adjacent degree for plan 3 is largest, plan 3 is optimal.

Sensitivity analysis for bridging passenger flow demand
7 Conclusions
Traffic management objects should have the right to share road infrastructure, so the capacity should be orderly distributed under a certain space–time condition, which meets the demand of each object to finish the evacuation task.
In this research, we studied on traffic management plan evaluation outside the station with simulation, compared the merits of different plans. Firstly, we analyzed conversion process from metro passenger flow to bus traffic flow. Then, we developed logical model of traffic management simulation and presented transitive relation among different simulation types. In addition, we extracted key indicators around the three objects: passenger, emergency bus, and general vehicle. Finally, in the case of Jiangsu Road station, this paper designed three representative plans, the results showed that the second “partial priority plan” is optimal through evaluation the method based on simulation, which provides decision support for URT emergency management. At the same time, we conducted sensitivity analysis for bridging passenger flow demand, we can draw a conclusion that when passenger demand is small, we should implement “no emergency traffic management plan”, but when passenger demand is large, we should implement “partial priority plan” or “absolute priority plan”. Its further research is study on train operation adjustment method in disruptions of URT networks, which cooperates with traffic management plan to make the evacuation result best.
References
Sinuany-Stern Z, Stern E (1993) Simulating the evacuation of a small city: the effects of traffic factors. Socio Econ Plan Sci 27(2):97–108
Han L D, Yuan F (2005) Evacuation modeling and operations using dynamic traffic assignment and most desirable destination approaches. In: 84th Annual Meeting of the Transportation Research Board. Washington, DC. Transportation Research Board, Washington, pp 2401–2406
Kwon E, Pitt S (2005) Evaluation of emergency evacuation strategies for downtown event traffic using a dynamic network model. Transp Res Rec J Transp Res Board 1922:149–155
Kepaptsoglou K, Karlaftis MG (2009) The bus bridging problem in metro operations: conceptual framework, models and algorithms. Public Transp 1(4):275–297
Darmanin T, Lim C, Gan HS (2010) Public railway disruption recovery planning: a new recovery strategy for metro train Melbourne. In: Proceedings of the 11th Asia pacific industrial engineering and management systems conference, 7
Jin JG, Tang LC, Sun L et al (2014) Enhancing metro network resilience via localized integration with bus services. Transp Res Part E Logist Transp Rev 63:17–30
Jin JG, Teo KM, Odoni AR (2015) Optimizing bus bridging services in response to disruptions of urban transit rail networks. Transp Sci 1–15. doi:10.1287/trsc.2014.0577
Karlaftis M, Kepaptsoglou K, Stathopoulos A (2005) Part 3: paratransit: paratransit service optimization for special events. Transp Res Rec 1903:64–77
Carson JL, Bylsma RG (2003) Transportation planning and management for special events. Nchrp Synth Highw Pract 1–10
Ye YF, Hu QF, Huang HW (2009) The simulation analysis of passenger evacuation in one metro station based on exodus. ICCTP 2009@s critical issues in transportation systems planning, development, and management, pp 1–7. doi:10.1061/41064(358)22
Wang X, Chen S, Zhou Y, Peng H, Cui Y (2013) Simulation on passenger evacuation under fire emergency in Metro station. In: 2013 IEEE international conference on intelligent rail transportation (ICIRT), pp 259–262
Liu, QQ, Wu GH (2007) Evacuation simulation analysis of fires in subway junction station. In: Proceedings of the first international symposium on geotechnical safety & risk ISGSR2007
Lei W, Li A, Gao R, Hao X, Deng B (2012) Simulation of pedestrian crowds’ evacuation in a huge transit terminal subway station. Phys A 391(22):5355–5365
Han X, Ma JN, Cong BH (2012) Simulation analysis on crowd evacuation of the subway train fire. Adv Mater Res 424:1215–1219
Chen SJ, Hwang CL (1992) Fuzzy multiple attribute decision making methods. Springer, Berlin
Radtke A, Bendfeldt J (2001) Handling of railway operation problems with RailSys. In: Proceedings of the 5th world congress on rail research, pp 1–9
Fellendorf M (1994) VISSIM: a microscopic simulation tool to evaluate actuated signal control including bus priority. In: 64th Institute of transportation engineers annual meeting, pp 1–9
Shanghai Municipal Transportation Commission (2006) Shanghai metro emergency response plan. (in Chinese)
Institute of Transportation Engineers (2006) Transportation impact analyses for site development. ITE, Washington
Teng J, Liu WR (2015) Development of a behavior-based passenger flow assignment model for urban rail transit in section interruption circumstance. Urban Rail Transit 1–12
Acknowledgments
This research was sponsored by the Science and Technology Research Foundation for Transportation of China (Grant No. 2015318221020).
Open Access
This article is distributed under the terms of the Creative Commons Attribution 4.0 International License (http://creativecommons.org/licenses/by/4.0/), which permits unrestricted use, distribution, and reproduction in any medium, provided you give appropriate credit to the original author(s) and the source, provide a link to the Creative Commons license, and indicate if changes were made.
Author information
Authors and Affiliations
Corresponding author
Additional information
Editor: Xuesong Zhou
Rights and permissions
Open Access This article is distributed under the terms of the Creative Commons Attribution 4.0 International License (https://creativecommons.org/licenses/by/4.0), which permits use, duplication, adaptation, distribution, and reproduction in any medium or format, as long as you give appropriate credit to the original author(s) and the source, provide a link to the Creative Commons license, and indicate if changes were made.
About this article

Cite this article
Teng, J., He, C., Liu, X. et al. Traffic Management Plan Evaluation Outside the Station in Emergent Events of Urban Rail Transit. Urban Rail Transit 2, 16–27 (2016). https://doi.org/10.1007/s40864-016-0034-0
Received:
Revised:
Accepted:
Published:
Issue Date:
DOI: https://doi.org/10.1007/s40864-016-0034-0