
Abstract
Common interventions to control the spread of cholera include improving sanitation, hygiene, and access to safe drinking water and providing epidemic regions with sufficient treatment kits and oral vaccines. Due to resources limitation, these interventions should be guided by a risk assessment of cholera-affected regions, thereby targeting regions based on their risk level. Cholera risk assessment is very challenging because of the lack of precise and reliable data. This study proposes an approach for cholera risk assessment and vaccine allocation, which consists of two phases: (i) cholera risk assessment, where a fuzzy inference system (FIS) is proposed to evaluate the risk level of cholera-affected regions based on five cholera risk indicators: (1) attack rate, (2) case fatality rate, (3) the number of internally displaced persons, (4) accessibility of water, sanitation and hygiene, and (5) accessibility of cholera treatment; (ii) cholera vaccine allocation, where a mixed-integer programming model is used to optimize the allocation of limited vaccine doses among multiple regions over multiple periods while considering the risk level, population of regions, and vaccine efficacy. The model answers the questions of where, what amounts, and when to send vaccines during a 2-year horizon. Implementation of the proposed approach is illustrated using a case study from Yemen, which is currently experiencing the world’s worst cholera outbreak according to the World Health Organization. The results reveal the usefulness of the proposed approach in mapping the cholera risk, which in turn is used as effective guidance for the allocation of cholera vaccine.
1 Introduction
Cholera is an acute watery diarrheal disease that causes severe dehydration, vomiting, and fever; it kills victims rapidly if not treated [1]. The disease represents a serious threat to public health in developing countries. According to Médecins Sans Frontières (MSF) [2], there are about 1.3 to 4 million cholera cases with 21,000–143,000 deaths globally per year. The World Health Organization (WHO) attributes the spread of cholera to the lack of safe drinking water, sanitation and hygiene (WASH), contaminated food, and inadequate health care. The effect of cholera is more drastic in armed conflict areas, where environmental and health infrastructure have been destroyed or disrupted. Moreover, armed conflicts result in the displacement of people to camps that lack essential human services, which in turn makes displaced people more susceptible to communicable diseases such as cholera [3]. Several studies claimed that cholera is a conflict-driven disease, and its outbreak is exacerbated by war and civil fighting. There is a close link between the cholera outbreak and conflict-related risk factors, such as people displacement, and failure of WASH and healthcare systems [4, 5].
Various interventions are used to mitigate and control a cholera outbreak, among them are (1) rehabilitating WASH and health infrastructure; (2) enhancing hygiene and food safety practices; (3) strengthening epidemiological and laboratory surveillance and data management systems for epidemic monitoring and early detection [3]. However, these interventions provide a medium-to-long-term solution and may be insufficient during an outbreak. Furthermore, they are challenging, costly, and time-consuming to implement, especially in conflict-ridden or low-income countries [6, 7]. As a short-term solution, oral cholera vaccines (OCVs) can help control the spread of cholera and provide an immediate relief while WASH rehabilitations and health infrastructure investments continue [6].
However, in countries where cholera is an outbreak or even endemic, it is not possible to vaccinate the entire population (throughout a country regardless of risk), where the vaccine production capacity is limited [3]. The speed at which cholera spreads makes allocating vaccines and determining targeted regions a tricky decision for policymakers, especially when available doses of the vaccine are limited, and many individuals need vaccination. The foremost questions that confront community health experts and international volunteers fighting a cholera epidemic are how should available doses be allocated through populations and which regions should be targeted [8]? The vaccination strategy should be guided by a risk assessment of cholera-affected regions to define hotspots with high risk, which will allow effective and fair allocations of vaccines [3, 8].
Compared with other infectious diseases, few studies have investigated the vaccine allocation problem of cholera. The problem has received limited investigation from the cholera perspective, where the factors and parameters that should be considered when modeling the problem may differ from those considered with other infectious diseases. This could be because cholera is prevalent in low-income and conflict countries, where scientific research is often neglected or not supported and financial resources are limited. Studies that investigated the cholera vaccine allocation problem used the attack rate as a risk indicator to prioritize targeted regions and allocate doses [9,10,11,12,13]. However, according to WHO and MSF, several factors should be considered as cholera risk indicators when allocating the vaccine, especially in armed conflict areas, including (1) attack rate, and (2) case fatality rate, which are indicators for the severity of the epidemic; (3) the number of internally displaced persons (IDPs), who are particularly more susceptible to diarrheal diseases because they do not have access to adequate WASH, health services, safe food, and live in camps with precarious living conditions; (4) accessibility of population to WASH; and (5) accessibility of population to health care to identify and treat cases (i.e., regions with timely access to cholera treatment are less risky than hard-to-reach areas) [8]. Given these factors, vaccination priority should be given to regions with a high attack rate, great case fatality rate, many IDPs, and poor accessibility to WASH and health services.
Up to this point, no studies considered all the above-mentioned cholera risk indicators to guide the allocation of cholera vaccine. In addition, there is no systematic approach to assess the overall cholera risk resulting from those risk indicators. This study aims to fill this research gap by introducing a risk assessment and optimization model for cholera vaccine allocation. The objective is to assess the overall risk of vaccine-targeted regions, and optimize the allocation of vaccine doses over multiple time periods while considering the overall risk and population of regions, vaccine efficacy, and limitation on resources (e.g., vaccine quantities). Cholera risk assessment is very challenging because of the lack of precise and reliable data, and there is a lack of studies that address the inherent imprecision in cholera-related data. Gaining precise data requires real-time information on the progress of the cholera outbreak, IDPs, WASH, and healthcare system situation [8]. However, this may not be possible to achieve in conflict-ridden or low-income countries. To overcome this challenge, this study proposes a fuzzy inference system (FIS) model for the cholera risk assessment. FIS is a powerful tool to deal with the uncertainty in the evaluation of criteria [14]. FIS can nonlinearly map input variables to output variables by providing proper functions that characterize the relationship between input and output variables [15]. The proposed risk assessment model provides valuable cholera risk mapping and effectively guides interventions, including vaccination.
The remainder of this paper is organized as follows: Sect. 2 reviews the relevant literature. Section 3 introduces the fundamental concepts of the fuzzy inference system. Section 4 presents the research methodology. Section 5 discusses a case study from Yemen to assess the proposed approach. Finally, conclusions and future research appear in Sect. 6.
2 Relevant Literature
A key operational planning problem in managing vaccine supply chains is the allocation of limited vaccine doses over multiple eligible regions or population subgroups. Duijzer et al. [16] comprehensively reviewed studies on the vaccine supply chain, including those that investigated the vaccine allocation problem. Several operations research techniques have been used to solve the vaccine allocation problem including differential equation-based modeling [17, 18], simulation modeling [19, 20], stochastic programming [21, 22], and mixed-integer linear programming (MILP) [23, 24]. The vaccine allocation problem has been studied for a wide range of infectious diseases such as HIV [25], polio [26], hepatitis B [27], and tuberculosis [28]; however, most studies focused on influenza [17,18,19, 21, 22, 24, 29, 30]. Some of those studies are reviewed below.
Patel et al. [30] integrated stochastic simulation with a genetic algorithm to identify an optimal allocation strategy for the influenza vaccine. Their objective was to minimize the number of infections and deaths when the available quantity of vaccine doses is limited. Matrajt et al. [29] employed mathematical modeling and a genetic algorithm to find the best allocation for the influenza vaccine to cover multiple eligible regions. Their model aimed to minimize the attack rate while considering the limitation of vaccine quantities. Dalgıç et al. [17] used agent-based simulation and differential equations-based modeling to generate various functional policies for allocating limited influenza vaccine doses over multiple age groups with different incident rates. These policies were evaluated using several metrics, such as vaccination, infection, and mortality costs. Hovav and Tsadikovich [24] developed a MILP model for optimizing various decisions in the influenza vaccine distribution chain, including optimal allocation of doses among multiple population groups and the optimal number of shipments among manufacturers, distribution centers, and clinics. Their objective was to minimize the portion of non-vaccinated patients and the total cost of transportation, vaccine storage, administration, and shortages. Günay et al. [23] developed a MILP model to find the optimal quantities of vaccine required to maximize the percentage of refugees vaccinated against polio based on different priority rules such as age and population size.
Several studies have focused on the allocation problem of the cholera vaccine. For instance, Chao et al. [10] used a cholera transmission model, which divided the population into susceptible, exposed, infectious, and recovered compartments, to assess different vaccination policies. Their objective was to maximize the vaccine coverage rate for areas with substantial exposure to Vibrio cholera. Troeger et al. [12] developed a cost-effectiveness tool to evaluate different cholera vaccine allocation policies, including (1) age-based policy, where children were given higher priority for vaccination, (2) geographic-based policy, where attack rate was used to prioritize regions, and (3) population-based policy, where population subgroups with poor access to the cholera treatment were given the higher priority. Only one factor was considered with each policy when prioritizing targeted groups or regions. Moreover, the study did not use an optimization approach for the allocation problem. Instead, sensitivity analysis was employed to find a reasonable solution that reduces the total cost of the vaccination campaign. Moore and Lessler [11] developed a decision-making framework that optimally allocates cholera vaccine doses between epidemic and endemic areas. They used differential equation-based modeling to formulate the dynamic transition of patients through susceptible, exposed, infected, and recovered stages of the disease. Their goal was to maximize the number of cholera cases that could be prevented by vaccination. Du et al. [31] studied a location-specific resource allocation problem for cholera outbreak interventions over multiple periods. They formulated the problem as a non-linear optimization model using ordinary differential equations that represent disease transmission dynamics. Their objective was to determine optimal intervention resource allocation decisions over multiple periods under system dynamics and uncertain disease transmission parameters. Yang and Wang [32] used a susceptible-infected-recovered model to measure, analyze, and allocate limited medical resources to encounter cholera outbreak in Yemen. Qasem et al. [13] proposed a MILP model that allocates cholera vaccines among multiple age groups and populations. In their study, regions with higher risk age groups and larger population were given priority for cholera vaccine doses. Smalley et al. [9], the most relevant work to this research, developed a MILP model to optimize the allocation of cholera vaccine doses over multiple age groups and regions in Bangladesh to minimize the number of cases. They divided targeted regions into high risk, medium risk, and low risk based on attack rates. They concluded that allocating cholera vaccine doses based on the attack rate is a cost- and life-saving strategy. They confirmed that detailed and precise surveillance data is crucially important to determine the risk level of targeted groups.
This research differs from Smalley et al. [9] in the following four aspects: (1) this study investigates the vaccine allocation problem in armed-conflict areas; (2) five cholera risk factors are considered to assess the overall cholera risk. The motivation behind this is that MSF and WHO assert that attack rate is not only the factor that should be considered when allocating cholera vaccine in armed-conflict areas, but also other factors including case fatality rate, number of IDPs, accessibility to WASH, and accessibility to cholera treatment [8]. In addition, there is a lack of studies that consider all these factors together when allocating cholera vaccines; (3) this study considers data imprecision for cholera risk factors when assessing the overall cholera risk in armed conflict areas, where precise data is not possible to obtain; and (4) this study is motivated by a real-world problem of cholera outbreak in an armed-conflict region in which millions of people need vaccination while vaccine doses are limited and need to be effectively allocated. To this end, a FIS model is proposed to assess the overall risk of cholera-affected regions based on these five cholera risk indicators. A MILP model is introduced to optimize the allocation of cholera vaccine doses through multiple periods and regions. The risk scores generated by the FIS model are used in the MILP model to guide the allocation of limited cholera vaccine doses. A case study is presented to demonstrate the applicability of the proposed approach. The case study uses real data collected from Yemen, which is facing the world’s worst cholera outbreak. The proposed work can guide the allocation of cholera vaccine and cholera risk mapping in developing countries, where data is not completely available.
3 Fuzzy Inference System
Fuzzy inference systems, which use fuzzy sets that were introduced by Zadeh [33], represent imprecise or vague knowledge. A fuzzy set is defined as a class of objects mapped to a membership function ∊ [0, 1], which defines the membership degree of objects to the corresponding set. Fuzzy sets represent the building block of fuzzy rules. Fuzzy rules are defined as a set of linguistic statements that determine how the decision is made in a FIS [34]. Fuzzy rules are used to create relationships among several qualitative factors and establish a smooth interface between qualitative factors involved in the rules and numerical inputs and outputs of the fuzzy model [35]. The general form of rules is “IF x is A THEN y is B.” The \(IF{ }\) part is known as the antecedent, which includes several preconditions, and the \(THEN{ }\) part is called the consequent that defines the corresponding output. \(A{ }\) and \(B{ }\) are fuzzy sets that identify the linguistic input and output variables, x and y, which belong to the input and output spaces X and Y, respectively.
The main components of FIS, as shown in Fig. 1, are: (1) the rule base that encompasses fuzzy if–then rules, which formulate the problem based on knowledge of experts, (2) the database that contains input and output variables, their respective linguistic variables used in fuzzy rules, and their corresponding fuzzy values, (3) the fuzzification unit that converts crisp inputs to fuzzy inputs, (4) the fuzzy inference engine that includes rules information, and implements rule composition, implication, and aggregation to eventually generate fuzzy outputs, and (5) the defuzzification unit that converts fuzzy output to crisp output. These components work together to execute the process of mapping from a given input to an output. The following briefly explains how FIS works.

The main components of FIS
First, crisp inputs are mapped to fuzzy values using a set of input membership functions that characterize fuzzy sets of the antecedent part of rules (fuzzification). This determines the membership degree of inputs to each fuzzy set. Second, using the fuzzy inference engine, the fuzzy input values for each activated rule are combined using the t-norm (minimum) operator for rules with the AND logic connector, and the s-norm (maximum) operator for rules with the OR logic connector, as shown in Eqs. (1) and (2), respectively [34].
Third, for each activated rule, the fuzzy inference engine implements the implication relation between the rule consequent and the fuzzy value obtained from logic operations. The input for the implication operation is a single fuzzy number for the rule antecedent, while the output is a fuzzy set. The common implication operator used is the minimum (Mamdani) that is expressed in Eq. (3) [36].
Fourth, the output fuzzy number of each rule is defined by the composition between the implication relation and a fuzzy singleton. The max–min operator presented in Eq. (4) is the most common fuzzy composition operator of fuzzy relations [37].
Then, the resulting outputs of all activated rules are aggregated into a single fuzzy set using an aggregation operator. The aggregation can be accomplished by different operators, such as Max and Min. The Max operator presented in Eq. (5) is preferred when compensation between input variables is desirable [36].
Finally, fuzzy output numbers are converted into crisp outputs in the defuzzification unit. The most common defuzzification method is the center of area (CoA), expressed in Eq. (6).
where n is the number of rules, \(C_{i}\) is the center of gravity, and \(A_{i }\) is the area of each individual implication.
FIS has been employed in a wide variety of applications and disciplines such as multi-criteria decision-making problems [35, 38], manufacturing systems [39], supply chains performance [40, 41], supplier selection in supply chains [42,43,44], and medical diagnosis and healthcare [45]. FIS has also been broadly used in risk assessment to overcome the intrinsic uncertainty associated with risk measures [46,47,48]. In this study, FIS is used to evaluate the overall risk level of cholera-affected regions while considering the variations in cholera risk indicators.
4 Research Methodology
As shown in Fig. 2, the proposed research methodology includes two phases: cholera risk assessment using Mamdani FIS, and cholera vaccine allocation, where a MILP model is proposed to determine the optimal allocation of cholera vaccines over multiple time periods and regions.

Proposed framework of cholera risk assessment and vaccine allocation
4.1 Phase I: Cholera Risk Assessment
The FIS model is used to determine overall risk scores of cholera-affected regions based on the five cholera risk indicators. The FIS cholera risk assessment model comprises three steps: (1) identifying cholera risk indicators and collecting the relevant data, (2) constructing fuzzy if–then rules based on experts’ knowledge, and (3) implementing the fuzzy inference process.
- Step 1:
-
is to determine cholera risk indicators and collect their respective data to assess the overall cholera risk. According to WHO and MSF recommendations, five cholera risk indicators should be taken into consideration when allocating OCVs during cholera outbreaks and humanitarian emergencies. Table 1 shows the indicators along with their descriptions. The indicators are the input variables for the fuzzy model. The illustrative case study presented in Sect. 5 demonstrates in more detail how the data are collected and preprocessed.
Table 1 Description of cholera risk indicators - Step 2:
-
defines the FIS model’s fuzzy rules, which are formulated in linguistic terms as if–then statements. Each rule has two parts: the antecedent, which represents the inputs (cholera risk indicators), and the consequent, which represents the result (overall risk). Fuzzy rules formulate the relationship between cholera risk indicators and the overall risk. The rules are defined based on the perception of six epidemiological academic and medical experts who have in-depth knowledge about cholera and the effect of cholera risk indicators. The experts have a clear perception of the health system situation in the country that is considered for the case study. The epidemiological academic experts include a professor of epidemiology and public health and his three graduate researchers. The team has worked on several research projects on public health, tropical and infectious diseases, and medical parasitology funded by several health organizations such as WHO. The epidemiological medical experts include two physicians of public health and infectious diseases at one of the largest cholera treatment centers in the country under study. Figure 3 shows the steps that have been implemented to construct the fuzzy rules. First, the linguistic terms for each input (antecedent) variable are defined. To do so, k-means clustering is used to cluster the data collected for the input variables (presented in Sect. 5.1). Three clusters have been identified for each input variables; accordingly, three linguistic terms are defined: “low,” “medium,” and “high” for AR, CFR, and IDPs variables, and “poor,” “fair,” and “good” for accessibility to WASH and CT variables. Therefore, the total potential number of rules is \(3^{5}\) = 243. Second, the number of linguistic terms for the output variable and the consequent for each potential rule are determined. Five linguistic terms are proposed for the output variable: “very low,” “low,” medium,” high,” and “very high.” The consequent of each rule is determined upon the agreement of all experts. Then, a sensitivity analysis is conducted to check the validity of the proposed fuzzy rules. The experts continue updating and editing the consequents of the fuzzy model rules until the sensitivity analysis results show that the fuzzy model logically describes the relationship between the input and output variables (Table 2 presents the final rule base of the FIS model).
Fig. 3 
Steps to construct the fuzzy rules
Table 2 Rules for the fuzzy system The factorial design technique was used in several studies for sensitivity analysis [49,50,51]. In this study, a full 3k factorial design is utilized to carry out the sensitivity analysis and assess the main and interaction effects of cholera risk indicators on the overall risk based on fuzzy rules of the FIS model presented in Table 2. The FIS model has five input variables that are tested at three levels, low, medium, and high for AR, CFR, and IDPs, and poor, fair, and good for accessibility to WASH, and cholera treatment (CT). The levels of input variables are set to 0, 2.5, and 5. The total number of factor-level combinations is \(3^{5}\) = 243, which are evaluated in random order.
Figures 4 and 5 present the main and interaction effects of the cholera risk indicators on the overall risk, respectively. There is a proportional relationship between the AR, CFR, and IDP indicators, and the overall risk. On the other hand, there is an inverse relationship between the accessibility for the WASH indicator and the overall risk, and the accessibility for the CT indicator and the overall risk. It can also be noted that the accessibility for the CT indicator has a slightly greater effect on the overall risk than other risk indicators. That is because the defined fuzzy rules lead to the predominance of this risk indicator over the other risk indicators. It could be inferred that making CT more easily accessible for patients and providing sufficient CT kits and equipment should be prioritized in order to mitigate the overall risk, where this is regarded as the first line of defense against cholera during outbreaks and humanitarian emergencies. This conforms with the recommendations of epidemiological experts and health organizations. The interaction plot also indicates that there are no statistically significant interactions among input variables as the lines are nearly parallel.
Fig. 4 
Main effects of cholera risk indicators on the overall risk
Fig. 5 
Interaction effects of cholera risk indicators on the overall risk
- Step 3:
-
FIS infers the overall risk from its respective risk indicators. First, the crisp values of input variables are converted to fuzzy sets (fuzzification). Fuzzy sets are represented by membership functions. In this study, according to the experts’ perception, triangular membership functions are used to characterize fuzzy sets of input and output variables, which are usually used in most fuzzy logic studies [52]. Triangular membership functions are quite suitable for risk assessment applications [46, 53]. Three fuzzy sets of membership functions are used for the inputs and five are used for the output as shown in Fig. 6a and b, respectively. Fuzzy sets in the form of linguistic terms and their corresponding fuzzy values on the numeric scale 0–5 for the inputs and output are presented in Tables 3 and 4, respectively.
Fig. 6 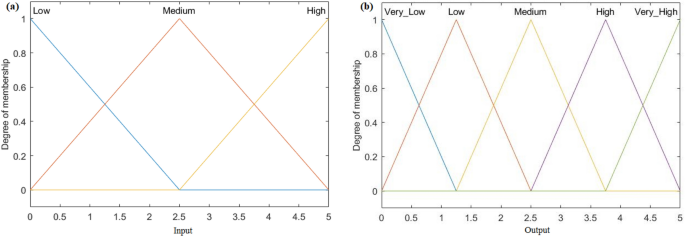
Membership functions for: (a) input variables, (b) output variable
Table 3 Linguistic variables to evaluate the antecedents Table 4 Linguistic variables to evaluate the consequent


Next, the fuzzy inference engine implements rule composition, implication, and aggregation to generate the fuzzy output. The fuzzy logic operators are chosen as follows:
-
The minimum operator to combine the fuzzy input values and generate the implied relationships between the antecedents and the consequent.
-
The max–min operator to find the composition between a fuzzy singleton and the implication relation for each activated fuzzy rule.
-
The maximum operator to aggregate the fuzzy outputs of all activated rules.
-
The center of area operator is used to convert the aggregated fuzzy output to crisp output.
The relationship between the overall risk and cholera risk indicators explained by the FIS model can be observed through surface response plots. As shown in Fig. 7, ten surface responses are generated, each surface shows the overall risk as a function of the combination of two risk indicators while the remaining three risk indicators are held constant at 2.5. These surfaces help decision-makers visualize and understand the effect of risk indicators on the overall risk.

Surface response plots for the fuzzy inference system where two risk indicators are varied while all other risk indicators are held constant at 2.5
The computational procedures for the proposed FIS are executed in MATLAB R2016b using the FIS toolbox. The case study that illustrates how the FIS model is applied will be discussed in Sect. 5.
4.2 Phase II: Cholera Vaccine Allocation
A MILP model is developed to determine the optimal allocation of cholera vaccines over multiple time periods and regions. The objective is to minimize cholera cases over multiple periods while considering the overall risk and population of regions, and vaccine efficacy up to 2 years. It is assumed that vaccines are administrated biannually over four 6-month periods. Vaccinated individuals receive a vaccine at the beginning of the respective period, and are not vaccinated again within the time horizon considered. The ultimate goal is to determine the optimal number of individuals in each region that should be vaccinated in each period when available vaccine doses are limited. The following describes the optimization model.
Sets:
\(R\) Set of geographical regions.
\(T\) Set of time periods.
Parameters:
\(p_{r,t}\) Population of region \(r\) during period \(t\), \(r \in\) \(R\), \(t \in T\).
\(Rl_{r}\) Base risk level of region \(r\) calculated from the fuzzy model.
\(Rl_{r,j}\) Risk level of vaccinated region \(r\) in the \(j\)th period following dosing, \(r \in\) \(R\), which is calculated from the base risk level and vaccine efficacy in the \(j\)th period since dosing. As the time horizon considered is 2 years, it is divided into four 6-month periods, \(j\) \(\in\)(1,2,3,4).
\(Q_{t}\) Quantity of vaccine doses available at period \(t\), \(t \in T\).
\(q\) Number of vaccine doses administered for one person.
Decision variables:
\(x_{r, t}\) Number of persons newly vaccinated in region \(r\) during period \(t\), \(r \in\) \(R\), t \(\in\)\(T\).
\(y_{r,t,i}\) Number of persons vaccinated \(i\) periods before period \(t\), and they are currently in region \(r\) in period \(t, r \in R, t \in T, i \in \left( {0, 1, 2, 3} \right)\).
Model
Equation (7) presents the objective function that minimizes the number of cholera cases while considering the risk level of regions and vaccine efficacy, where \(f_{r,t}\) represents the risk level in region \(r\) during period \(t\) that takes into consideration both vaccinated and unvaccinated persons (see Eq. 12). Constraint 8 ensures that the total administered doses do not exceed the total available doses of vaccine. Constraint 9 guarantees that the number of individuals who get vaccinated in a region over multiple periods does not exceed the population of that region. Constraint 10 calculates the number of persons vaccinated \(i\) periods before period \(t\). The number of vaccinated individuals must be a positive integer as restricted in constraint 11. \(f_{r,t}\) in the objective function reflects the benefit of vaccination at period t while considering all individuals vaccinated up to period t. The variable \(f_{r,t}\) is calculated as:
\(Rl_{r,j}\) is calculated as shown in Eq. (13), where \(VE_{j}\) is defined as the vaccine protective efficacy in the \(j\)th period following vaccination.
As an alternative approach, instead of using the fuzzy model to evaluate the overall cholera risk, the weighted average method can be utilized to calculate the overall risk score resulting from five risk indicators, where each of these risk indicators is given a certain weight based on the experts’ judgment. The resultant risk scores can then be utilized in the optimization model instead of the fuzzy scores. However, this approach does not consider the inherent imprecision in cholera-related data from armed conflict regions, where precise data is not possible to obtain. Therefore, the fuzzy model is a better approach to evaluate the overall cholera risk because it has the ability to effectively address the uncertainty associated with risk indicators and allows to integrate the knowledge of human experts and qualitative, quantitative, and judgmental data within an appropriate framework, which in turn provides valuable cholera risk mapping that can be used as effective guidance for the allocation of cholera vaccine.
5 Case Study
This section presents a case study to illustrate the applicability of the proposed approach for cholera risk assessment and vaccine allocation. The case study uses real-world data collected from Yemen, which is experiencing the world’s worst cholera outbreak according to WHO. An ongoing civil war has destroyed healthcare and sanitation systems and interrupted immunization activities. Thousands of people have been internally displaced and live without adequate food, water, housing, and sanitation. A United Nations (UN) report stated that about 14.8 million Yemeni have not been able to obtain suitable healthcare, and around 14.4 million people do not have access to safe water and sanitation [4]. As a result, the cholera outbreak has reached alarming levels, affecting millions of people and resulting in thousands of deaths. According to the latest WHO report, 2,316,197 suspected cholera cases have been cumulatively reported with 3910 deaths in Yemen from October 2016 to January 2020 [54].
In addition to an improvement of WASH, immunization with OCVs can play a significant role in controlling a cholera outbreak. According to [2], vaccination against cholera is implemented in three ways: (i) reactive vaccination, which is carried out in response to cholera outbreaks, (ii) preventive vaccination, which is usually carried out in cholera-endemic areas before cholera season, and (iii) pre-emptive vaccination, which is carried out in humanitarian-emergency regions, where an outbreak is high. The case study applies the pre-emptive method because the Yemen disaster is a humanitarian emergency. In that situation, all age groups are equally at risk of cholera exposure [2]. Therefore, in the case study, the population will not be differentiated by age and all age groups will be given the same priority for vaccination. The challenge for carrying out a vaccination campaign in humanitarian emergencies is the limited stock of vaccine doses relative to the large number of individuals who need the vaccine [2]. In such a case, healthcare organizations recommend adopting a single-dose strategy instead of the two-dose strategy. Though the efficacy of single-dose is lower than that of two doses, it provides coverage and rapidly protects as many of the at-risk population as possible, which may avert more cases and deaths when vaccine supplies are limited [2].
Yemen is divided into 22 governorates, each of which has different AR, CFR, IDPs, and accessibility to WASH and cholera treatment (CT). The objective of the case study is to first evaluate the overall risk resulting from risk indicators for each governorate using the proposed FIS model, and then allocate vaccine doses among those governorates in an effective manner using the optimization model. The allocation process considers the overall risk and population of each governorate, and vaccine efficacy for single vaccine doses for up to 2 years.
5.1 Cholera Risk Assessment
First, the values of the five cholera risk indicators are collected from health organizations that are concerned with the humanitarian situation in Yemen. Table 5 shows the quantitative data of risk indicators in their original units and corresponding values, collected for the 22 governorates. AR and CFR values are based on the latest statistics reported in the Cholera Situation in Yemen Report [54]. IDPs statistics are obtained from the report issued by the Displacement Tracking Matrix (DTM), an international organization that tracks and monitors displacement and population mobility [55]. WASH accessibility is obtained from the report issued by the Berghof Foundation. The report provides information about access to basic services in Yemeni governorates [56]. CT accessibility is extracted from the report released by the UN Office for the Coordination of Humanitarian Affairs (OCHA) [57]. The information about that indicator is provided as a heat map. Experts who helped construct and validate the fuzzy rules provided guidance in converting the heat map information into quantitative values.
Second, to be used in the FIS model, values of all risk indicators are standardized to the interval of 0 and 5 using Eq. (14). Table 6 presents the values of cholera risk indicators in the standardized form.
Then, the standardized values of cholera risk indicators are fed into the FIS model. After executing fuzzy inference operations, overall risk scores are inferred (see Table 7). Figure 8 presents an example of the rule viewer of the FIS model for the overall risk evaluation of one governorate. As seen in the figure, the crisp values of antecedents, AR, CFR, IDPs, accessibility for WASH, and accessibility for CT are 0.958, 1.328, 0.451, 2.181, and 2.660, respectively, which are indicated by red lines. After defuzzification, the overall risk score inferred is 2.12. Overall risk scores are verified by the epidemiological experts. Those experts confirm that the FIS model provides useful cholera risk mapping, which reflects the risk situation of governorates. Those risk scores can effectively guide vaccination and other interventions.

Rule viewer of the FIS model
5.2 Cholera Vaccine Allocation
The MILP model is solved to optimize the allocation of limited vaccine doses among governorates. As discussed previously, during humanitarian emergencies as in our case study, health organizations recommend adopting the single-dose strategy to provide better coverage and partial protection for a larger percentage of the affected area’s population. The protective efficacy of a single dose of OCV was investigated by [58]. The authors reported that the protective efficacy of one OCV dose is 52% for individuals younger than 15 years, and 59% for individuals aged 15 years or older, which is sustained for up to 2 years after dosing. For this case study, because populations are not differentiated by age, it is assumed that the vaccine has the same efficacy for all ages, and both efficacy values are tested for the analysis. We assumed that each vaccinated person receives a single dose at the beginning of the respective period, and vaccine efficacy is valid from the beginning of the dosing period for 2-year follow-up. Vaccinated persons are not vaccinated again within the time horizon. The 2-year time horizon is divided into four 6-month periods. We assume there are 5 million doses available to be allocated to governorates at the beginning of each 6-month period. The model answers the questions of where, what amounts, and when to send vaccine doses over the 2-year time horizon.
One of the main parameters used in the model is population size. The initial population size is obtained from the PopulationData website that provides the most accurate and reliable data on countries and populations. The initial population statistics are based on the projection of the most recent census conducted in 2004 [59]. It is assumed there is a birth rate of 29/1000 and a death rate of 6/1000 to project the population for the rest of the time [60]. Table 8 presents the initial population size by governorate. Children younger than 1 year are not considered in the analysis because they are not eligible for vaccination.
The model is solved using the Gurobi solver. The results are presented in Fig. 9 and Table 9. Figure 9a and b shows the number of doses that should be allocated to each governorate per period for the four 6-month periods when each vaccinated person receives one dose, given a vaccine supply of 5 million doses per period with a vaccine efficacy of 52% or 59%. Table 9 summarizes the cumulative percentages of governorate populations vaccinated over time for both vaccine efficacy values. Generally speaking, for both vaccine efficacy values, vaccine doses are primarily allocated over governorates by order of the risk level while considering the population size. However, at 59% efficacy, it is noted that the number of doses, and percentages of population vaccinated in periods that follow the first period of dosing (i.e., the period at which a governorate starts receiving vaccine) are lower than those when vaccine efficacy is 52% (see Fig. 9 and Table 9). That is, higher vaccine efficacy leads to higher priority for governorates that have not received the vaccine. The governorates can be clustered into five groups: (i) the first group comprises 6 governorates with risk scores greater than 2.3. This group is given the first priority to vaccinate as many persons as possible in period 1. Then, each following period, smaller percentages of populations are vaccinated while considering the increase in population sizes during the time. Governorates in that group achieve almost fully vaccinated populations by periods 3 and 4 when the vaccine efficacy is 52%. At vaccine efficacy of 59%, the percentages of the population vaccinated in periods that follow the first period are less than those when the vaccine efficacy is 52%; (ii) the second group includes 6 governorates with risk scores between 2 and 2.3. These regions start receiving vaccine doses in the second period. Nearly 70% of their populations are vaccinated by period 4; (iii) the third group represents 4 governorates with risk scores between 1.8 and 2, which are vaccinated beginning in period 3; (iv) the fourth group represents the governorates that start vaccinating in the fourth period. The number of doses allocated for these regions when vaccine efficacy is 59% is higher than that when the vaccine efficacy is 52%; (v) the last group represents only one governorate with the lowest risk score. At both efficacy values, no vaccines are allocated to this region.

Number of doses allocated for each governorate per period, given a vaccine supply of 5 million doses per period with a vaccine efficacy of (a) 52%, and (b) 59%
6 Conclusion
This paper presented a two-phase approach for cholera risk assessment and the vaccine allocation problem. In the first phase, the Mamdani FIS was used to infer the overall risk in cholera-affected regions based on five risk indicators recommended by health organizations to guide the cholera vaccination process. FIS addresses the inherent imprecision in the collected data of cholera risk indicators and maps the nonlinear relationship between risk indicators and the overall risk. Fuzzy inference captures human reasoning and experts’ knowledge about the problem in the rules base that was designed according to if–then settings. In the second phase, a MILP model was developed to solve the vaccine allocation problem, while considering the overall cholera risk and population of vaccine-targeted regions, and vaccine efficacies up to 2 years. A case study was presented to illustrate the expected benefits of the proposed approach, where the proposed approach was used to tackle a real-world health problem that health experts encountered in Yemen. First, overall cholera risk scores of country’s governorates were mapped using the FIS model. Then, those risk scores were used in the optimization model to guide the vaccine allocation process. The case study revealed that the proposed approach can be very beneficial for health organizations to easily identify cholera risk levels which can be used as guidance for interventions including vaccination.
The main benefit of the fuzzy cholera risk assessment model is the risk map for cholera-affected regions, which takes into consideration a set of risk indicators to evaluate the overall risk rather than using a single risk indicator. This helps decision-makers to comprehensively identify the risk level of regions, and accordingly assign resources and guide interventions, including vaccination, in an effective manner.
The conclusions derived from the FIS model depend on several subjective factors, including the design of the rules base, the number of membership functions, and their corresponding fuzzy numbers, and the inference operators. To assure conclusions from the FIS model are valid, six epidemiological academic and medical experts helped develop the rules and formulate the model. The experts have in-depth knowledge about cholera disease and the effect of the cholera risk indicators and a clear perception of the health system situation in the country that is considered for the case study.
The limitation of this research is that the cholera risk assessment and vaccine allocation approach is adapted only for humanitarian emergencies (pre-emptive vaccination). In this situation, the population is not differentiated by age, and all age groups are given the same priority for vaccination [2]. The proposed approach can be modified to accommodate other vaccination settings (reactive and preventive vaccinations). This may require other risk indicators to be considered and modification of the optimization model. Depending on the number of risk indicators and their corresponding linguistic terms, the number of rules can grow exponentially, which in turn will increase the complexity of designing the rules base.
As future work, data-driven approaches such as artificial neural networks and neuro-fuzzy models could be established to explore the overall cholera risk. Such models require data for training and testing, and could provide more accurate results. Another future direction is to examine the proposed approach for other infectious diseases such as COVID-19.
References
Lippi, D., Gotuzzo, E., Caini, S.: Cholera. Paleomicrobiol. Hum. 14, 173–180 (2016)
Médecins Sans Frontières: Management of a cholera epidemic, https://medicalguidelines.msf.org/viewport/CHOL/english/management-of-a-cholera-epidemic-23444438.html (2018). Accessed 26 Aug 2021
World Health Organization: WHO|Prevention and control of cholera outbreaks, http://www.who.int/cholera/prevention_control/recommendations/en/ (2020). Accessed 23 Aug 2021
Dureab, F.A., Shibib, K., Al-Yousufi, R., Jahn, A.: Yemen: Cholera outbreak and the ongoing armed conflict. J. Infect. Dev. Ctries. 12, 397–403 (2018)
Spiegel, P., Ratnayake, R., Hellman, N., Ververs, M., Ngwa, M., Wise, P.H., Lantagne, D.: Responding to epidemics in large-scale humanitarian crises: a case study of the cholera response in Yemen, 2016–2018. BMJ Glob. Health 4, e001709 (2019)
Mengel, M.A., Delrieu, I., Heyerdahl, L., Gessner, B.D.: Cholera outbreaks in Africa. In: Nair, G.B., Takeda, Y. (eds.) Cholera Outbreaks, pp. 117–144. Springer, Heidelberg (2014)
Qadri, F., Ali, M., Chowdhury, F., Khan, A.I., Saha, A., Khan, I.A., Begum, Y.A., Bhuiyan, T.R., Chowdhury, M.I., Uddin, M.J., Khan, J.A.M., Chowdhury, A.I., Rahman, A., Siddique, S.A., Asaduzzaman, M., Akter, A., Khan, A., Ae You, Y., Siddik, A.U., Saha, N.C., Kabir, A., Riaz, B.K., Biswas, S.K., Begum, F., Unicomb, L., Luby, S.P., Cravioto, A., Clemens, J.D.: Feasibility and effectiveness of oral cholera vaccine in an urban endemic setting in Bangladesh: a cluster randomised open-label trial. The Lancet. 386, 1362–1371 (2015)
Spiegel, P.B.: Cholera in Yemen: a case study of epidemic preparedness and response, https://fsi.stanford.edu/publication/cholera-yemen-case-study-epidemic-preparedness-and-response (2018)
Smalley, H.K., Keskinocak, P., Swann, J., Hinman, A.: Optimized oral cholera vaccine distribution strategies to minimize disease incidence: a mixed integer programming model and analysis of a Bangladesh scenario. Vaccine 33, 6218–6223 (2015)
Chao, D.L., Halloran, M.E., Longini, I.M.: Vaccination strategies for epidemic cholera in Haiti with implications for the developing world. Proc. Natl. Acad. Sci. 108, 7081–7085 (2011)
Moore, S.M., Lessler, J.: Optimal allocation of the limited oral cholera vaccine supply between endemic and epidemic settings. J. R. Soc. Interface 12, 20150703 (2015)
Troeger, C., Sack, D.A., Chao, D.L.: Evaluation of targeted mass cholera vaccination strategies in Bangladesh: a demonstration of a new cost-effectiveness calculator. Am. J. Trop. Med. Hyg. 91, 1181–1189 (2014)
Qasem, A.G., Shamsan, A., Aqlan, F.: Optimal cholera vaccine allocation policies in developing countries: a case study. In: Proceedings of the 5th NA International Conference on Industrial Engineering and Operations Management, Michigan, USA (2020)
Ghorabaee, M.K., Amiri, M., Zavadskas, E.K., Antucheviciene, J.: Supplier evaluation and selection in fuzzy environments: a review of MADM approaches. Econ. Res.-Ekonomska Istraživanja. 30, 1073–1118 (2017)
Pourjavad, E., Shahin, A.: Hybrid performance evaluation of sustainable service and manufacturing supply chain management: an integrated approach of fuzzy dematel and fuzzy inference system. Intell. Syst. Account. Finance Manag. 25, 134–147 (2018)
Duijzer, L.E., van Jaarsveld, W., Dekker, R.: Literature review: the vaccine supply chain. Eur. J. Oper. Res. 268, 174–192 (2018)
Dalgıç, Ö.O., Özaltın, O.Y., Ciccotelli, W.A., Erenay, F.S.: Deriving effective vaccine allocation strategies for pandemic influenza: comparison of an agent-based simulation and a compartmental model. PLoS ONE 12, e0172261 (2017)
Enayati, S., Özaltın, O.Y.: Optimal influenza vaccine distribution with equity. Eur. J. Oper. Res. 283, 714–725 (2020)
Teytelman, A., Larson, R.C.: Multiregional dynamic vaccine allocation during an influenza epidemic. Serv. Sci. 5, 197–215 (2013)
Uribe-Sánchez, A., Savachkin, A., Santana, A., Prieto-Santa, D., Das, T.K.: A predictive decision-aid methodology for dynamic mitigation of influenza pandemics. OR Spectrum 33, 751–786 (2011)
Tanner, M.W., Ntaimo, L.: IIS branch-and-cut for joint chance-constrained stochastic programs and application to optimal vaccine allocation. Eur. J. Oper. Res. 207, 290–296 (2010)
Yarmand, H., Ivy, J.S., Denton, B., Lloyd, A.L.: Optimal two-phase vaccine allocation to geographically different regions under uncertainty. Eur. J. Oper. Res. 233, 208–219 (2014)
Günay, E., Park, K., Aydoğan, S., Kremer, G.O.: Vaccine distribution strategies against polio: an analysis of Turkey scenario. In: Proceedings of IISE Annual Conference and Expo (2019)
Hovav, S., Tsadikovich, D.: A network flow model for inventory management and distribution of influenza vaccines through a healthcare supply chain. Oper. Res. Health Care. 5, 49–62 (2015)
Rauner, M.S.: Resource allocation for HIV/AIDS control programs: a model-based policy analysis. OR Spectrum 24, 99–124 (2002)
Thompson, K.M., Duintjer Tebbens, R.J., Pallansch, M.A., Wassilak, S.G.F., Cochi, S.L.: Polio eradicators use integrated analytical models to make better decisions. INFORMS J. Appl. Anal. 45, 5–25 (2015)
Hutton, D.W., Brandeau, M.L., So, S.K.: Doing good with good or: supporting cost-effective hepatitis b interventions. INFORMS J. Appl. Anal. 41, 289–300 (2010)
Denysiuk, R., Silva, C.J., Torres, D.F.M.: Multi-objective approach to optimal control for a tuberculosis model. Optim. Methods Softw. 30, 893–910 (2015)
Matrajt, L., Halloran, M.E., Longini, I.M., Jr.: Optimal vaccine allocation for the early mitigation of pandemic influenza. PLOS Comput. Biol. 9, e1002964 (2013)
Patel, R., Longini, I.M., Elizabeth Halloran, M.: Finding optimal vaccination strategies for pandemic influenza using genetic algorithms. J. Theor. Biol. 234, 201–212 (2005)
Du, M., Sai, A., Kong, N.: A data-driven optimization approach for multi-period resource allocation in cholera outbreak control. Eur. J. Oper. Res. 291, 1106–1116 (2021)
Yang, C., Wang, J.: A cholera transmission model incorporating the impact of medical resources. Math. Biosci. Eng. 16, 5226–5246 (2019)
Zadeh, L.A.: Fuzzy sets. Inf. Control 8, 338–353 (1965)
Sivanandam, S.N., Sumathi, S., Deepa, S.N. (eds.): Fuzzy rule-based system. In: Introduction to Fuzzy Logic Using MATLAB, pp. 113–149. Springer, Heidelberg (2007)
Dalalah, D., Bataineh, O.: A fuzzy logic approach to the selection of the best silicon crystal slicing technology. Expert Syst. Appl. 36, 3712–3719 (2009)
Altrock, C.V.: Fuzzy Logic and Neurofuzzy Applications in Business and Finance. Prentice-Hall, Upper Saddle River (1996)
Pedrycz, W., Gomide, F.: Fuzzy Systems Engineering: Toward Human-Centric Computing. Wiley, New York (2007)
Al-Hawari, T., Khrais, S., Al-Araidah, O., Al-Dwairi, A.F.: 2D laser scanner selection using fuzzy logic. Expert Syst. Appl. 38, 5614–5619 (2011)
Pourjavad, E., Mayorga, R.V.: A comparative study and measuring performance of manufacturing systems with Mamdani fuzzy inference system. J. Intell. Manuf. 30, 1085–1097 (2019)
Lima-Junior, F.R., Carpinetti, L.C.R.: An adaptive network-based fuzzy inference system to supply chain performance evaluation based on SCOR® metrics. Comput. Ind. Eng. 139, 106191 (2020)
Pourjavad, E., Shahin, A.: The application of mamdani fuzzy inference system in evaluating green supply chain management performance. Int. J. Fuzzy Syst. 20, 901–912 (2018)
Omair, M., Noor, S., Tayyab, M., Maqsood, S., Ahmed, W., Sarkar, B., Habib, M.S.: The selection of the sustainable suppliers by the development of a decision support framework based on analytical hierarchical process and fuzzy inference system. Int. J. Fuzzy Syst. (2021). https://doi.org/10.1007/s40815-021-01073-2
Imran, M., Agha, M.H., Ahmed, W., Sarkar, B., Ramzan, M.B.: Simultaneous customers and supplier’s prioritization: an ahp-based fuzzy inference decision support system (AHP-FIDSS). Int. J. Fuzzy Syst. 22, 2625–2651 (2020)
Okwu, M.O., Tartibu, L.K.: Sustainable supplier selection in the retail industry: a TOPSIS- and ANFIS-based evaluating methodology. Int. J. Eng. Bus. Manag. 12, 1847979019899542 (2020)
Huang, Y.-P., Kuo, W.-L., Basanta, H., Lee, S.-H.: Evaluating power rehabilitation actions using a fuzzy inference method. Int. J. Fuzzy Syst. (2021). https://doi.org/10.1007/s40815-021-01097-8
Aqlan, F., Lam, S.S.: A fuzzy-based integrated framework for supply chain risk assessment. Int. J. Prod. Econ. 161, 54–63 (2015)
Aqlan, F.: A software application for rapid risk assessment in integrated supply chains. Expert Syst. Appl. 43, 109–116 (2016)
Nakandala, D., Lau, H., Zhao, L.: Development of a hybrid fresh food supply chain risk assessment model. Int. J. Prod. Res. 55, 4180–4195 (2017)
Lima, F.R., Osiro, L., Carpinetti, L.C.R.: A fuzzy inference and categorization approach for supplier selection using compensatory and non-compensatory decision rules. Appl. Soft Comput. 13, 4133–4147 (2013)
Osiro, L., Lima-Junior, F.R., Carpinetti, L.C.R.: A fuzzy logic approach to supplier evaluation for development. Int. J. Prod. Econ. 153, 95–112 (2014)
Zanon, L.G., Munhoz Arantes, R.F., Calache, L.D.D.R., Carpinetti, L.C.R.: A decision making model based on fuzzy inference to predict the impact of SCOR® indicators on customer perceived value. Int. J. Prod. Econ. 223, 107520 (2020)
Chen, C.-M.: A fuzzy-based decision-support model for rebuy procurement. Int. J. Prod. Econ. 122, 714–724 (2009)
Zeng, J., An, M., Smith, N.J.: Application of a fuzzy based decision making methodology to construction project risk assessment. Int. J. Proj. Manag. 25, 589–600 (2007)
World Health Organization|Eastern Mediterranean Regional office.: Cholera situation in Yemen. https://applications.emro.who.int/docs/EMCSR252E.pdf?ua=1 (2020)
Displacement Tracking Matrix.: Yemen area assessment round 37. https://reliefweb.int/sites/reliefweb.int/files/resources/Yemen%20Area%20Assessment%20Round%2037_0.pdf (2019)
Berghof Foundation.: Mapping of local governance in Yemeni governorates. https://berghof-foundation.org/library/mapping-of-local-governance-in-yemeni-governorates (2019)
United Nation Office for the Coordination of Humanitarian Affairs.: Humanitarian needs overview, Yemen. https://reliefweb.int/sites/reliefweb.int/files/resources/2019_Yemen_HNO_FINAL.pdf (2019)
Qadri, F., Ali, M., Lynch, J., Chowdhury, F., Khan, A.I., Wierzba, T.F., Excler, J.-L., Saha, A., Islam, M.T., Begum, Y.A., Bhuiyan, T.R., Khanam, F., Chowdhury, M.I., Khan, I.A., Kabir, A., Riaz, B.K., Akter, A., Khan, A., Asaduzzaman, M., Kim, D.R., Siddik, A.U., Saha, N.C., Cravioto, A., Singh, A.P., Clemens, J.D.: Efficacy of a single-dose regimen of inactivated whole-cell oral cholera vaccine: results from 2 years of follow-up of a randomised trial. Lancet. Infect. Dis 18, 666–674 (2018)
PopulationData.: Yemen. https://www.populationdata.net/pays/yemen/ (2020)
World Bank.: Yemen birth and death rates 1950–2021. https://www.macrotrends.net/countries/YEM/yemen/birth-rate (2020)
Author information
Authors and Affiliations
Corresponding author
Ethics declarations
Conflict of interest
The authors declare that they have no known financial or non-financial interests that are directly or indirectly related to work submitted for publication.
Rights and permissions
Springer Nature or its licensor holds exclusive rights to this article under a publishing agreement with the author(s) or other rightsholder(s); author self-archiving of the accepted manuscript version of this article is solely governed by the terms of such publishing agreement and applicable law.
About this article

Cite this article
Gailan Qasem, A., Lam, S.S. & Aqlan, F. A Fuzzy-Based Approach for Cholera Risk Assessment and Vaccine Allocation. Int. J. Fuzzy Syst. 24, 3366–3383 (2022). https://doi.org/10.1007/s40815-022-01388-8
Received:
Revised:
Accepted:
Published:
Issue Date:
DOI: https://doi.org/10.1007/s40815-022-01388-8