
Abstract
Traditional dense large-diameter borehole stress load-off techniques reduce the stress levels in the shallow surrounding rock, weaken the bearing capacity of the shallow surrounding rock, and greatly deteriorate the shallow surrounding rock strength and supporting structure, which is not conducive to maintaining the long-term stability of the roadway. Therefore, to address the control problem for the pronounced extrusion deformation in the two sides of a roadway and the overall outward movement of the shallow surrounding rock supported by the sides bolts and anchor cables, as well as to comprehensively consider the on-site construction conditions of the two sides of a test roadway, stress load-off technology for asymmetric hole construction on the two sides of a roadway is proposed. The asymmetric stress load-off technique is a new method; while the shallow surrounding rock of the roadway sides is strongly anchored via a full anchor cable support form, a group of large stress load-off holes near the deep stress peak line of the roadway sides is excavated to relieve pressure and protect the roadway. This technology can transfer the peak stress area of the roadway side deeper into f the surrounding rock without deteriorating the shallow surrounding rock strength and damaging the supporting structure. A numerical simulation analysis of asymmetric stress load-off on the two sides of the roadway was performed, the stress load-off effect evaluation index was established, and the optimal field construction parameters were obtained. The stress load-off parameters obtained from the study are applicable to field engineering practice. Mine pressure data reveal that the test roadway remains intact and stable during the use period when the asymmetric stress load-off technique is adopted.
1 Introduction
As the main energy source in China, coal will continue to be important for the development of China’s national economy (Liu and Harpalani 2014; Liu et al. 2020; Sun et al. 2020; Chang et al. 2021). Studying various technical challenges in the mining industry is necessary for maintaining the healthy development of China’s economy (Fan and Liu 2019; Liu et al. 2022a; Yang et al. 2021a; Yu et al. 2021a). With the increasing energy demand and mining intensity, shallow recoverable coal resources are daily decreasing, and mining resources are gradually becoming available at greater depths (Yu et al. 2019; Batugin et al. 2021; Xie et al. 2015; Chen et al. 2021a). The engineering geological environment of deep “three high and one disturbance” and sedimentary rocks results in the ordinary coal rock mass in the shallow part exhibiting creep characteristics at great depths, which makes achieving stability control in the surrounding rock in deep roadways difficult (Chen et al. 2022; Yu and Li 2020; Li et al. 2020, 2022). As an effective means for controlling the stability of deep roadways, stress transfer technology can improve the stress environment of surrounding rock or change its stress distribution. Thus, the peak bearing pressure can be transferred to the deep part of the surrounding rock, reducing the fracture range of the surrounding rock and maintaining the long-term stability of the roadway (Xie et al. 2022a, b; Wang et al. 2017; Yu et al. 2021b). In practice, stress transfer can achieve a better mine pressure control effect than strengthening anchorage and surrounding rock grouting modification in some deep high-stress roadways that are very difficult to maintain. Accordingly, domestic and foreign researchers have investigated numerous stress load-off technologies, such as dense boreholes (Zhang et al. 2019, 2021; Li et al. 2021; Cui et al. 2022; Yin et al. 2023), dense slotting (Zuo et al. 2019; Ma et al. 2022), loose blasting (Luo et al. 2021; Wang et al. 2022a; Chen et al. 2021b), excavation stress load-off roadways (Yang et al. 2021b; Wang et al. 2022b), mining liberated seams (Xie et al. 2019; Shang et al. 2022), and roof cutting and pressure releasing (Liu et al. 2022b; Zhu et al. 2023; Yue et al. 2022; Zhang et al. 2022), to avoid high-stress areas in time and space (Sun et al. 2021).
Among the aforementioned stress load-off technologies, the use of dense boreholes or dense slotting stress load-off has the advantages of a simple process, convenient construction, and small engineering quantity, which has been studied by many scholars in roadway stress transfer engineering. However, in previous dense boreholes or dense slotting stress load-off techniques, the shallow surrounding rock of the roadway is already in the low-stress area due to plasticization and crushing, and the bearing capacity in this area is low; while the shallow surrounding rock relieves pressure and transfers stress via the dense large-diameter boreholes, the stress in the shallow surrounding rock will further decrease, weakening the bearing capacity of the shallow surrounding rock and significantly deteriorating the strength and support structure of the shallow surrounding rock of the roadway, which is not conducive to maintaining the long-term stability of the roadway, as shown in Fig. 1a.

Comparison between conventional borehole stress load-off and new hole-constructing stress load-off technology
Therefore, it is crucial to study stress load-off control technology to prevent damage to the shallow anchorage area of the surrounding rock and shift the stress peak area deeper during the stress load-off process to maintain the long-term stability of the deep stress load-off roadway. Therefore, this paper proposes a new stress load-off method (Fig. 1b) that allows the shallow surrounding rock of the roadway sides to be strongly anchored by a full anchor cable support form and large stress load-off holes group near the deep stress peak line of the roadway sides to be excavated to release pressure and protect the roadway. To prevent negative effects on the stability of the shallow part of the surrounding rock the peak value of the high bearing stress of two sides of the roadway can be transferred to the solid coal side of the stress load-off holes via this method, maintaining the long-term stability of the roadway. This new method and the traditional dense borehole stress load-off method are compared in Fig. 1.
2 Engineering background
2.1 Test roadway overview
The test mine is located in Xingtai City, Hebei Province. The test roadway comprises a tailgate of 12 mining areas in the test coal mine, located at the second level of the mine, with a buried depth of about 690 m. The tailgate is a large rectangular coal roadway with a 5 m × 4 m width and height, respectively. Mining is underway in the 2-A10 working face, and the stopping line of the 2-A10 working face is approximately 75 m away from the tailgate. The horizontal distance between the tailgate centerline and the headgate centerline is approximately 30 m. Figure 2 shows the roadway layout.

Diagram of the roadway layout
The coal mass is located in the area where the test roadway is soft and fractured, marked by a high degree of crack development. The average thickness of the coal seam is 4.24 m. The immediate roof is siltstone (4.4 m), the main roof is fine sandstone (6.48 m), and the immediate floor is fine sandstone (0.51 m). The coal mass in the test roadway area is weak and fractured. The coal roadway is excavated along the roof of the coal seam, and the two sides of the roadway undergo continuous large deformation all year round, requiring frequent expansion and renovation. The soft crushing characteristics of the coal mass and the renovation of the roadway are shown in Fig. 3.

Soft crushing characteristics of the coal mass and the renovation of the roadway a Soft crushing characteristics of the coal mass; b Renovation condition of the roadway
2.2 Initial support method of the test roadway and the failure characteristics
Considering the soft crushing characteristics of the coal body and the frequent renovation of the roadway, the original support adopts the following strong anchoring support form.
Roof construction anchor cable beam truss: roof bolts, ϕ 22 mm × 2400 mm with a spacing of 0.8 m × 0.8 m were installed. Roof anchor cables with a spacing of 1 m × 1.6 m and a pretightening force of 130 kN, ϕ 21.8 mm × 10,500 mm, were installed. One anchor cable must be paired with three square trays with the following dimensions: large tray (400 mm × 400 mm), tray (200 mm × 200 mm), and small tray (100 mm × 100 mm). Adjacent anchor cables in the same row were connected by steel ladder beams, forming an anchor cable beam truss structure.
Roadway sides are strongly anchored by a full anchor cable support form. Five anchor cables, with a spacing of 0.8 m × 1.0 m and pretightening force of 130 kN, ϕ 21.8 mm × 10,500 mm, were used for each side of the roadway. The upper row of anchor cables was tilted upward 15°, and the lower row of anchor cables was tilted downward 5°. One anchor cable must be paired with three square trays, with the following dimensions: large tray (400 mm × 400 mm), tray (200 mm × 200 mm), and small tray (100 mm × 100 mm). Adjacent anchor cables are connected by steel ladder beams, forming an anchor cable beam truss nets structure. The roof and sides of the roadway were reinforced by alternating injections of cement slurry using deep and shallow holes. The grouting pressure was not less than 3 MPa. The initial support scheme is shown in Fig. 4.

Initial support scheme of coal roadway a Initial support cross-section drawing; b Initial support planar graph
However, even with the use of high-strength comprehensive control technologies such as the full anchor cable support and grouting reinforcement, damage to the support system and the continuous large deformation in the surrounding rock on roadway sides cannot be avoided. The displacement observation results for the two sides of the surrounding rock of the test roadway, the stress situation of the anchor cable, and the on-site deformation situation are shown in Fig. 5.

Deformation curve of coal roadway and stress of anchor cable a Displacement observation results of the two sides; b Stress situation of the anchor cable; c On-site deformation situation of roadway
2.3 Background of unsymmetrical hole construction for stress load-off
-
(1)
The original high-strength comprehensive control technology (including full anchor cable active reinforcement of the roadway and surrounding rock grouting modification technology) cannot effectively control the continuous large deformation of the coal roadway surrounding rock. Moreover, applying conventional roadway stress load-off technology usually results in damage to the shallow rock mass and support structure when releasing stress, and it cannot meet the combined requirements of stress load-off and roadway protection. Therefore, new load-off methods are required to ensure that the shallow rock mass and support structure are not affected and to transfer the high stress near the roadway to points far from the roadway. Accordingly, we propose a new stress load-off method that allows the shallow surrounding rock of the roadway sides to be strongly anchored using the full anchor cable support form and the group of large stress load-off holes near the deep stress peak line of the roadway sides to be excavated, thus releasing pressure and protecting the roadway. The on-site conditions of the test roadway are shown in Fig. 6.
Fig. 6 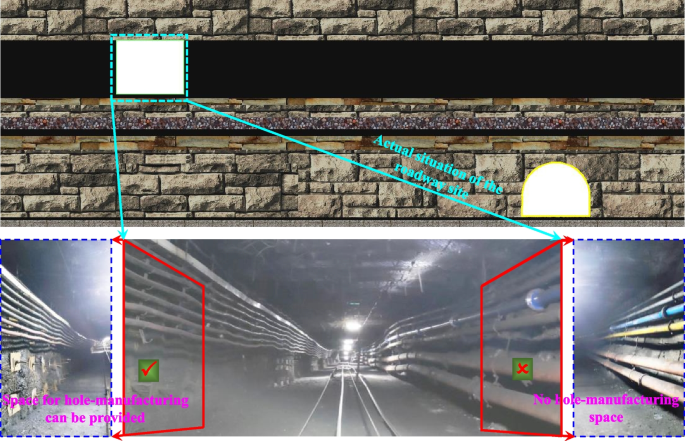
Site conditions of two sides of tailgate
-
(2)
Limitations in geological production conditions. The absence of a cable in the middle and lower part of the left side of the test roadway means that space for hole construction is available. However, densely arranged pipes are present on the right side of the test roadway, which makes direct hole construction from the right side of the test roadway impractical. Therefore, considering the difficulty of hole construction on the right side of the test roadway, we propose a new construction process of hole construction for stress load-off, which involves using fully the floor roadway. This is achieved by drilling upward through the rock layers, excavating large stress load-off holes group near the deep stress peak line on the right side of the roadway to relieve pressure and protect the roadway.

3 Numerical simulation analysis on unsymmetrical hole-constructing
3.1 Numerical calculation model establishment and simulation plan
To determine the stress load-off parameters of the two sides of the coal roadway, a FLACD3D numerical model for asymmetric hole construction for stress load-off on the two sides of the deep coal roadway was constructed based on the engineering geological conditions of the test roadway (as shown in Fig. 7). The axis perpendicular to the roadway is the x-axis (taken as 85 m), the axis of the coal roadway is the y-axis (taken as 80 m), and the arrangement direction of the coal and rock layers is the z-axis (taken as 80 m). Applying uniformly distributed loads to the top boundary of the model to simulate the weight of the overlying rock layer, the fixed velocity of the model remaining boundaries was 0, and the lateral pressure coefficient was 1.2. The deformation and failure of coal rock layers conform to the Mohr–Coulomb strength criterion. The mechanical parameters input for each rock layer are listed in Table 1.

Numerical calculation model
3.2 Mechanism and evaluation indicators for hole construction for stress load-off
The proposed stress load-off method allows the shallow surrounding rock of the roadway sides to be strongly anchored by a full anchor cable support form when a group of large stress load-off holes near the deep stress peak line of the roadway sides is excavated to release pressure and protect the roadway. To prevent effects on the stability of the shallow part of the surrounding rock, this method can transfer the peak value of the high bearing stress of two sides of the roadway to the solid coal side of the stress load-off holes, thus maintaining the long-term stability of the roadway. After the asymmetric hole construction, the stress on two sides of the test roadway underwent secondary adjustment, as shown in Fig. 8.

Typical stress secondary adjustment curve a Plane diagram of stress secondary adjustment; b Stereogram diagram of stress secondary adjustment
The direct evaluation indicators for the stress load-off effect are as follows:
① |h–i|: the distance from the end of the stress load-off hole to the original stress peak line; ② σf/σi: the ratio of No. 1 stress peak to the original stress peak; ③ σs/σi: the ratio of No. 2 stress peak to the original stress peak; ④ s–i: the transfer distance of the new stress peak line; ⑤ |i–f|: the distance between the original stress peak line and the No. 1 stress peak line; ⑥ ∇(s–i): the transfer amplitude of the new stress peak line.
3.3 Parameters determination of stress load-off on two sides
For the asymmetric stress load-off of the two sides of the coal roadway, because hole construction on the right side of the coal roadway is performed in the coal pillar between the two main roadways, the difficulty of determining the parameters of the stress load-off hole on the right side is much greater than that of the left side of the coal roadway. To limit its length, this paper only studies the method of determining the parameters of the right side of the coal roadway in detail. The parameters of the left side of the roadway are determined according to the parameter determination of the right side.
3.3.1 Parameters determination of stress load-off at right side
-
(1)
Position determination of stress load-off hole at right side.
When the roadway was excavated but the stress load-off hole was not excavated, the peak stress of the right side of the roadway was approximately 30 MPa, and the peak stress line was approximately 10 m away from the right side surface. With the change in the stress load-off hole location of the right side, the stress curve of the roadway side was constantly adjusted, as shown in Fig. 9.
Fig. 9 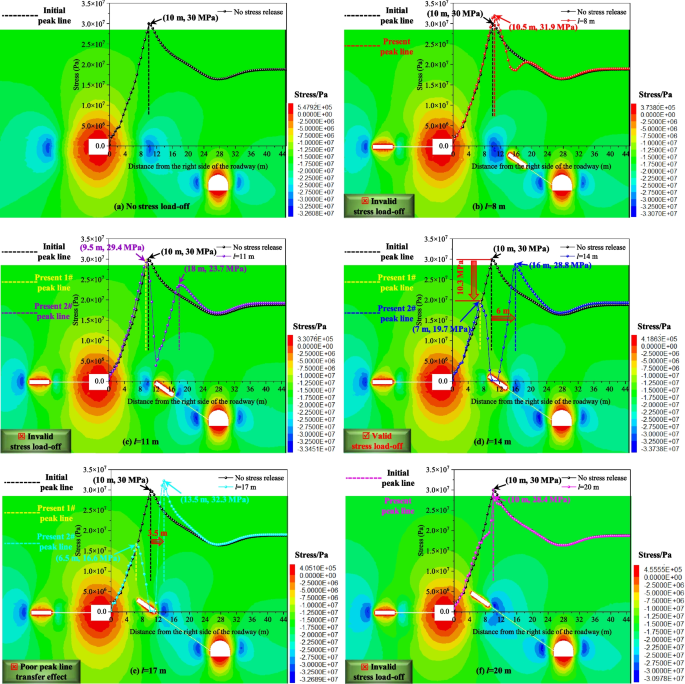
Distribution characteristics of stress curve and nephogram on the right side of roadway changing with the location of hole
When l = 8 m, h = 14.5 m, and |h–i| = 4.5 m, the stress curve of the right side of the roadway presented a single peak distribution, the stress peak was approximately 31.9 MPa, and the stress peak line was 0.5 m from the original stress peak line. Therefore, when the stress load-off hole was made at this position, the peak value and position of the stress peak area at the right side of the roadway were almost the same as those before the stress load-off hole was made, resulting in ineffective stress load-off.
When l = 11 m, h = 12 m, and |h–i| = 2 m, the stress curve of the right side of the roadway exhibited a bimodal distribution. However, for the hole construction, σf/σI = 0.98, |i–f|= 0.5 m; that is, the No. 1 stress peak on the right side of the roadway was approximately 29.4 MPa, and the stress peak line was 0.5 m away from the original stress peak line. Noticeably, the peak value and position of the stress peak area on the right side of the roadway were almost the same as those before the hole construction, resulting in ineffective stress load-off.
When l = 14 m, h = 9.5 m, and |h–i| = 0.5 m, the stress curve of the right side of the roadway exhibited a bimodal distribution. In this hole construction, σf/σi = 0.66, indicating that No. 1 stress peak was 10.3 MPa lower than the original stress peak, and the stress peak reduction rate was 34%; σs/σi = 0.96, indicating that the peak stress of No. 2 was lower than the original peak stress; s–i = 6 m, indicating that the new stress peak line shifted 6 m to the deeper part of roadway side. In addition, the stress level of shallow surrounding rock within 7 m of the roadway side was not weakened, which can ensure the strong anchoring performance of the roadway side anchor cable. Noticeably, the peak stress area of the roadway side can be transferred to the deep part of the surrounding rock without weakening the bearing capacity of the shallow surrounding rock.
When l = 17 m, h = 7 m, and |h–i| = 3 m, the stress curve of the right side of the roadway exhibited a bimodal distribution. Although the No. 1 peak stress was lower than the original peak stress, σs/σi = 1.1, indicating that the No. 2 peak stress was higher than the original peak stress. s–i = 3.5 m, indicating that the new stress peak line only shifted 3.5 m to the deeper part of the roadway side. Therefore, when constructing a hole at this position, the transfer effect of the stress peak area on the right side of the roadway is poor.
When l = 20 m, h = 4.5 m, and |h–i| = 5.5 m, the stress curve of the right side of the roadway exhibited a single peak distribution, the stress peak was approximately 28.4 MPa, and the stress peak line coincided with the original stress peak line. Therefore, when a hole is made at this position, the peak value and position of the stress peak area on the right side of the roadway are almost the same as those before the hole was made, resulting in an ineffective stress load-off.
The stress distribution curve of the right side of the roadway under different hole-constructing conditions is shown in Fig. 10a; the stress load-off index under different hole construction conditions is shown in Fig. 10b.
Fig. 10 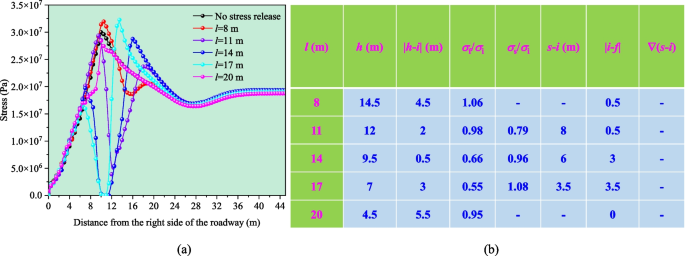
Summary curve and stress release index of stress on the right side of roadway for different hole locations. a Summary curve of stress on the right side of roadway for different hole locations; b Stress release index for changing stress at the right side of roadway for different hole locations
-
(2)
Length determination of stress load-off hole at right side.
With the increase in the length of the stress load-off hole on the right side, the stress curve of the roadway side was constantly adjusted, and the stress curve of the right side of the roadway presented a bimodal distribution. The No. 1 stress peak gradually decreased, and its peak line gradually approached the right side surface of the roadway. The No. 2 stress peak increased gradually, and its peak line position remains unchanged, that is, s–i = 6 m. The specific stress changes are shown in Fig. 11:
Fig. 11 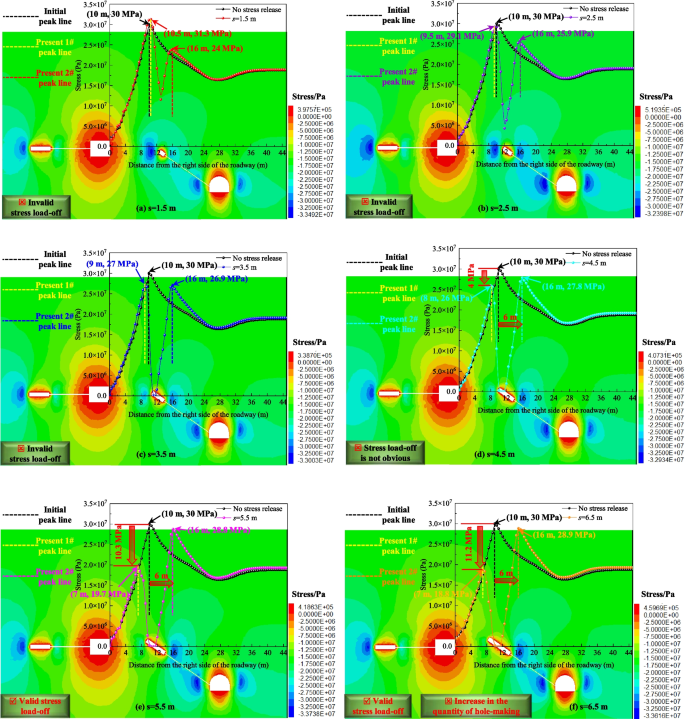
Distribution characteristics of stress curve and nephogram on the right side of roadway changing with the hole length
When s = 1.5 m, σf/σI = 1.04, |i–f| = 0.5 m, the No. 1 peak stress at the right side of the roadway was approximately 31.3 MPa, which is 1.3 MPa higher than the original stress peak value, and the stress peak line was 0.5 m from the original stress peak line. Noticeably, when a hole is created at this position, the peak value and position of the stress peak area on the right side of the roadway are similar to those before the hole was made, resulting in ineffective stress load-off. When s = 2.5 m, σf/σI = 0.97, and |i–f| = 0.5 m, the No. 1 peak stress at the right side of the roadway was approximately 29.1 MPa, which is only 0.9 MPa lower than the original stress peak value, and the stress peak line is only 0.5 m from the original stress peak line. Noticeably, when a hole is made at this position, the peak value and position of the stress peak area on the right side of the roadway are almost similar to those before the hole is made, resulting in an ineffective stress load-off. When s = 3.5 m, σf/σI = 0.9, and |i–f| = 1 m, the No. 1 peak stress on the right side of the roadway was approximately 27 MPa, which is only 3 MPa lower than the original stress peak value, and the stress peak line was only 1 m from the original stress peak line. When a hole is made at this position, the peak value and position of the stress peak area on the right side of the roadway are similar to those before the hole was made, resulting in ineffective stress load-off.
When s = 4.5 m, σf/σI = 0.86, and |i–f| = 2 m, the No. 1 stress peak at the right side of the roadway was approximately 26 MPa, which is only 4 MPa lower than the original peak value, and the stress peak reduction rate was only 13%. The stress peak line was only 2 m from the original stress peak line. When the hole was made at this position, the stress load-off capacity was insufficient.
When s = 5.5 m, σf/σI = 0.66, |i–f| = 3 m, the No. 1 peak stress on the right side of the roadway was approximately 19.7 MPa, which is 10.3 MPa lower than the original stress peak value, and the peak stress reduction rate was 34%. The No. 1 stress peak line was 3 m away from the original stress peak line. Further, σs/σI = 0.96, s–i = 6 m, indicating that the No. 2 peak stress was lower than the original peak stress, and the new peak stress line shifted deeper toward the roadway side by 6 m.
When s = 6.5 m, σf/σI = 0.63, and |i–f| = 3 m, the No. 1 peak stress at the right side of the roadway was approximately 18.8 MPa, which was 11.2 MPa lower than the original stress peak, and the peak stress reduction rate was 37%. The No. 1 stress peak line was 3 m from the original stress peak line. σs/σi = 0.963, s–i = 6 m, indicating that the No. 2 peak stress was lower than the original stress peak, and the new stress peak line was shifted 6 m deeper toward the roadway side.
The stress distribution curve of the right side of the roadway under different stress load-off hole lengths is shown in Fig. 12a. The stress load-off index under different stress load-off hole lengths is shown in Fig. 12b
Fig. 12 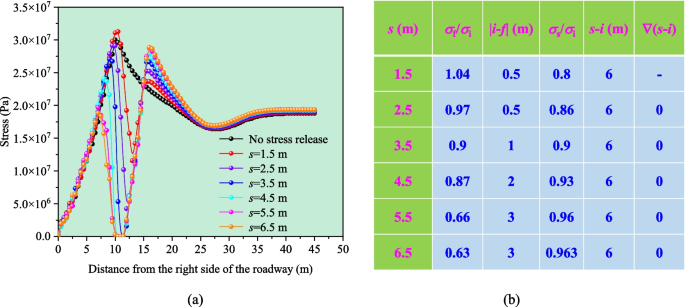
Summary curve and stress release index of stress on the right side of roadway under different hole lengths a Stress distribution summary curve of the right side of the roadway under different stress load-off hole lengths; b Stress load-off index changing under different stress load-off hole lengths
From the foregoing, when the length of the stress load-off hole was between 1.5 and 3.5 m, the peak value and position of the stress peak area on the right side of the roadway were similar to those before the hole was made, resulting in ineffective stress load-off. When the length of the stress load-off hole was 4.5 m, the stress load-off capacity of the roadway was insufficient. When the stress load-off hole length was 5.5 m and 6.5 m, the stress in the original peak area greatly decreased, the stress peak reduction rate remained largely unchanged, and the new stress peak line was transferred to the deep part of the surrounding rock by 6 m. Therefore, considering the construction efficiency, the length of the stress load-off hole can be determined to be 5.5 m.
-
(3)
Spacing determination of stress load-off hole on right side.
The stress distribution clouds chart and curves of the right side of the roadway with different stress load-off hole spacing, as shown in Fig. 13.
Fig. 13 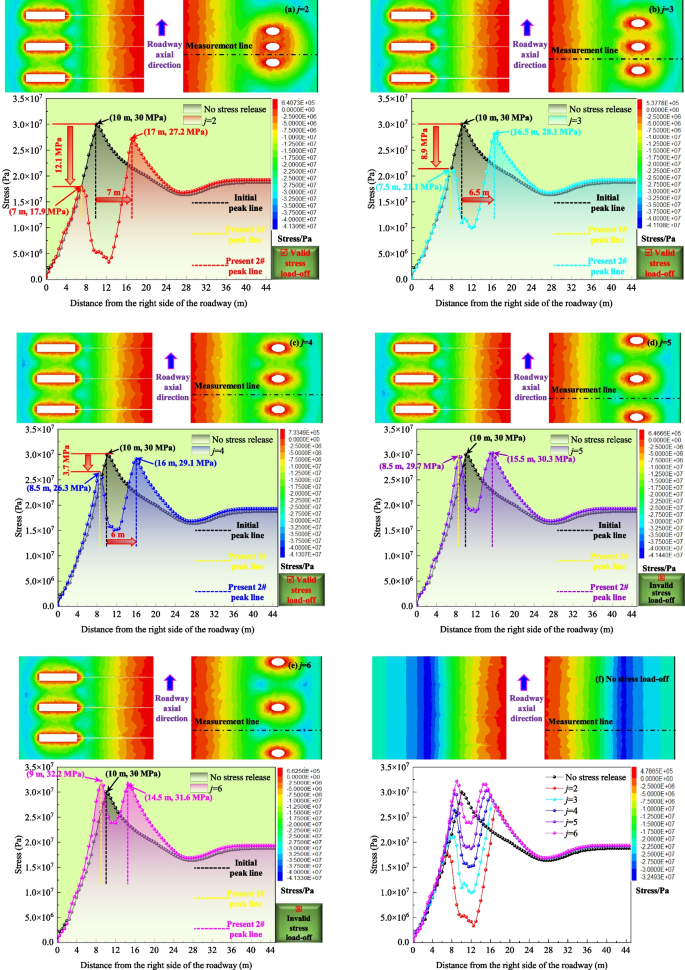
Distribution characteristics of stress curve and nephogram on the right side of roadway changing with the spacing of hole
When j = 5 m and j = 6 m, the roadway side stress distribution curve exhibits a double-peak distribution, and the No. 1 peak stress of the coal seam in the right side of the roadway is approximately equal to the original peak stress, resulting in the stress load-off between adjacent holes being inefficient. When j = 2 m, 3 m, and 4 m, the stress between adjacent holes can be effectively released. Therefore, to ensure the stress release between adjacent holes, considering economic and efficient hole-construction, a spacing of 4 m is selected. In summary, the stress load-off hole parameters of the right side of the roadway were determined as follows: l = 14 m, s = 5.5 m, and j = 4 m.


3.3.2 Parameter determination of stress load-off on left side
The following points can be established from the analysis of stress load-off hole parameters of the roadway right side:
-
(1)
The closer the stress load-off hole terminal is to the original stress peak line, the better the stress load-off effect that can be achieved, and the peak stress area of the roadway side can be transferred to the deep part of the surrounding rock without weakening the bearing capacity of the shallow part of the surrounding rock. Because the peak stress line of the left side of the roadway is 10 m from the roadway wall, the distance between the terminal part of the stress load-off hole and the roadway left side surface was determined as 10 m.
-
(2)
Increasing stress load-off hole length can significantly reduce the stress in the original peak area. The peak stress reduction rate was maintained at 34% when the stress load-off hole length of the right side was 5.5 m and 6.5 m, and the new peak stress line was shifted toward the deep part of the surrounding rock by 6 m. Considering the construction environment, the stress load-off hole length of the left side was determined to be 5 m.
-
(3)
When the stress load-off hole spacing was 2–4 m, the stress between adjacent holes can be effectively released. Therefore, for the left side of the roadway, to ensure stress release between adjacent stress load-off holes and considering economic and efficient hole construction, the spacing was set to 4 m.
Considering the above parameters, the stress distribution clouds chart and curves before and after hole construction for the two sides are shown in Fig. 14.

Stress distribution nephogram and curve of the two sides of the roadway before and after hole construction under the best parameters
Noticeably, under these stress load-off hole parameters, the peak stresses at the two sides of the roadway are shifted deeper toward the surrounding rock without affecting the stress in the shallow anchorage area of the two ribs of the roadway, thus protecting the stress load-off of the roadway space.
4 Engineering application
4.1 Strengthening anchoring parameters of shallow surrounding rock
The unsymmetrical hole construction for stress load-off is based on the parameters of the original support plan, so the anchoring support parameters of the shallow surrounding rock in the test roadway are consistent with those presented in Sect. 2.2.
4.2 Method and parameters of unsymmetrical hole construction
To prevent strength damage to the coal pillars and headgate side, two grouting anchor cables were used to reinforce the coal pillars in the main roadway. A φ 21.8 mm × 4500 mm grouting anchor cable was selected. The grouting anchor cables were spaced at 1000 mm. To excavate large stress load-off holes group near the deep stress peak line of the roadway sides to relieve pressure and protect the roadway, the hole parameters on the two sides of the roadway are as follows:
-
(1)
Hole construction parameters on roadway right side.
The stress load-off hole was located at a height of 1.5 m from the headgate floor, and it formed a 35° angle with the horizontal plane. The diameter of the external small hole was approximately 133 mm, the depth of the small hole was approximately 14 m, the length of the internal stress load-off hole was approximately 5.5 m, and the row spacing of the stress load-off hole was 4 m. After the stress load-off holes are constructed, the hole should be sealed in a timely manner.
-
(2)
Hole construction parameters on roadway left side.
The stress load-off hole for the left side of the coal roadway was located 1.5 m from the floor and arranged perpendicular to the roadway side. Moreover, the diameter of the shallow small holes was approximately 133 mm. The outer end of the internal stress load-off hole was approximately 10 m away from the roadway wall, the length of the large stress load-off hole was 5 m, and the row spacing of the stress load-off hole was 4 m. Considering that the coal discharge from the left side was achieved using a shallow small diameter drilling channel, a geological steel pipe with a diameter of 127 mm was placed into the small diameter drilling hole and grouted, and it solidified on the outer side of the pipe wall. After the stress load-off holes are constructed, the hole should be sealed in a timely manner, as shown in Fig. 15.
Fig.15 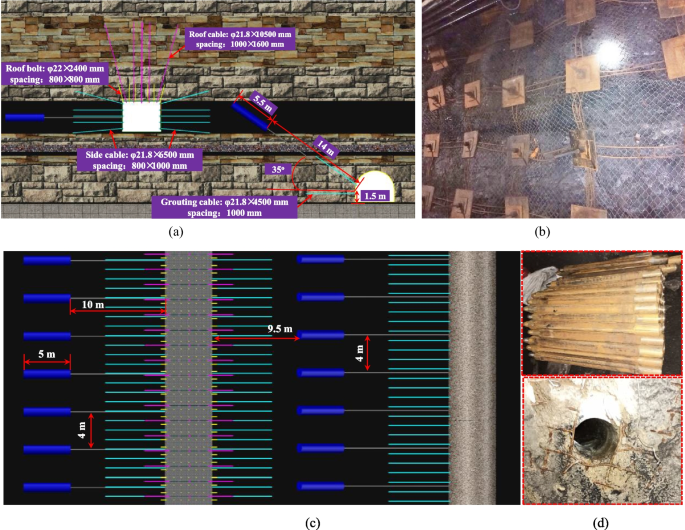
Hole construction parameters of two sides of the roadway a New support section diagram; b Full anchor cable support form; c New support planar graph; d Drill pipe and drilling
A comprehensive control plan for the surrounding rock is shown in Fig. 16.
Fig.16 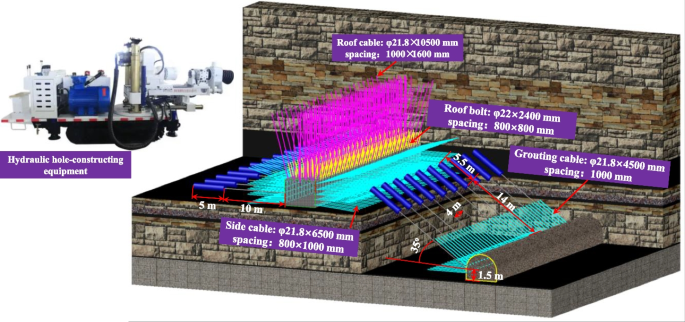
Comprehensive control technical scheme and construction equipment for surrounding rock of main roadway


4.3 Field application effect
-
(1)
Surface displacement and anchor cable stress observation of the two sides of the tailgate.
By tracking and monitoring three measurement stations in the tailgate, the surface displacement change curves of the two sides of the tailgate and the monitoring results of some anchor cable dynamometers were obtained, as shown in Fig. 17. Before the hole for stress load-off was constructed, the overall growth rate of the surface displacement on the two sides of the test roadway was higher. However, after the hole for stress load-off was constructed, the surface displacement rate of the two sides of the test roadway gradually decreased and eventually stabilized. The stable convergence of the two sides of the test roadway was approximately 120 mm. The data reveal that the overall stability of the surrounding rock of the test roadway and the on-site applicability were outstanding.
Fig.17 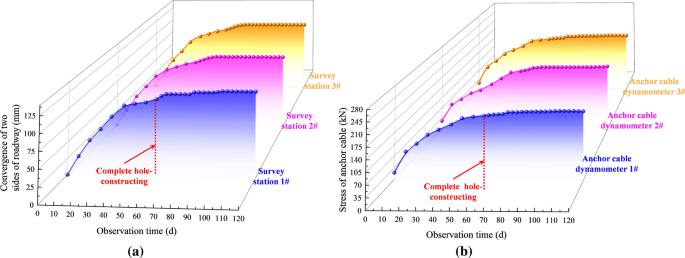
Surface displacement change curve of the two sides of the main roadway and the monitoring results of some anchor cable dynamometers. a Surface displacement change curve of the two sides; b Monitoring results of some anchor cable dynamometer
The stress monitoring data of the anchor cables indicate that the initial growth rate of the anchor cable stress on the two sides of the test roadway was relatively high. However, after the hole construction for stress load-off was completed, the stress environment on two sides of the test roadway was improved, and the increase rate of the anchor cable stress significantly decreased and stabilized, with a stable pressure value of 203 kN. The stress monitoring data of the anchor cable reveal that the stress load-off measures effectively controlled the deformation and failure of the surrounding rock, and good support effects were achieved.
-
(2)
Internal cracks in the surrounding rock of the two sides and the roof of the coal roadway.
In addition, on-site testing of the development degree of internal cracks in the surrounding rock of the two sides and the roof of the coal roadway was conducted using a borescope. The results indicate that the integrity of the surrounding rock of the roadway roof after taking stress load-off measures was good, prominent cracks were absent, and the rock layer had good compactness. Moreover, the integrity of the shallow anchoring section of the roadway sides was good, and pronounced large cracks were absent. However, the coal mass within the depth range of 10–15 m of the roadway sides had a high degree of deformation and damage and had undergone significant displacement, as shown in Fig. 18. Applying the stress load-off measures, the stress relief holes can ensure that the anchoring area in the shallow part of the roadway sides will not be damaged, act as a deformation buffer space for coal migration under high stress in the deep part of the roadway sides, and absorb deformation, thus maintaining the long-term stability of the roadway.
Fig. 18 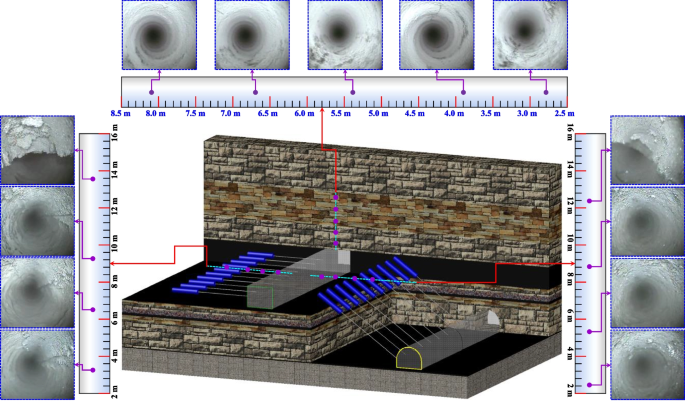
Borehole observation results of surrounding rock of the roadway
-
(3)
Observation of borehole stress gauge readings.
To monitor the stress changes in the roadway side before and after the excavation of the stress load-off holes on site, five borehole stress gauges were installed on the roadway side for continuous observation. The data results are shown in Fig. 19.
Fig. 19 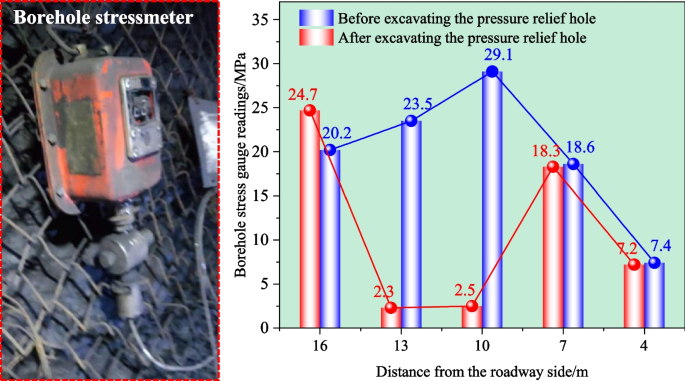
On-site testing of coal body drilling stress before and after the excavation of the stress load-off holes
According to on-site observations, after the excavation of the stress load-off holes, the stress in the anchoring area of the roadway side remained almost unchanged, the stress in the original peak stress area decreased, and the stress on the coal side of the solid body of the stress load-off hole increased. The on-site testing of coal body drilling stress reveals that this technology ensures a significant stress reduction in the original stress peak area and the transfer of the peak area to the deeper part of the surrounding rock without affecting the stability of the shallow anchoring zone, which is consistent with the numerical simulation results.
-
(4)
Observation of space volume of stress load-off hole.
To dynamically monitor the closure of the internal invisible pressure relief space in real-time, a mine pressure monitoring system with expandable water bags was arranged inside the stress unloading hole. The water filling status of the expandable water bags system outside the stress load-off hole is shown in Fig. 20a.
Fig. 20 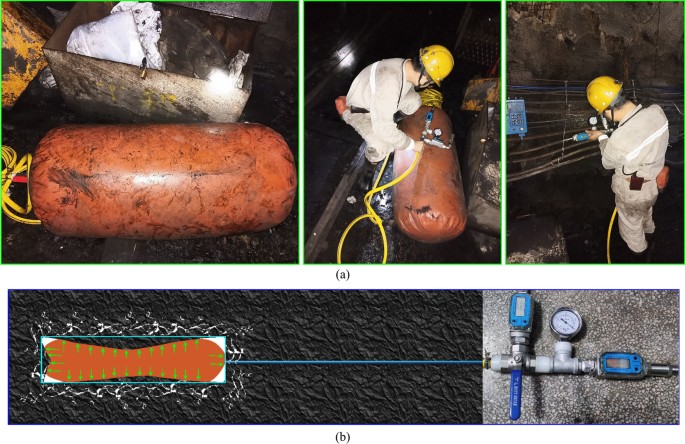
Mine pressure monitoring system with expandable water bags a Water filling status of expandable water bags system outside the stress load-off hole. b Deformation of the expandable water bags system inside hole
As the pressure relief hole gradually deforms (Fig. 20b), the pressure of the expandable water bags system gradually increases, and the flow rate of the flowmeter begins to increase. After 86 d of on-site observation, the volume of water flowing out due to pressure relief caused by surrounding rock deformation only accounted for 25% of the original volume, the pressure value of the internal bag system was relatively stable, and it stabilized in this state in the later stage. Therefore, sufficient pressure relief space for the internal hole was still present, and effective pressure relief and stability control in the surrounding rock of the roadway were achieved.
The above on-site observation results reveal that the test roadway remained intact and stable during its use after excavation. The on-site control effect of surrounding rock in the roadway is shown in Fig. 21. In summary, the existing comprehensive control measures for surrounding rock have been successfully applied on-site, and the surrounding rock control effect is good, effectively ensuring the long-term safety and operation stability of the roadway surrounding rock.
Fig. 21 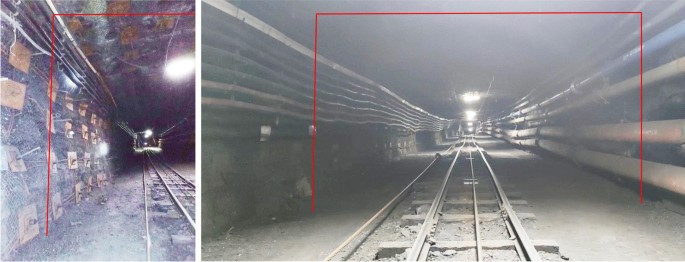
Control effect of surrounding rock of roadway on site


5 Conclusions
This paper proposes unsymmetrical hole construction for stress load-off technology at the two sides of a deep roadway, which is different from traditional stress load-off methods. This technique can avoid further reductions in the stress level of shallow surrounding rock and prevent weakening the bearing capacity of shallow surrounding rock. The following conclusions are drawn:
-
(1)
When the roadway is excavated but the stress load-off hole is not excavated, the peak stress of the right side of the roadway is approximately 30 MPa, and the peak stress line is approximately 10 m away from the right-side surface. The closer the end of the stress load-off hole is to the peak stress line of the roadway side, the more marked is the stress load-off effect. When l = 14 m, h = 9.5 m, and |h–i| = 0.5 m, the stress curve of the right side of the roadway exhibits a bimodal distribution, the stress peak reduction rate is 34%, the No. 2 peak stress is lower than the original peak stress, and the new stress peak line shifts 6 m to the deeper part of roadway side.
-
(2)
With the length increase in the stress load-off hole, the stress curve of the right side of the roadway presents a bimodal distribution, the No. 1 stress peak value gradually decreases, and its peak line gradually approaches the right side surface of the roadway. The No. 2 stress peak value increases gradually, but its peak line position remains unchanged. When the stress load-off hole length is between 1.5 and 3.5 m, the peak value and position of the stress peak area on the right side of the roadway are almost identical to those before the hole was made, resulting in ineffective stress load-off. When the stress load-off hole length is 4.5 m, the stress load-off capacity of the roadway side is insufficient. When the stress load-off hole length is 5.5 m and 6.5 m, a significant decrease in stress in the original peak area occurs, and the new stress peak line shifts 6 m toward the deep part of the surrounding rock.
-
(3)
When j = 5 m and j = 6 m, the roadway side stress distribution curve exhibits a double-peak distribution, and the No. 1 peak stress in the right side of the roadway is approximately equal to the original peak stress, resulting in a stress load-off inefficiency between adjacent holes. When j = 2 m, 3 m, and 4 m, the stress between adjacent holes can be effectively released. Therefore, to ensure stress release between adjacent holes, considering economic and efficient hole construction, a spacing of 4 m is selected.
-
(4)
The stress load-off parameters obtained from the study are applied to field engineering practice. Mine pressure data reveal that after the hole for stress load-off is create, the surface displacement rate and anchor cable stress of the two sides of the test roadway gradually decrease and eventually stabilize. After stabilization, the convergence in the two sides of the test roadway is approximately 120 mm, and the anchor cable pressure is 203 kN. The borehole observation results indicate that the integrity of the shallow anchoring section of the roadway sides is good, and no pronounced large cracks occur, effectively ensuring the long-term safety and operation stability of the roadway surrounding rock.
Data availability
The datasets generated or analysed during the current study are available from the corresponding author on reasonable request.
References
Batugin A, Wang ZQ, Su ZH, Sidikovna SS (2021) Combined sup-port mechanism of rock bolts and anchor cables for adjacent roadways in the external staggered split-level panel layout. Int J Coal Sci Technol 8(4):659–673
Chang J, He K, Pang D, Li D, Li C, Sun B (2021) Influence of anchorage length and pretension on the working resistance of rock bolt based on its tensile characteristics. Int J Coal Sci Technol 8(6):1384–1399
Chen JH, Zhao HB, He FL, Zhang JW, Tao KM (2021a) Studying the performance of fully encapsulated rock bolts with modified structural elements. Int J Coal Sci Technol 8(1):64–76
Chen BB, Liu CY, Wu FF (2021b) Optimization and practice for partition stress load-off of deep mining roadway using empty-hole and deep-hole blasting to weaken coal. Geofluids 2021:9335523
Chen DD, Guo FF, Li ZJ, Ma X, Xie SR, Wu YY, Wang ZQ (2022) Study on the influence and control of stress direction deflection and partial-stress boosting of main roadways surrounding rock and under the influence of multi-seam mining. Energies 15(21):8257
Cui F, Zhang SL, Chen JQ, Jia C (2022) Numerical study on the stress load-off characteristics of a large-diameter borehole. Appl Sci 12(16):7967
Fan L, Liu S (2019) Evaluation of permeability damage for stressed coal with cyclic loading: an experimental study. Int J Coal Geol 216:103338
Li GC, Sun YT, Zhang JF, Zhang QJ, Sun CL, Zhang SH, Bi RY (2020) Experiment and application of coalcrete on roadway stability: A comparative analysis. Adv Mater Sci Eng 2020:1–14
Li YP, Sun DQ, Zhao SK, Liang KH, Cui K, Wang HH (2021) Investigation of stress load-off borehole effects using in situ testing based on distributed optical fibre sensing technology. Adv Civ Eng 2021:8847500
Li YL, Yang RS, Fang SZ, Lin H, Lu SJ, Zhu Y, Wang MS (2022) Failure analysis and control measures of deep roadway with composite roof: a case study. Int J Coal Sci Technol 9(1):2
Liu S, Harpalani S (2014) Determination of the effective stress law for deformation in coalbed methane reservoirs. Rock Mech Rock Eng 47(5):1809–1820
Liu S, Li X, Wang D, Zhang D (2020) Investigations on the mechanism of the microstructural evolution of different coal ranks under liquid nitrogen cold soaking. Energy Sources Part A Recovery Util Environ Eff 7:1–17
Liu H, Zhang B, Li X, Liu C, Wang C, Wang F, Chen D (2022a) Research on roof damage mechanism and control technology of gob-side entry retaining under close distance gob. Eng Fail Anal 138:106331
Liu JN, He MC, Guo S, Li JY, Zhou P, Zhu Z (2022b) Study on characteristics of stress load-off by roof cutting under nonpillar-mining approach. B Eng Geol Environ 81(10):441
Luo Y, Xu K, Huang JH, Li XP, Liu TT, Qu DX, Chen PP (2021) Impact analysis of pressure-relief blasting on roadway stability in a deep mining area under high stress. Tunn Undergr Sp Tech 110:103781
Ma Q, Zhang YD, Zhang XR, Li ZX, Song GY, Cheng JY, Gao KD (2022) The failure law and control technology of large-section roadways in gently inclined soft coal seams. Processes 10(10):1993
Shang YQ, Kong DZ, Pu SJ, Xiong Y, Li Q, Cheng ZB (2022) Study on failure characteristics and control technology of roadway surrounding rock under repeated mining in close-distance coal seam. Mathematics 10(13):2166
Sun Y, Li G, Zhang J, Xu J (2020) Failure mechanisms of rheological coal roadway. Sustainability 12(7):2885
Sun YJ, Zuo JP, Karakus M, Liu L, Zhou HW, Yu ML (2021) A new theoretical method to predict strata movement and surface sub-sidence due to inclined coal seam mining. Rock Mech Rock Eng 54(6):2723–2740
Wang M, Wang XY, Xiao TQ (2017) Borehole destressing mechanism and determination method of its key parameters in deep roadway. J China Coa Soc 42(5):1138–1145
Wang YD, Yu SQ, Rong H, Pan LT (2022a) Research on optimal design of stress load-off blasting parameters of middle rock pillar in near vertical coal seam. Shock Vib 2022:1947283
Wang ZH, Cao JJ, Liu J, Li CC (2022b) Research on permeability enhancement model of stress load-off roadway for deep coal roadway strip. Geofluids 2022:1342592
Xie SR, Li EP, Li SJ, Wang JG, He CC, Yang YF (2015) Surrounding rock control mechanism of deep coal roadways and its application. Int J Min Sci Tech 25(3):429–434
Xie SR, Pan H, Zeng JC, Wang E, Chen DD, Zhang T, Peng XJ, Yang JH, Chen F, Qiao SX (2019) A case study on control technology of surrounding rock of a large section chamber under a 1200-m deep goaf in Xingdong coal mine, China. Eng Fail Anal 104:112–125
Xie SR, Jiang ZS, Chen DD, Wang E, Lv F (2022a) A new stress load-off technology by internal hole-making to protect road-way in two sides of deep coal roadway: a case study. Rock Mech Rock Eng 56(2):1537–1561
Xie SR, Wang E, Chen DD, Jiang ZS, Li H, Liu RP (2022b) Collaborative control technology of external anchor-internal unloading of surrounding rock in deep large-section coal roadway under strong mining influence. J Chin Coa Soc 47(05):1946–1957
Yang S, Liu S, Zhang N, Li G, Zhang J (2021a) A fully automatic-image-based approach to quantifying the geological strength index of underground rock mass. Int J Rock Mech Min Sci 140:104585
Yang HQ, Zhang N, Han CL, Sun CL, Song GH, Sun YN, Sun K (2021b) Stability control of deep coal roadway under the stress load-off effect of adjacent roadway with large deformation: a case study. Sustainability 13(8):4412
Yin YC, Zhou HJ, Zhang YB, Wang C, Deng YH, Chen B (2023) Anchorage weakening effect of coal roadway sidewall with different destressing borehole diameters. Energy Sci Eng 11(3):1325–1335
Yu WJ, Li K (2020) Deformation mechanism and control technology of surrounding rock in the deep-buried large-span chamber. Geofluids 2020:1–22
Yu WJ, Pan B, Zhang F, Yao SF, Liu FF (2019) Deformation characteristics and determination of optimum supporting time of alteration rock mass in deep mine. KSCE J Civil Eng 23(11):4921–4932
Yu H, Jia H, Liu S, Liu Z, Li B (2021a) Macro and micro grouting process and the influence mechanism of cracks in soft coal seam. Int J Coal Sci Technol 8:969–982
Yu GY, Wang J, Hu JZ, Zhu DY, Sun H, Ma XG, Ming W, Li WF (2021b) Innovative control technique for the floor heave in goaf-side entry retaining based on stress load-off by roof cutting. Math Probl Eng 17:7163598
Yue XZ, Tu M, Li YF, Chang GF, Li C (2022) Stability and cementation of the surrounding rock in roof-cutting and pressure-relief entry under mining influence. Energies 15(3):951
Zhang SC, Li YY, Shen BT, Sun XZ, Gao LQ (2019) Effective evaluation of stress load-off drilling for reducing rock bursts and its application in underground coal mines. Int J Rock Mech Min Sci 114:7–16
Zhang H, Li T, Ouyang ZH, Liu S, Yi HY (2021) Research on optimization of coal stress load-off borehole parameters under high-stress conditions. Geofluids 2021:4673152
Zhang K, Liu CY, Zhang HR, Yue X, Liu HD (2022) Research on roof cutting stress load-off of the gob-side entry retaining with roadside backfilling. Front Earth Sci 10:835497
Zhu Z, Du MQ, Xi CH, Yuan HP, He WS (2023) Mechanics principle and implementation technology of surrounding rock pressure release in gob-side entry retaining by roof cutting. Processes 10(12):2629
Zuo JP, Shi Y, Liu DJ, Sun YJ, Chen Y (2019) The equivalent ellipse model and simulation analysis of destressing by cutting groove in deep soft rock roadway. J China Univ Mining Technol 48(01):1–11
Acknowledgements
This work was supported by the National Natural Science Foundation of China (52004286, 52074296), and the Fundamental Research Funds for the Central Universities (2022XJNY02, 2022YJSNY18).
Author information
Authors and Affiliations
Corresponding author
Ethics declarations
Competing interests
The authors declare that they have no conflicts of interest to this work.
Additional information
Publisher's Note
Springer Nature remains neutral with regard to jurisdictional claims in published maps and institutional affiliations.
Rights and permissions
Open Access This article is licensed under a Creative Commons Attribution 4.0 International License, which permits use, sharing, adaptation, distribution and reproduction in any medium or format, as long as you give appropriate credit to the original author(s) and the source, provide a link to the Creative Commons licence, and indicate if changes were made. The images or other third party material in this article are included in the article's Creative Commons licence, unless indicated otherwise in a credit line to the material. If material is not included in the article's Creative Commons licence and your intended use is not permitted by statutory regulation or exceeds the permitted use, you will need to obtain permission directly from the copyright holder. To view a copy of this licence, visit http://creativecommons.org/licenses/by/4.0/.
About this article

Cite this article
Chen, D., Jiang, Z. & Xie, S. Mechanism and key parameters of stress load-off by innovative asymmetric hole-constructing on the two sides of deep roadway. Int J Coal Sci Technol 10, 82 (2023). https://doi.org/10.1007/s40789-023-00635-z
Received:
Revised:
Accepted:
Published:
DOI: https://doi.org/10.1007/s40789-023-00635-z