
Abstract
In this study, four water quality parameters were reviewed at 14 stations of river Ganga in pre-, during and post-lockdown and these parameters were modeled by using different machine learning algorithms. Various mathematical models were used for the computation of water quality parameters in pre-, during and post- lockdown period by using Central Pollution Control Board real-time data. Lockdown resulted in the reduction of Biochemical Oxygen Demand ranging from 55 to 92% with increased concentration of dissolved oxygen at few stations. pH was in range of 6.5–8.5 of during lockdown. Total coliform count declined during lockdown period at some stations. The modeling of oxygen saturation deficit showed supremacy of Thomas Mueller model (R2 = 0.75) during lockdown over Streeter Phelps (R2 = 0.57). Polynomial regression and Newton’s Divided Difference model predicted possible values of water quality parameters till 30th June, 2020 and 07th August, 2020, respectively. It was found that predicted and real values were close to each other. Genetic algorithm was used to optimize hyperparameters of algorithms like Support Vector Regression and Radical Basis Function Neural Network, which were then employed for prediction of all examined water quality metrics. Computed values from ANN model were found close to the experimental ones (R2 = 1). Support Vector Regression-Genetic Algorithm Hybrid proved to be very effective for accurate prediction of pH, Biochemical Oxygen Demand, Dissolved Oxygen and Total coliform count during lockdown.
Introduction
With the outbreak of the coronavirus pandemic, the life of people is adversely affected. COVID-19 came into light in December 2019 from Wuhan city in Hubei Province of China (Hasnain et al. 2020). It affects the respiratory tract and spreads from person to person through physical contact. As researchers are not sure about its source, having not discovered a vaccine to date, no specific treatment is known yet (Chakraborty and Maity 2020). The only options left with the public are social distancing, lockdown and personal hygiene. COVID-19 pandemic has severely affected countries like Italy, the USA, Pakistan, China, Germany and India etc. and their respective Government applied lockdown strictly (Paul et al. 2020).
As a consequence, people remained indoors and commercial activities were shut down (Wray 2020). India was also under lockdown in the wake of coronavirus pandemic. Restrictions on industrial activities during lockdown significantly lowered air and water pollution. This resulted in the substantial rejuvenation of rivers with a positive impact on stable marine life. During lockdown, the water quality of the Ganga river has improved significantly (Singh 2020). Lockdown has caused a reduction in the disposal of hazardous wastes not only in the Ganga but also in other rivers. The Ganga or Ganges is a 1,680 miles long river in India that originates from the Gangotri Glacier of the western Himalayas in Uttarakhand and the river flows from the northwest to the southeast, merges into the Bay of Bengal. In India, it covers states such as Uttarakhand, Uttar Pradesh, Bihar and West Bengal (Chaturvedi 2012). The Ganga is the lifeline of millions who live along the way. Approximately 43% of India's population lives in the Ganga basin, which is over 860,000 km2 and covers 26.3% of the country's total geographical area (Trivedi 2010). It is a sacred river, worshipped as the goddess Ganga in the Hinduism, which witnesses high religious and cultural tourism on its banks. In 2008, the Ganga river declared was the ‘National River’ of India (Sati 2021). There are over 29 cities, 97 towns and thousands of villages on the banks of the Ganga River (Dutta et al. 2020).
It hosts about 140 species of fish and 90 species of amphibians. For most of its course, it is a wide and sluggish stream that flows through one of India's most fertile and densely populated regions. The major contributors of pollution are tanneries in Kanpur, distilleries, paper mills and sugar mills in the Yamuna, Ramganga, Kosi and Kali river catchments (Dutta et al. 2020). There has been a decrease in fish population along the river, indicating a lack of supportive habitat and water quality degradation. Fishermen report destructive fishing, overfishing and the construction of Farakka barrage as the significant reasons for the decline in fish population from the river-floodplain in Bihar (Dey et al. 2019). In 2017, the river Ganga was considered to be sixth most polluted river in the world (Paul 2017). Lots of steps have been taken to clean the river, but the desired results have not been achieved to date. Drew (2017) mentioned that there are numerous hydropower stations, dams and barrages in the main stem of the Ganga river and its tributaries that are harming and obstructing the flow of the river. Apart from this, construction and widening of roads and tunnels in the upper Ganga region affects the flow of water and leaves the river bed dry. The author termed this as “destructive model of development” and added that the continuous inflow of untreated wastewater in the Ganga, including untreated sewage and hazardous waste from the industry as well as agricultural runoff, is worsening the water quality of the river (Drew 2017).
The river Ganga passes through states that serve the various subsistence needs of people living in the surrounding areas, such as drinking, bathing, fishing and agriculture. Despite being one of the most functionally important rivers in the world, serving an estimated 500 million people, the Ganga is contaminated in large amounts by the discharge of untreated wastewater and untreated industrial waste (Postel and Richter 2012). High population density at the basin, several festive celebrations at the shore, garbage disposals and dumping of corpses directly into the river Ganga have contributed most to its pollution. The river also serves the agriculture in the surrounding region and therefore ends up with a vast amount of chemical fertilizers, pesticides and insecticides that worsen its quality (Chakraborty 2021). A non-point category source of pollution, that is, open defecation, is a significant and worrying cause of the disease-causing microorganisms that dwell in the river Ganga. In the river beyond Kanpur, fecal coliform levels have crossed the acceptable bathing standard (Srinivas et al. 2020). High pollution level increases the chances of obstructions, ultimately leads to stagnant water condition which breeds diseases such as dengue, malaria and chikungunya. These deadly diseases take millions of lives and cost the country colossal capital every year. The harmful microorganisms originating from fecal pollution are also suspected of having a pivotal role in antibiotic resistance (Lockwood 2016). The government has focused on pollution point source control policies (Srinivas et al. 2020), but no significant improvement has not yet been seen so far.
In this study, changes in water quality of the river Ganga have been evaluated during the lockdown phase and compared with pre-lockdown statistics. Bioinspired mathematical models such as Streeter Phelps, Thomas Mueller, Support Vector Regression with Genetic Algorithm (SVR-GA), Lasso regression, Artificial neural network (ANN), Newton’s divided difference (NDD) and Polynomial regression model have been used for the computation of water quality parameters in the river water under both pre-lockdown and during lockdown conditions. Streeter Phelps and Thomas Mueller model were utilized for predicting oxygen saturation deficit in the river Ganga. In addition to this, SVR-GA, Lasso regression and ANN were implemented to model levels of DO, BOD, pH and TC in the Ganga river. Finally, NDD and Polynomial regression models have been used to predict water quality parameters (DO, BOD, pH and TC) in the present condition and future changes in the water quality of the river Ganga such as after unlocking phase-I in India, i.e., 30th June 2020 based on the past trends. SVR-GA is a hybrid algorithm which uses a hyperparameter optimization algorithm (GA) along with a modeling algorithm (SVR) (Jiang et al. 2013). The ability of SVR marked by its margin approach is well suited for all kinds of data and has been successfully used for the modeling of pH and DO before. Lasso Regression model, which has a shrink or reject feature is advantageous when dealing with regression data. This model originates from Ridge regression and is a robust regression algorithm which was also used for lockdown data prediction.
ANN is an oversimplified version of the inter-neuron communication process that takes place in the brain. Their architecture depends on the number of hidden layers and the activation functions, thus leaving a room for improvisation and experimentation (Ahmed 2017). A highly interconnected neural network is very effective for accurate predictions. Still, it tends to over fit on the training data, that is why smaller and effective neural network models have been developed (Sarkar and Pandey 2015). One such model is the Radical Basis Function Neural Network (RBF-NN) is a simple one hidden layer ANN which uses a radical basis as its activation function. In the present study, the RBF-NN model, Levenberg–Marquardt algorithm (LMA) and a two hidden layer Multi-Layer Perceptron (MLP) model for prediction of water quality data have been applied. The RBF-NN model was used with GA as the optimizer of its hyperparameters. GA selects a random population based on the specified constraints and picks out the best possible pair of parameters which have the highest fitness. The GA fitness function has been represented with mean squared error (MSE) in the present work. The present study will be useful in developing technologies for reducing the pollution level in the river Ganga and other rivers, preventing it from returning to the previous state based on the data available from these models. This study is also helpful in formulating/revising the laws dealing with a permissible limit of discharge of industrial effluents in the river Ganga and other natural water resources. The entire analytical study of the Ganga river by using CPCB data was conducted at IIT (BHU) Varanasi (Co-ordinate 25° 15′ 30″ N 82° 59′ 39″ E) Varanasi, India.
Ganga river (literature survey before and during lockdown)
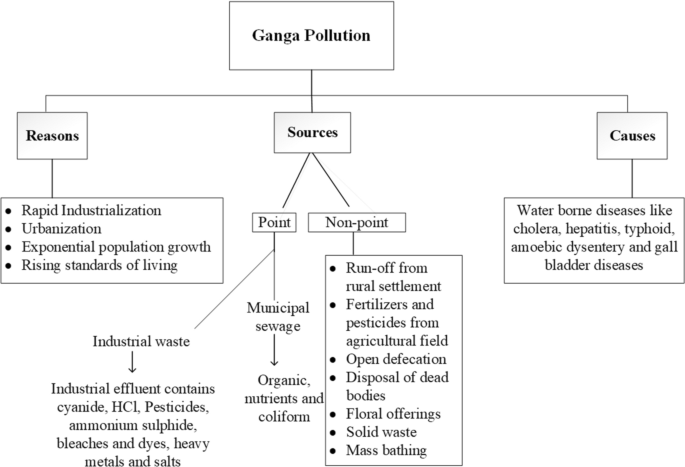
Before lockdown, the river Ganga was not suitable for bathing from Uttar Pradesh to West Bengal with the exception of certain places in Uttarakhand (Webdesk 2020). Figure 1 shows the sources of pollution in the river Ganga.
Ganga pollution overview
Over 500 water samples from April to June were analyzed for two consecutive years, i.e., 2017 and 2018 (Haider Naqvi 2020). The amount of DO decreased to less than 2 mg/L due to the hypoxic state of the river bed, which made the river unable to sustain aquatic life. The river Ganga has been used for dumping of industrial and domestic waste in industrial towns that contaminated the river. For instance, 400 tanning units contribute 50 MLD (million liters per day) of hazardous waste and 140 MLD of domestic waste in Kanpur (Haider Naqvi 2020). The water at Haridwar and Rishikesh was found unfit for drinking and bathing. The river water was in class B ever since the foundation of Uttarakhand was laid (Srivastava 2020).
It was reported that only 18 spots were fit while 62 spots were unfit for bathing and the river was almost unfit for drinking with a high level of coliform bacteria in the river. River water from 7 spots out of 86 monitoring stations was drinkable only after disinfection. The spots which were found suitable for drinking purpose after disinfection have been classified as ‘class A’ (Bhagirathi at Gangotri, Rudraprayag, Devprayag, Raiwala-Uttarakhand, Rishikesh, Bijnor and Diamond Harbor in West Bengal). Water at 78 monitoring stations was not suitable for drinking and bathing in Bhusaula in Bihar, Kanpur, Gola Ghat in Varanasi, Dalmau in Raebareli, Sangam in Allahabad, Ghazipur, Buxar, Patna, Bhagalpur, Howrah-Shivpur in West Bengal and many others. Thus, water available in pre-lockdown condition of the river Ganga was not suitable for drinking and bathing.
The industrial and commercial activities almost ceased during the lockdown, allowing the Ganga river to breathe again. In India, a total of four phases of lockdowns were observed for 68 days (Lockdown 1.0 (21 days)—25th March, 2020 to 14th April, 2020, Lockdown 2.0 (19 days)—14th April, 2020 to 3rd May, 2020, Lockdown 3.0 (14 days)—3rd May, 2020 to 17th May, 2020 and Lockdown 4.0 (14 days)—18th May, 2020 to 31st May, 2020).
Amid of lockdown, the CPCB, India reported on April 28, 2020 that the Ganga water has improved significantly for bathing purposes in most of the surveillance centers. Observations recorded during lockdown were as follows:
-
(a)
Rise in DO level from 22nd March, 2020 to15th April, 2020.
-
(b)
Level of BOD showed a significant decline. The lower range indicated the better health of the river.
-
(c)
A gradual rise in BOD level toward downstream stretches of the river Ganga.
Singh (2020) has made a remarkable observation that the level of DO increased from 25 to 30% at five ghats in Varanasi, while the level of BOD decreased up to 35%. Detailed information on changes in water quality parameters during lockdown is tabulated in Table S2 of supporting material.
Materials and methods
Study area
The total length of the Ganga river (measured along the Hooghly) from source to mouth is 2, 525 km. The Ganges originates near the Gangotri and travels about 350 km before entering into the village Balawali (district Bijnor) of Uttar Pradesh. It flows from Balawali approximately 1,150 km in Uttar Pradesh and enters the village Sitab Diara, Bihar. It flows 450 km from Sitab Diara and arrives into the West Bengal in Manikchak village (district Malda town). At the Farraka barrage, the Indian government controls water of the Ganga in distributaries namely Hooghly and Padma in the West Bengal and Bangladesh, respectively. It flows 550 km in West Bengal from village Manikchak to Haldia (near Calcutta) before merging into the Bay of Bengal. The 14 real-time stations from Anoopshahar, Uttar Pradesh to Howrah bridge, West Bengal have been considered in the present study for data modeling.
Water quality data set
The data sets of the pre-lockdown condition were collected from the system software ‘Suitability of river Ganga water’ designed by the Central Pollution Control Board (CPCB), India. This is a real-time water quality monitoring system established by CPCB, which helps in monitoring changes in the river at any given time. In India, CPCB has classified water into five classes (A to E), defining different treatment levels for the various purposes (Table S1 of supporting material shows the classes of water defined by CPCB). This classification helps managers and planners of the water quality monitoring system to set targets for water quality and to design appropriate rehabilitation programs for different water bodies. In India, water quality standards are established by CPCB in terms of the primary water quality criteria.
Water quality parameters
The parameters of water quality considered in the present study were pH, BOD, DO and TC. The pH is a measure of how acidic the water is and about 7.4 is considered as the optimum pH for the river water (Azad 2020). Wastewater from sewage treatment plants comprises of organic matter which is decomposed by the microorganisms and in return the dissolved oxygen is consumed. When more oxygen is consumed than produced, the concentration of DO decreases proportionately and possibly the population of a few susceptible organisms may move away, weaken or die. The DO level fluctuates in every 24 h and seasonally. It varies with the temperature of the water and altitude (APHA 1992). BOD influences the amount of DO in rivers and streams. Higher is the BOD value, faster is depletion of the oxygen in the stream, which means that there is less oxygen available for higher aquatic life forms. High level of BOD has similar effects as low DO concentration such as suffocation and death of aquatic organisms. A test for TC is the most basic measure for bacterial contamination of a water body. TC counts provide a general indication of a water supply's sanitary conditions. The risk of waterborne infection is increased when coliform bacteria are found in drinking water. Several types of malfunctions can cause TC contamination like seepage through the well casing, faulty well cap and well flooding. In order to cope with bacterial contamination, many long-term solutions are available such as inspection, repair of defective wells and installation of continuous disinfection equipment.
Mathematical models
Streeter Phelps model
Streeter and Phelps in 1925 developed a water quality model based on field data from the Ohio river, which was initially used by the US Public Health Service (Digvijay Kumar 2017).
In the present study, the Streeter Phelps model has been used to model DO in 14 real-time stations of the Ganga river.
Considering a mixed system (no in-/out flow) (Fig. 2) with the state variables Z and X,

A mixed system with no inflow/outflow
where Z is degradable organic matter (mg/L) and X is the DO level (mg/L).
Assuming,
-
(a)
Aerobic decay of organic matter ‘Z’ by bacteria suspended in the water column (1st order kinetics)
-
(b)
Consumption of oxygen ‘X’ during mineralization of ‘Z’
-
(c)
Exchange of oxygen between water and atmosphere
Differential equations and parameters involved in the model are
where kd is decay rate (1/Time), ka is aeration rate (1/Time), s is a stoichiometric factor (Mass X/mass Z) and Xsat is O2 saturation level (mg/L).
These equations are valid only when X > > 0.
Re-definition of state variables leads to simplified form at boundary conditions:
Old | New | Relation | Meaning |
|---|---|---|---|
Z | L | L = Z | Biochemical O2 demand for complete degradation of Z |
X | D | D = Xsat − X | O2 saturation deficit |
where L is BOD (biochemical oxygen demand) and Stoichiometric factor ‘s’ equals 1 → omitted.
Thus, Eqs. 1 and 2 can be rewritten as:
Equation 3 may be expanded by separation of variables for the initial condition L (t = 0) = Lo.
Integration of Eq. 3 yields Eq. 5.
Substituting the value of L from Eq. 5 in Eq. 4 results in Eq. 6
Now, using the method of integrating factor, re-ordering of Eq. 6 yields
Multiplication with the factor “exp (ka· t)” mimics Eq. 8
Applying the product rule, Eq. 9 was obtained as
Equation 10 was achieved after separation of variables and integration
Equation 10 is O2 saturation deficit Streeter Phelps model.
Thomas and Mueller model
Thomas (1948) accounted for settle able BOD in the dissolved oxygen sag equation of Streeter Phelps model. Analytical solutions for simple initial and boundary conditions were developed by Thomann and Mueller (1987). The model includes changes in DO concentrations due to distributed sources (non-point sources) within the stream. Equation 11 illustrates the model of Thomas and Mueller (TM):
where Ld = non-point source BOD (mg/L).
It is apparent from Eq. 11 that the soluble concentration of the DO generated in range by non-point sources was combined at the entry point with the attenuation phenomenon of the DO entering into the cell.
NDD model
Polynomial interpolation determines a polynomial of order n that passes through n + 1 point. The NDD model is of interest due to its clarity and precision. This model shows where a function will go, based on its y-values at respective x-values (Das and Chakrabarty 2016). Newton’s polynomial possesses the permanence property, which means that new data values can be represented by (n + 1)th degree polynomial and the term can be added to previously obtained nth degree polynomial. Accuracy of the polynomial interpolation depends on how close the interpolated point is to the middle of x-values used. It generates only one polynomial of least possible degree that passes through all the data points. Equation 19 depicts NDD model
Newton’s divided difference interpolation method has been used to generate the function depicting water quality of the Ganga river from pre-lockdown to lockdown period. After obtaining interpolating polynomial, it was extrapolated to predict water quality parameters (BOD, DO, pH and TC) till 7th August, 2020 (200th day from 20th January). In the present study, 20th January, 2020 has been marked as 0th day (pre-lockdown data). Using this model, polynomials were obtained for BOD, DO, pH and TC separately for each of the 14 stations and these were plotted to extrapolate values for upcoming months. This model was trained using python programming language.
Polynomial regression model
Polynomial regression determines nonlinear relationship between the value of ‘x’ and the corresponding conditional mean of ‘y’ (Ostertagová 2012). The expected value of ‘y’ can be modeled as nth degree polynomial, yielding a general polynomial regression model (Eq. 13)
In this study, the polynomial regression model was used to model values of DO, BOD, pH and TC as a function of time to analyze and predict the Ganga water quality till 7th August, 2020. The model was trained to generate polynomials of degree 2, 3 and 4 for DO, BOD, pH and TC at real-time stations. Just to maintain consistency in results, this model was also trained using python programming language.
Radical basis function kernel support vector regression with genetic algorithm (SVR-GA)
Vapnik et al. (1997) developed an algorithm that used the earlier work of Support Vector Machines to address regression problems, which was then known as Support Vector Regression (SVR). The most powerful aspect of SVR is that it takes into account the error limit of epsilon, which means that an error between the predicted and the true value is allowed to lie within the range of [− \(\varepsilon ,\varepsilon\)] and that no error greater than that is accepted. Using this rule, a function ‘f’ is generated that would be able to fulfill this condition. In linear form, function ‘f’ can be estimated as:
where \(\left\langle {w,x} \right\rangle\) is the dot product of w and x.
Flatness in Eq. 14 would mean to obtain a small value of w by minimizing the norm (Smola and Schölkopf 2004).
Usually, it is not always possible to search for a function ‘f’ which would produce data pairs which lie in the epsilon margin. Therefore, soft margin like approach is used, where slack variables \(\left( {\xi i,\xi i*} \right)\) representing the distance between the true values and the epsilon tunnel are introduced. This addition helps in making the optimization problem feasible. Thus, a risk function ‘R’ is defined by incorporating an epsilon insensitive loss function with a constant ‘C’. The regularized convex optimization problem (Smola and Schölkopf 2004) can be written as:
where C is a positive constant that plays a role in determining the extent to which a deviation from the error tunnel is tolerated.
This can be seen as a trade-off between the model flatness and empirical risk (Smola and Schölkopf 2004). Lagrange construction of the primary function gives a quadratic optimization problem that is solved for \(\left( {\alpha_{i} ,\alpha_{i} *} \right)\) (Vapnik and Vapnik 1998):
Maximize:
Here, (\(\alpha_{i} ,\alpha_{i} *\)) are Lagrange multipliers.
The vectors xi corresponding to non-zero Lagrange multipliers are then called as support vectors (Vapnik et al. 1997). After performing optimization, f(x) can be obtained as:
A kernel \(K\left( {x,x_{i} } \right)\) is defined for a nonlinear regression model. The kernel generates an inner product in some feature space and solves the corresponding dual optimization problem (Vapnik et al. 1997). Some examples of kernels are Polynomial, Gaussian, Radical basis function. In the present study, Radical basis function (RBF) kernel has been used. The kernel and the nonlinear objective function can then be written as:
The variables \(C,\varepsilon ,\gamma\) are user-defined while implementing SVR. Since these hyperparameters are crucial for the proper functioning of the algorithm, their right selection is of utmost importance. Genetic Algorithm (GA) was used to meet this requirement. It was first introduced by Holland (1992) and is a natural evolution-based technique that seeks inspiration from Darwin’s theory of survival of the fittest. The GAs are being applied successfully in a number of areas such as job shop problems (Falkenauer and Bouffouix 1991; Nakano and Yamada 1991), control system optimization (Krishnakumar and Goldberg 1992), pipeline optimization (Goldberg and Kuo 1987), molecular geometry optimization (Deaven and Ho 1995) and feature subset selection (Yang and Honavar 1998).
Goldberg (2006) has outlined the differences between GAs and other optimization techniques. Some of the advantages include the use of the coding of parameter set and not the parameters themselves, search from a population of points, using payoff information when binding to auxiliary information and the use of probabilistic transition rules over deterministic rules. These four advantages give GAs an edge over other commonly used traditional optimization techniques. GA can be broken down into four steps where the GA selects a population of individuals and computes the fitness function for each individual. Individuals with the highest fitness function are chosen to produce offsprings. The second and third steps involve crossovers and mutations between the selected individuals, which lead to the formation of a new generation. Finally, the fitness function for this new generation is calculated and the process repeats from step one unless the goal of the algorithm is reached.
The combination of SVR with a real-valued GA has been used as the optimization algorithm for SVRs hyperparameters (\(C,\varepsilon ,\gamma\)). Liu et al. 2013 used this hybrid model for water quality estimation (DO and temperature) and compared it with traditional SVR and BP neural network models. Their RGA-SVR model outperformed over the traditional models. Similarly, Wang et al. (2011) used SVR model with GA automated SVR parameter selection for the prediction of permanganate index (CODMn), ammonia–nitrogen (NH3–N) and chemical oxygen demand (COD) and found this superior to MLR algorithm.
Lasso regression
The lasso regression (LR) model was developed by Tibshirani (1996), which is built upon the robustness of ridge regression. It preserves the quality features of ridge regression and subset selection by shrinking some coefficients and setting others to zero. For data \(\left( {x_{i} ,y_{i} } \right)\), i = 1, 2, … n. where, \(x_{i} = \left( {x_{i1} , \ldots x_{ik} } \right)\) are the predictor variables and yi are the responses.
The lasso optimization problem can be solved by minimizing Eq. (20).
An assumption is made that xij are standardized to avoid any dependence on the measurement scale. Here, \(t \ge 0\) is a prespecified tuning parameter which controls the amount of shrinkage applied (Tibshirani 1996). Lasso regression has been previously used as a predictor algorithm for water quality estimates (Ahmed et al. 2019; Brooks et al. 2016).
Artificial neural network (ANN)
ANN is a very powerful algorithm whose architecture is inspired by the process of communication of neuronal cells. ANN can take many forms and in the present study the LMA, MLP and RBF-NN have been focused. ANN work immensely well with water quality data (El-Shafie et al. 2011). Authors compared the ANN model with the linear regression model and found that ANN has high accuracy as compared to the other models. Najah et al. (2013) performed a comparative study with different ANN models like RBF-NN, MLP-NN and Linear Regression model (LRM) for water quality estimation and found RBF-NN superior to MLP-NN and LRM. Authors showed that RBF-NN could be a reliable water quality predictor model. Both of these studies used a trial and error basis for determining the number of hidden layers and neuron units in the layers.
ANN with LMA
The chosen ANN for the pH, DO, BOD and TC models consisted of one input layer with fourteen input variables, one hidden layer and one output layer. In addition to this, TC consisted of a similar number of hidden and output layers except for 12 input variables. The designed ANN models (pH, DO, BOD and TC) were trained for utilizing LMA as it rapidly solves and tunes the model parameters in comparison with other algorithms (Singh et al. 2009). The model simulation has been done by ANN tool in MATLAB 2017a.
MLP
The MLP is a neural network with completely connected layers that are stacked against each other. Each layer is activated using a particular activation feature. In order to construct an MLP, two fully connected hidden dense layers were superimposed and activated by the function ‘rectified linear unit’ (RELU) from the python library ‘Keras.’ Data were then iterated over sufficient epochs until it converged to produce the lowest MSE (Gardner and Dorling 1998).
RBF-NN
The RBF is a feedforward neural network with one hidden layer between the input and output layer. In an RBF-NN, all neurons from a layer are connected to all neurons in the next layer. Harpham et al. (2004) highlighted the advantages of applying GAs to RBF-NN, thus creating a hybrid. This addition eliminates the test and error approach since GA automatically produces an optimal solution for hyperparameters. In the present study, a GA-based search algorithm has been applied to find optimal hyperparameters for RBF-NN model.
Results and discussion
Statistics of the river Ganga: pre-lockdown and during lockdown
As shown in Table 1, the parameters (pH, DO, BOD and TC) of the river Ganga varied in the lockdown period.
In the present study, 14 stations namely Anoopshahar; Farrukabad; Rajghat, Kannauj; Bithoor, Kanpur; Jajmau, Kanpur; Assi ghat, Varanasi; Malviya Bridge, Varanasi; Patna; Bhagalpur; Berhampore; Monipurghat, Nadia; Palta, Barrackpore; Serampore, Hooghly and Howrah bridge, West Bengal were analyzed. The changes in the parameters at these stations have been listed below.
At Anoopshahar, pH increased by 0.1, followed by an increment in BOD and DO with no detectable change in the values of TC. The increment was in the range as delineated by CPCB, India (shown in Table S1 of supporting material). Thus, this water quality at Anoopshahar permitted all the uses of water.
In the Farrukabad and Kannauj, there has been a decrease in pH, TC and DO with the simultaneous increase in BOD level. Though these changes were not positive yet the variation in pH, DO, TC and BOD were in the permissible range of CPCB (Table S1 of supplementary information).
In Bithoor and Jajmau Kanpur, there was a decrease in pH, DO and BOD and water at these stations were considered pollution-free which can be used for drinking, bathing, irrigation and other purposes. Considering TC, its level was increased in Bithoor but declined in Jajmau, Kanpur but it was in the range given by CPCB in Bithoor but not in Jajmau. Thus, the river ganga water can be used for all purpose in Bithoor but not in Jajmau, Kanpur.
In Assi ghat and Malaviya Bridge, Varanasi, a decrease in pH and DO level together with increase in BOD and TC was observed. These changes were not in an acceptable range of CPCB, India.
In Patna, the water quality was found unsuitable owing to a slight decrease in pH and DO and significant augmentation in BOD indicated a high level of pollution. But TC was found to decline here and it was within the acceptable range given by CPCB. At Bhagalpur, Bihar water sample was found unfit for drinking, bathing and irrigation.
In Berhampore, Monipurghat, Nadia; Palta, Barrackpore; Serampore, Hooghly and Howrah bridge, West Bengal a decrease in the pH, DO and BOD was observed with increase in TC and it was much higher than the acceptable range given by CPCB. The decrement in pH, DO and BOD was in the range of permissible limit demarcated by CPCB. Thus, these stations also possessed some positive changes similar to Anoopshahar, Farrukabad, Rajghat and Varanasi. The changes in pH, DO, BOD and TC during lockdown were studied and compared with pre-lockdown data as shown in Table 1.
As shown in Table 1, after lockdown pH in all stations was within an acceptable range of 6.5–8.5. Before lockdown, only two stations, namely Malviya Bridge, Varanasi and Serampore, Hooghly exceeded this range. But during the lockdown, these stations were within the standard range as depicted by CPCB. These changes replenished the Ganga river after a long gap.
It is appropriate to mention that there had been an insignificant change in water quality parameters during lockdown 3.0 and 4.0 as the time difference was of 14 days only.
Specifically, the health indicators of the Ganga's water improved significantly such as increased DO (in Anoopshahar), reduced BOD (in Bithoor, Kanpur; Jajmau, Kanpur; Malviya Bridge, Varanasi; Berhampore; Monipurghat, Nadia; Palta, Barrackpore; Serampore, Hooghly and Howrah bridge) and reduction in TC (Farrukabad, Rajghat, Jajmau, Patna and Palta, Barrackpore) during the lockdown.
Mathematical models
Streeter–Phelps model
Streeter Phelps model equation was used to find O2 saturation deficit (D) for 14 real-time stations of the river Ganga (Table 2). The value of ‘D’ was experimentally determined and compared with the theoretical value derived from the model (Fig. 3).

Comparison of experimental and theoretical values of D for 14 real-time stations with reference to Streeter Phelps model
It was observed from Table 2 that this model was not accurate for predicting the value of ‘D’ as it showed a very high percentage of error for each real-time station of the river Ganga together with a sluggish coefficient of regression (R2 = 0.57).
Bhargava (1986) revealed that Streeter Phelps models could not precisely predict DO sag of a stream instantly after sewage outfalls as model does not take bio-flocculation and sedimentation of the adjustable BOD into account. Jha et al. (2007) applied Streeter Phelps models for analyzing one of the most polluted rivers in India, i.e., the river Kali and showed the negative outcome with under and over-prediction. Kaushik et al. (2012) modified Streeter Phelps model by considering the settle able component of BOD and the effect of storage zones on river’s DO. Authors found that the modified model was able to predict parameters of rivers more accurately.
Thomas and Mueller model
Thomas and Mueller model was used to find ‘D’ including non-point sources in the river water for 14 real-time stations. The theoretical results did not show a close agreement with the experimental values (Fig. 4, Table 3). However, this model had a slightly better fit as compared to Streeter Phelps model based on the value of R2 (= 0.75).

Comparison of experimental and theoretical of D for 14 real-time stations with reference to the Thomas and Mueller model
NDD model
The water quality parameters were predicted for 7th August, 2020, i.e., the 200th day starting from 20th January, 2020. Table S3 of supporting material shows the value of predicted parameters on 7th August, 2020.
Assuming that the conditions do not return to original pre-lockdown conditions, this model analyzed the situation from pre-lockdown to lockdown and predicted the possible values for the near future. It also provided incorrect results for 3 stations, i.e., Rajghat, Patna and Bhagalpur, which do not seem to be possible. It was inferred from this model that the actual values were close to predicted values (pH, BOD, DO and TC) for 7th August, 2020.
Polynomial regression model
Water quality parameters were predicted using 2, 3 and 4 degree polynomials on 30th June, 2020 (i.e., on day 162 starting on 20 January 2020) and these values are shown in Tables S4, S5, S6, S7 and S8 of the supporting material. For prediction, 30th June, 2020 was selected as it falls close to 31st May, 2020, and reduces the chance of error that could increase if one moves away from the 31st May, 2020 data values. Considering the range of values from these polynomials, it can be predicted that the water quality parameters (BOD, DO, pH and TC) will fall within the range of values that were predicted for 30th June, 2020.
The actual value of these parameters will depend on how the level of pollution goes back to the previous one. The values will more likely to fall in the ranges stated in Table S4, S5, S6, S7 and S8 of the supporting material.
This model analyses the situation from pre-lockdown to lockdown statistics and predicts somewhat possible values for near future. From the graphs, it was clinched that all values fall in acceptable range except BOD at Patna and Bhagalpur. Also, the DO levels at Rajghat, Patna and Bhagalpur show steep changes. The quality of the Ganga water appeared to be improved from pre-lockdown situation. Since the values and curves for polynomial second degree were the same as for NDD model, this implied that the NDD model was the reliable one.
The polynomial regression model was better than NDD as it provided the range (generated by 2nd- , 3rd- , and 4th-degree polynomial) in which the predicted parameters would lie. The polynomial regression model fitted better than NDD as most of the actual values lie in or near the predicted range. This is due to the fact that NDD is an interpolation method; however, in the present work it predicts the future values by extrapolating the curve. Also, NDD resulted in the second-degree polynomial, which does not correspond to the actual variation in the parameters in due course of the time.
SVR-GA
The SVR model, a kernel-based regression model was used and its parameters, i.e.,\(C,\varepsilon ,\gamma\) were optimized for each water quality parameter with the help of a simple GA. Here, GA was employed using a one-point crossover function having mutation with a root mean square as the fitness measure. The algorithm was performed on a population of 50 randomly selected individuals iterated upon 30 generations with a crossover probability of 0.5 and a mutation probability of 0.02. Upon running, the algorithm first randomly selects 50 individuals with their ranges being, C = [1, 100], \(\gamma = \left[ {0.1,1} \right]\), \(\varepsilon = \left[ {0.001, 0.01} \right]\). Each of these individuals undergoes crossover and mutation, after which the fitness of an individual is calculated. This process runs over a set of 30 generations with each generation producing a slightly better generation than itself. From the last generation, the individual with the highest fitness function is chosen as the best individual.
The model showed overfitting with zero MSE upon running. To solve this, fivefold cross-validation was used wherein the data were split into test and train set five times. This helped in solving overfitting. The model reported different MSE for pH, DO, BOD and TC in Table 4.
The R2 value for the pH, DO and TC approached unity signifying a perfect fit. BOD, however, showed a low R2 value (Table 5).
These values show that out of the three parameters studied, the SVR—GA model works best for the pH, DO with R2 value approaching unity (Table 6, Fig. 5).

SVR-GA predicted values of BOD, pH, DO and TC
For TC analysis, data from January were paired with other parameters (pH, DO, BOD and TC). This was used as the input data set for the prediction of TC during the lockdown. SVR-GA gave an R2 value of 0.99, pointing toward a high goodness of fit.
Lasso regression
In this model, a ‘t’ value of 0.01 was used. Trial and error basis were used and alpha values have been modified and tested. The alpha value of 0.01 was finally selected. The model provided R2 values leaning toward zero for pH, DO, BOD and TC and failed to predict the data correctly (Tables 4, 5, 7, Fig. 6).

Lasso predicted values of BOD, pH, DO and TC
Apart from this, Lasso regression performed robustly for TC prediction and gave R2 values of 0.93.
ANN with LMA
In the present study, a nonlinear transfer function (TANSIG) in the hidden layer was used for ANNs. The ANN predicted output and error in pH, DO, BOD and TC model for real-time stations of the river Ganga are shown in Table 8.
The plots between experimental and theoretical values of pH, DO, BOD and TC values are shown in Fig. 7.

Comparison of the experimental and theoretical a pH, b DO, c BOD and d TC levels in the river Ganga
The best validation performance in ten neurons was 0.08877, 0.38177, 34.7517 and 16,371,716.42 at epoch 3, 3, 2 and 7 for pH, DO, BOD and TC, respectively, with the lowest MSE (Fig. 8).

Performance plot for modeling of a pH, b DO, c BOD and d TC levels in the river Ganga
The linear R2 values for training, validation and test data sets used for all the models (pH, DO, BOD and TC) are represented in Figure S1 of supporting material. The selected ANN generated the most trustworthy models for all three data sets. The experimental and theoretical values pH, DO, BOD and TC derived through these models were in close agreement (R2 = 0.92–1.0). This suggested that the model fitted well with the experimental data sets. ANNs have also been used to estimate and forecast the water quality variables like modeling of DO and BOD in the river water (Singh et al. 2009).
Similarly, Shamseldin (2010) used ANN for forecasting the flow of rivers in the developing countries. The chlorine concentration in the water distribution network has been assessed through ANN by Cordoba et al. (2014). ANN has been used for the prediction of water quality index (Bansal and Ganesan 2019; Gupta et al. 2019). The results of ANN-based modeling have shown significant accuracy over other traditional modeling techniques. Shakeri Abdolmaleki et al. (2013) applied ANN for predicting copper concentration in the drinking water reservoir of Iran. Authors found that predicted values were very close to the real concentration of copper. The BOD, DO and other water quality parameters were forecast by using ANN in the Karoon river (Emamgholizadeh et al. 2014). The predicted values were close to the real ones, which proved ANN, an effective modeling technique for predicting water quality variables in the river. Gomolka et al. (2018) used ANN to estimate the BOD level and for controlling rate of aeration in river.
MLP
Two RELU activated hidden layers were used and epochs were performed until full convergence of loss function was observed.
The MLP showed excellent results for pH, DO and BOD with R2 values very close to one (Tables 4, 5, 9, Fig. 9) but it's prediction for TC was not at par with its performance for the other indices.

MLP predicted values of BOD, pH, DO and TC
RBF-NN
An RBF-NN was applied with GA to optimize the hyperparameters like learning rate (lr) and several kernels (k). A multi-feature input algorithm was constructed which picked the hyperparameters using a GA where MSE was chosen as the fitness function. The initial population was picked out where the kernel number and learning rate constrained to a range of [1, 7] and [0.0001, 0.02], respectively. An initial population size of 50 was chosen. The algorithm was run for 30 generations with a crossover and a mutation probability of 0.7 and 0.02, respectively. The model ran for 100 epochs each time. The results of the model showed poor performance for BOD, DO and TC. The model’s goodness of fit for pH is better than Lasso regression but not SVR and MLP (Tables 4, 5, 10, Fig. 10).

RBF-NN predicted values of BOD, pH, DO and TC
Comparative study
Several studies conducted by other researchers on the quality of the Ganga's water during lockdown have been discussed in detail in Table 11. The outcomes of their work with the technique involved in the estimation of water quality parameters are included and have been compared with the present study.
Conclusion
In the present study, the water quality of the river Ganga has been evaluated during the lockdown and predicted for post lockdown conditions. It was found that the pH of all stations was within the standard range 6.5–8.5 in lockdown period. An increment in DO has been observed in Anoopshahar. Apart from that, all stations had DO > 5 mg/L except Patna and Bhagalpur. It was noted that Patna and Bhagalpur stations had very high BOD levels compared to other stations that signified a substantial level of pollution. During the lockdown, Anoopshahar, Farrukabad, Rajghat, Kannauj and Assi ghat, Varanasi had BOD exactly as 3 mg/L. The decrement in TC was observed in Farrukabad, Rajghat, Jajmau, Patna and Palta during the lockdown period. In the present study, bioengineered mathematical models, namely Streeter Phelps, Thomas Mueller, SVR-GA, Lasso Regression, ANN, NDD and Polynomial regression, were attempted to predict the water quality parameters. Polynomial regression and NDD model were able to predict pH, BOD, DO and TC levels from 20th January, 2020 to 30th June, 2020 and 07th August, 2020. Thus, NDD and polynomial regression models were used to predict the near future values of the water quality parameters (BOD, DO, pH and TC) of the river Ganga. But NDD model was not able to predict TC values. However, the NDD model is simply an interpolation method, which can be further extrapolated to predict the values. On the other hand, polynomials of 2, 3 and 4 degrees were generated in polynomial regression model to obtain the range of predicted values. The NDD model is verified by the polynomial degree 2 regression that appeared to be acceptable after comparison. Overall, polynomial regression model was better than NDD model. In ANN models using LMA, the best validation performance was observed with ten neurons as 0.08877, 0.38177, 34.7517 and 16,371,716.42 at epoch 3, 3, 2 and 7 for pH, DO, BOD and TC, respectively. Additionally, SVR-GA hybrid was superior compared to its counterparts such as Lasso Regression and RBF-NN in the prediction of real-time water quality data indices such as pH, DO of the river Ganga. It also produced the best results for TC forecast during the lockdown period. It was unable to predict the lockdown BOD values correctly. MLP was the second-best algorithm after SVR-GA, which showed accurate fits for three (pH, DO, BOD) of the indices but couldn’t accurately predict TC levels. SVR-GA and MLP showed a nearly perfect fit for the pH and TC data with significantly lesser MSE values. The R2 value for pH modeled by SVR-GA (R2 = 0.99) and MLP (R2 = 0.99) was near unity, pointing to a perfect fit. Similarly, the R2 value for TC modeled by SVR-GA is 0.99. The abnormal high deviations in BOD modeling in all the models except MLP (R2 = 0.99) can be due to the presence of outliers. It can, therefore, be stated that SVR and MLP are relatively quicker and better choices as the modeling techniques for predicting values of water quality parameters of the river Ganga. Thus, in the present study, SVR-GA, MLP and polynomial regression model were found superior to NDD for the prediction of water quality parameters in the long run. Moreover, as these models are fitted with the least error, there are numerous applications where their use is highly recommended. Like, SVR-GA algorithm can be effectively implemented to estimate parameters of water, MLP is capable of modeling a sequencing batch reactor that will treat municipal wastewater. The comparison of different models showed their applicability in predictive modeling of river flow and wastewater treatment.
References
Ahmed AAM (2017) Prediction of dissolved oxygen in Surma River by biochemical oxygen demand and chemical oxygen demand using the artificial neural networks (ANNs). J King Saud Univ Eng Sci 29:151–158. https://doi.org/10.1016/j.jksues.2014.05.001
Ahmed U, Mumtaz R, Anwar H, Shah AA, Irfan R, García-Nieto J (2019) Efficient water quality prediction using supervised machine learning. Water 11:2210
APHA (1992) Standard methods for the examination of water and wastewater, 18th edn. American Public Health Association, Washington, DC
Azad S (2020) For 1st time in decades, tests show Ganga water in Haridwar fit to drink
Bansal S, Ganesan G (2019) Advanced evaluation methodology for water quality assessment using artificial neural network approach. Water Resour Manag 33:3127–3141
Bhargava DS (1986) DO sag model for extremely fast river purification. J Environ Eng 112:572–585
Brooks W, Corsi S, Fienen M, Carvin R (2016) Predicting recreational water quality advisories: a comparison of statistical methods. Environ Model Softw 76:81–94
Chakraborty SK (2021) River pollution and perturbation: perspectives and processes. In: Chakraborty SK (ed) Riverine ecology, vol 2. Springer, Berlin, pp 443–530
Chakraborty I, Maity P (2020) COVID-19 outbreak: migration, effects on society, global environment and prevention. Sci Total Environ 728:138882
Chaturvedi MC (2012) Ganga–Brahmaputra–Meghna waters: advances in development and management. CRC Press
Cordoba GC, Tuhovčák L, Tauš M (2014) Using artificial neural network models to assess water quality in water distribution networks. Procedia Eng 70:399–408
Das B, Chakrabarty D (2016) Newton’s divided difference interpolation formula: representation of numerical data by a polynomial curve. Int J Math Trend Technol 35:26–32
Deaven DM, Ho K-M (1995) Molecular geometry optimization with a genetic algorithm. Phys Rev Lett 75:288
Dey S, Choudhary S, Dey S, Deshpande K, Kelkar N (2019) Identifying potential causes of fish declines through local ecological knowledge of fishers in the Ganga River, eastern Bihar, India. Fish Manag Ecol 27:140–154. https://doi.org/10.1111/fme.12390
Dhar I, Biswas S, Mitra A, Pramanick P, Mitra A (2020) COVID-19 Lockdown phase: a boon for the River Ganga water quality along the city of Kolkata. NUJS J Regul Stud Spec 53–57
DigvijayKumar TABAS (2017) D.O. modelling and water quality analysis of river Brahmaputra in Guwahati, Assam. J Civ Eng Environ Technol 4:64–67
Drew G (2017) River dialogues: Hindu faith and the political ecology of dams on the sacred Ganga. University of Arizona Press, Tucson
Dutta V, Dubey D, Kumar S (2020) Cleaning the River Ganga: impact of lockdown on water quality and future implications on river rejuvenation strategies. Sci Total Environ 743:140756
Duttagupta S et al (2021) Impact of Covid-19 lockdown on availability of drinking water in the arsenic-affected Ganges River Basin. Int J Environ Res Public Health 18:2832
El-Shafie A, Mukhlisin M, Najah AA, Taha MR (2011) Performance of artificial neural network and regression techniques for rainfall-runoff prediction. Int J Phys Sci 6:1997–2003
Emamgholizadeh S, Kashi H, Marofpoor I, Zalaghi E (2014) Prediction of water quality parameters of Karoon River (Iran) by artificial intelligence-based models. Int J Environ Sci Technol 11:645–656
Falkenauer E, Bouffouix S (1991) A genetic algorithm for job shop. In: ICRA. Citeseer, pp 824–829
Gardner MW, Dorling S (1998) Artificial neural networks (the multilayer perceptron)—a review of applications in the atmospheric sciences. Atmos Environ 32:2627–2636
Garg V, Aggarwal SP, Chauhan P (2020) Changes in turbidity along Ganga River using Sentinel-2 satellite data during lockdown associated with COVID-19 Geomatics. Nat Hazards Risk 11:1175–1195. https://doi.org/10.1080/19475705.2020.1782482
Goldberg DE (2006) Genetic algorithms. Pearson Education India, Delhi
Goldberg DE, Kuo CH (1987) Genetic algorithms in pipeline optimization. J Comput Civ Eng 1:128–141
Gomolka Z, Twarog B, Zeslawska E, Lewicki A, Kwater T (2018) Using artificial neural networks to solve the problem represented by BOD and DO indicators. Water 10:4
Gupta R, Singh A, Singhal A (2019) Application of ANN for water quality index. Int J Mach Learn Comput 9:688–693
Haider Naqvi SK (2020) Lockdown does what decades of schemes couldn’t: clean Ganga, Published on 4 April 2020 in Hindustan Times
Harpham C, Dawson CW, Brown MR (2004) A review of genetic algorithms applied to training radial basis function networks. Neural Comput Appl 13:193–201
Hasnain M, Pasha MF, Ghani I (2020) Combined measures to control the COVID-19 pandemic in Wuhan Hubei, China: a narrative review. J Biosaf Biosecur 2:51–57
Holland JH (1992) Adaptation in natural and artificial systems: an introductory analysis with applications to biology, control, and artificial intelligence. MIT Press, Cambridge
Jha R, Ojha C, Bhatia K (2007) Critical appraisal of BOD and DO models applied to a highly polluted river in India. Hydrol Sci J 52:362–375
Jiang M, Jiang S, Zhu L, Wang Y, Huang W, Zhang H (2013) Study on parameter optimization for support vector regression in solving the inverse ECG problem. Comput Math Methods Med 2013:158056. https://doi.org/10.1155/2013/158056
Kaushik N, Tyagi B, Jayaraman G (2012) Modeling of the dissolved oxygen in a river with storage zone on the banks. Appl Math 3:699–704
Krishnakumar K, Goldberg DE (1992) Control system optimization using genetic algorithms. J Guid Control Dyn 15:735–740. https://doi.org/10.2514/3.20898
Liu S, Tai H, Ding Q, Li D, Xu L, Wei Y (2013) A hybrid approach of support vector regression with genetic algorithm optimization for aquaculture water quality prediction. Math Comput Model 58:458–465
Lockwood AH (2016) Heat advisory: Protecting health on a warming planet. MIT Press, Cambridge
Muduli P et al (2021) Water quality assessment of the Ganges River during COVID-19 lockdown. Int J Environ Sci Technol 18:1645–1652
Mukherjee P, Pramanick P, Zaman S, Mitra A (2020) Eco-restoration of River Ganga water quality during COVID-19 lockdown period using Total Coliform (TC) as proxy. NUJS J Regul Stud Spec 69–74
Najah A, El-Shafie A, Karim O, El-Shafie AH (2013) Application of artificial neural networks for water quality prediction. Neural Comput Appl 22:187–201
Nakano R, Yamada T (1991) Conventional genetic algorithm for job shop problems. In: ICGA, pp 474–479
Ostertagová E (2012) Modelling using polynomial regression. Procedia Eng 48:500–506
Paul D (2017) Research on heavy metal pollution of river Ganga: a review. Ann Agrar Sci 15:278–286. https://doi.org/10.1016/j.aasci.2017.04.001
Paul A, Chatterjee S, Bairagi N (2020) Prediction on Covid-19 epidemic for different countries: focusing on South Asia under various precautionary measures. Medrxiv 395:689
Postel S, Richter B (2012) Rivers for life: managing water for people and nature. Island Press, Washington
Roy MB, Ghosh M, Roy PK (2021) Assessment of water quality of river ganga during covid-19 lockdown. Desalination Water Treat 223:26–33
Sarkar A, Pandey P (2015) River water quality modelling using artificial neural network technique. Aquat Procedia 4:1070–1077. https://doi.org/10.1016/j.aqpro.2015.02.135
Sati VP (2021) Ganges. Springer, Berlin
Shakeri Abdolmaleki A, Gholamalizadeh Ahangar A, Soltani J (2013) Artificial neural network (ANN) approach for predicting Cu concentration in drinking water of Chahnimeh1 reservoir in Sistan-Balochistan, Iran. Health Scope 2:31–38. https://doi.org/10.17795/jhealthscope-9828
Shamseldin A (2010) Artificial neural network model for river flow forecasting in a developing country. J Hydroinform 12:22–35. https://doi.org/10.2166/hydro.2010.027
Singh K, Jha R (2021) Critical appraisal of water quality model parameters for an urban city in lower Ganga basin during pre-and post-COVID19 Lockdown in India. Indian J Sci Technol 14:2439–2447
Singh K, Basant A, Malik A, Jain G (2009) Artificial neural network modeling of the river water quality—a case study. Ecol Model 220:888–895. https://doi.org/10.1016/j.ecolmodel.2009.01.004
Singh B (2020) Lockdown gift: gleaming Ganga lays new conservation roadmap. Times of India. https://m.timesofindia.com/city/varanasi/lockdown-gift-gleaming-ganga-lays-new-conservation-roadmap/amp_articleshow/75571128.cms. Accessed 06/05/2020
Smola AJ, Schölkopf B (2004) A tutorial on support vector regression. Stat Comput 14:199–222
Srinivas R, Singh AP, Shankar D (2020) Understanding the threats and challenges concerning Ganges River basin for effective policy recommendations towards sustainable development. Environ Dev Sustain 22:3655–3690
Srivastava NSaS (2020) Lockdown impact: Ganga water in Haridwar becomes 'fit to drink' after decades. India Today
Thomann RV, Mueller JA (1987) Principles of surface water quality modeling and control. Harper & Row Publishers, New York
Thomas H (1948) The pollution load capacity of streams, Water and sewage works GICAL survey Fohn Knox Rd-Suite F 240
Tibshirani R (1996) Regression shrinkage and selection via the Lasso. J R Stat Soc: Ser B (Methodol) 58:267–288
Trivedi R (2010) Water quality of the Ganga River—an overview. Aquat Ecosyst Health Manag 13:347–351. https://doi.org/10.1080/14634988.2010.528740
Vapnik V, Golowich SE, Smola AJ (1997) Support vector method for function approximation, regression estimation and signal processing. In: Advances in neural information processing systems, pp 281–287
Vapnik V, Vapnik V (1998) Statistical learning theory, vol 1. Wiley, New York, p 624
Wang X, Fu L, He C (2011) Applying support vector regression to water quality modelling by remote sensing data. Int J Remote Sens 32:8615–8627
Webdesk N (2020) Rivers heal during lockdown. National Herald India. https://www.nationalheraldindia.com/videos/rivers-heal-during-lockdown
Wray M ( 2020) Coronavirus lockdown eases pollution, Venice canal runs clear. Globalnews. https://globalnews.ca/news/6683226/climate-change-coronavirus/. Accessed 16/03/2020
Yang J, Honavar V (1998) Feature subset selection using a genetic algorithm. In: Liu H, Motoda H (eds) Feature extraction, construction and selection. Springer, Berlin, pp 117–136
Acknowledgements
The authors are thankful to the School of Biochemical Engineering, IIT (BHU) Varanasi, Varanasi for financial and technical support of the present research work.
Funding
The authors did not receive support from any organization for the submitted work.
Author information
Authors and Affiliations
Contributions
All authors contributed to the study conception and design. Material preparation, data collection and analysis were performed by JS, SS and PS. The final draft of the manuscript was reviewed by VM. All authors read and approved the final manuscript.
Corresponding author
Ethics declarations
Conflict of interest
The authors have no conflicts of interest to declare that are relevant to the content of this article.
Additional information
Editorial responsibility: Samareh Mirkia.
Supplementary Information
Below is the link to the electronic supplementary material.
Rights and permissions
About this article

Cite this article
Singh, J., Swaroop, S., Sharma, P. et al. Real-time assessment of the Ganga river during pandemic COVID-19 and predictive data modeling by machine learning. Int. J. Environ. Sci. Technol. 20, 7887–7910 (2023). https://doi.org/10.1007/s13762-022-04423-1
Received:
Revised:
Accepted:
Published:
Issue Date:
DOI: https://doi.org/10.1007/s13762-022-04423-1