
Abstract
Fabry disease is an X-linked, complex, multisystemic lysosomal storage disorder presenting marked phenotypic and genotypic variability among affected male and female patients. Glycosphingolipids, mainly globotriaosylceramide (Gb3) isoforms/analogs, globotriaosylsphingosine (lyso-Gb3) and analogs, as well as galabiosylceramide (Ga2) isoforms/analogs accumulate in the vascular endothelium, nerves, cardiomyocytes, renal glomerular and tubular epithelial cells, and biological fluids. The search for biomarkers reflecting disease severity and progression is still on-going. A metabolomic study using quadrupole time-of-flight mass spectrometry has revealed 22 galabiosylceramide isoforms/analogs in urine of untreated Fabry patients classified in seven groups according to their chemical structure: (1) Saturated fatty acid; (2) one extra double bond; (3) two extra double bonds; (4) hydroxylated saturated fatty acid; (5) hydroxylated fatty acid and one extra double bond; (6) hydrated sphingosine and hydroxylated fatty acid; (7) methylated amide linkage. Relative quantification of both Ga2 and Gb3 isoforms/analogs was performed. All these biomarkers are significantly more abundant in urine samples from untreated Fabry males compared with healthy male controls. A significant amount of Ga2 isoforms/analogs, accounting for 18% of all glycosphingolipids analyzed (Ga2 + Gb3 and respective isoforms/analogs), were present in urine of Fabry patients. Gb3 isoforms containing saturated fatty acids are the most abundant (60.9%) compared with 26.3% for Ga2. A comparison between Ga2 isoforms/analogs and their Gb3 counterparts also showed that the proportion of analogs with hydroxylated fatty acids is significantly greater for Ga2 (35.8%) compared with Gb3 (1.9%). These results suggest different biological pathways involved in the synthesis and/or degradation of Gb3 and Ga2 metabolites.

ᅟ
Introduction
Metabolomic studies using time-of-flight mass spectrometry have become important means to discover novel biomarkers in human diseases and, in particular, to elucidate the associated biochemical abnormalities [1–5]. In the biomedical field, it offers the possibility to evaluate small metabolites (1500 Da and less) in biological fluids, tissue extracts, or cells of patients compared with gender- and age-matched healthy controls. Changes in small molecules often reflect a modified biochemical pathway and may provide insight into the pathophysiology of a specific disease. As reported by Lewis et al., “small biochemicals are the end result of all the regulatory complexity present in the cell, tissue, or organism, including transcriptional regulation, translational regulation, and post-translational modification” [4]. Moreover, emerging mass spectrometry technologies, offering high resolution and specificity, coupled to powerful softwares, efficient data-processing [6], and extensive data banks, provide reliable interpretation of complex metabolomic results and elucidation of chemical structures.
Lysosomal storage disorders (LSDs) are a group of more than 70 genetic diseases showing marked genotypic and phenotypic variability [7, 8]. LSDs involving glycosphingolipids (GSL) have been the subject of a recent review emphasizing the importance of understanding the cellular processes underlying the metabolism of these disorders [9]. Fabry disease (OMIM no. 301500) is a complex multi-systemic LSD caused by the deficiency of alpha-galactosidase A (α-GAL or GLA; EC 3.2.1.22), which leads to GSL accumulation, mainly globotriaosylceramide (Gb3) isoforms/analogs, globotriaosylsphingosine (lyso-Gb3) and related analogs, as well as galabiosylceramide (Ga2) isoforms/analogs (See Figure 1) in different organs and biological fluids of affected patients [10]. Fabry disease is an X-linked disorder predominantly affecting males, though females are also affected and sometimes as severely as men [11]. Recent metabolomic studies have underscored the importance of detecting biomarkers which may reflect disease severity and progression, and which might explain the heterogeneity found between patients, even those having the same Fabry mutation [12–15]. Several quantitative tandem mass spectrometry methods have been developed to evaluate concentrations of these biomarkers in urine and plasma [16–20]. These studies show a complex biomarker profile encountered in Fabry patients, which varies according to gender, types of mutations, and treatment of patients.

Chemical structures of (a) globotriaosylceramide (Gb3); (b): globotriaosylsphingosine (lyso-Gb3); (c) Galabiosylceramide (Ga2); (d) Lactosylceramide. Gal = galactose; Glu = glucose
Galabiosylceramide, also known as digalactosylceramide or cerebrodihexoside (CDH), is a glycosphingolipid comprised of two galactose units linked to a ceramide moiety (Figure 1c). It is a component of cellular membranes and is found in large concentration in biological fluids of Fabry patients [21–23]. Mills et al. noted that CDHs, Ga2, and lactosylceramide (Figure 1c and d), have the same empirical formula and, therefore, cannot be differentiated by mass spectrometry analysis [21]. Nevertheless, Fabry patients who have a deficiency of α-GAL, the enzyme responsible for the Ga2 catabolism, are expected to show increased urinary Ga2 concentrations compared with controls [21, 22].
We undertook this metabolomic study to identify and evaluate Ga2-related Fabry disease potential biomarkers using time-of-flight mass spectrometry. A second objective was to relatively quantify these biomarkers and to compare abundances with their related Gb3 isoform/analog counterparts. Finally, we wanted to evaluate the significance of these biomarkers for Fabry disease patients compared to controls.
Experimental
Ethics Approval
This project was approved by the Research Ethics Board (REB) of the Faculty of Medicine and Health Sciences and the Centre hospitalier universitaire de Sherbrooke (CHUS), and the REBs of all clinician collaborators.
Urine Sample Collection and Creatinine Analysis
Random urine samples were collected after informed consent was obtained from 16 untreated Fabry males (age range from 1 to 45 years; mean 20 years) and 16 healthy male controls (age range from 3 to 57 years, mean 21 years). The diagnosis of Fabry disease was confirmed by enzyme activity measurement in leucocytes or by mutation analysis. Fabry patients who were part of this study had not received enzyme replacement therapy (ERT) treatment before the specimen collection. For both groups, fresh random urine specimens were stored at –20°C until analysis. Urine samples were not centrifuged or filtered since Ga2 and Gb3 are only slightly soluble in water, and are integral components of urinary sediments.
Only samples from untreated male were collected because, in general, clinical manifestations of Fabry disease are more severe for male patients compared with females, and males tend to excrete larger levels of biomarkers and are more appropriate for biomarker discovery. Moreover, ERT decreases the excretion of Fabry disease biomarkers in biological fluids [16–19]. As described previously, creatinine levels were measured in all urine specimens by ultra-high performance liquid chromatography (UPLC) coupled to time-of-flight (TOF) mass spectrometry (MS) [12]. Ga2 and Gb3 biomarker normalization was done by dividing the area values by the creatinine levels, the latter being expressed in mM. Age, creatinine concentrations, and mutations (for Fabry patients) are listed in Supplementary Table S-1, as well as for healthy controls.
Nomenclature
Ga 2 or Gb 3 Isoforms: Ga2 or Gb3 with different fatty acid chains coupled by amide linkage to an unmodified sphingosine moiety. The principle sphingosine species is described as d18:1, with a total of 18 carbon atoms and a single double bond (Figure 1).
Ga 2 or Gb 3 Analogs: Ga2 or Gb3 with modified sphingosine moieties.
We expressed the chemical structure of Ga2 and Gb3 isoforms and analogs in the following way:
Where: A = Ga2 or Gb3
d = referring to the sphingosine group
u = number of carbons in the sphingosine moiety
v = number of double bond(s) in the sphingosine moiety
w = modification on the sphingosine chain (hydroxylated, OH)
C = referring to the fatty acid group
x = number of carbon atoms in the fatty acid moiety
y = number of carbon-carbon double bond(s) in the fatty acid moiety
z = modifications of the fatty acid (hydroxylated, OH)
M = modification on the nitrogen of the amide linkage (methylated, Me)
Reagents
HPLC grade methanol (MeOH) and OmniSolv grade chloroform (CHCl3) were from EMD Chemicals Inc. (Darmstadt, Germany). Formic acid (FA) (+99%) was from Acros Organics (Morris Plains, NJ, USA). Optima LC/MS grade water, ACS Reagent grade glacial acetic acid, ammonium formate (Amm. Form.) (99%), and A.C.S. potassium hydroxide (KOH) pellets were from Fisher Scientific (Fair Lawn, NJ, USA). Terfenadine was from Sigma-Aldrich (Saint-Louis, MO, USA). Heptadecanoyl ceramide trihexoside (Gb3[(d18:1)(C17:0)]) (98 + %) was purchased from Matreya, (Pleasant Gap, PA, USA).
Sample Preparation
Urine samples were processed by liquid–liquid extraction using a method adapted from Sullards et al. [24]. Briefly, 500 μL of well-mixed urine specimens from untreated Fabry males or healthy male controls were transferred in glass culture tubes and dried under a nitrogen stream. Samples were resuspended in 4.5 mL of MeOH:CHCl3 (2:1), vortexed 30 s, sonicated 30 s, and incubated 15 h at 48°C. Thereafter, to hydrolyze triglycerides and other unwanted species, 150 μL of KOH 1 M in methanol were added to each sample. After 2 h of incubation at 37°C, excess KOH was neutralized with 18 μL of glacial acetic acid, and 2 mL of CHCl3 and 4 mL of water were added. Samples were then vortexed for 30 s, sonicated for 30 s, and centrifuged 5 min at 5000 RPM to generate two liquid phases. The lower organic chloroform phase was collected with a glass pipette and transferred to a new test tube. Subsequently, a second extraction was performed by adding 2 mL of CHCl3. After, vortexing, sonication, and centrifugation, the organic phase was collected a second time and the combined organic phases were evaporated to dryness with a nitrogen stream. The residues were resuspended in 200 μL of MeOH/Amm.Form. 5 mM/FA 0.1% and transferred in 2 mL vials containing glass inserts. Samples from Fabry patients and healthy controls were prepared and analyzed randomly to prevent discrimination between the two groups due to the processing of samples or to their position in the sample list.
For structural elucidation of the Ga2-related Fabry disease biomarkers, 5 mL of urine from an untreated Fabry male was prepared according to the previously described procedure to obtain a sample 10-fold more concentrated.
Instrumentation and Parameters
The metabolomic study was performed with an Acquity UPLC system coupled to a Synapt QTof mass spectrometer, both from Waters Corp. (Milford, MA, USA). For the chromatography, an Acquity UPLC BEH C8 column (50 mm × 2.1 mm, 1.7 μm particle diameter) (Waters) was used at a flow rate of 0.5 mL/min and at an operating temperature of 30°C. Mobile phase A was MeOH/Amm. Form. 5 mM/FA 0.1%, whereas mobile phase B was H2O/MeOH 5%/Amm. Form. 5 mM/FA 0.1%. The gradient corresponded to 50% phase A for 1 min; 50% → 80% phase A in 5 min (linear); 80% → 100% phase A in 6 min (linear); 100% phase A for 3 min; and 50% phase A for 5 min, for an overall chromatographic run of 20 min. The “weak” and “strong” needle wash solutions were 50% Phase A/50% Phase B, and MeOH/FA 0.1%, respectively. The “partial loop overfill” mode was used to inject 7 μL of each sample, and the autosampler temperature was set to 15°C.
The mass spectrometer was operated in positive electrospray (ESI+) mode. The following parameters were used for the mass spectrometer: analyzer mode: V; dynamic range: extended; capillary voltage: 3.2 kV; sampling and extraction cone voltages: 20 and 5.0 V; source and desolvation temperatures: 120 and 450°C; trap and transfer collision energies: 6.0 and 4.0 V; data format: centroid; and scan time: 0.1 s. The acquisition mass range was 50–1300 Da in order to be able to quantify the Ga2 isoforms/analogs (820–1020 Da) and the Gb3 isoforms/analogs (1000–1200 Da) in the same data set. To increase the mass accuracy throughout the metabolomic run, the electrospray ionization (ESI) interface of the mass spectrometer was equipped with a “lock mass” probe connected to an isocratic pump model 515 (Waters) infusing a standard solution of terfenadine (500 nM, ACN 5%, FA 0.2%) for real time recalibration. The m/z value used as the lock mass for terfenadine was 472.3215 Da. The flow rate of the isocratic pump was 0.50 mL/min, but a “T” splitter was added before the entrance of the “lock mass” probe to decrease the flow rate to ~20 μL/min. The following parameters were used for the “lock mass” probe: scan time: 0.5 s, intervals: 5 s; sampling cone voltage: 2.0 V; trap collision energy: 6.0 V; mass window: ±0.2 Da; and scan average: 3.
Data Mining and Multivariate Data Analysis
The UPLC-ESI-TOF-MS raw data obtained during the metabolomic study were processed by MarkerLynx XS (Waters). This data mining software aligned the metabolites detected in the samples according to their exact mass and retention time, and also integrated the peak areas. For this process, a mass range of 820–1020 Da was chosen to target isoforms and analogs of Ga2. The intensity threshold was five counts, the mass window was 0.05 Da, and the retention time window was 0.20 min. The results treated with MarkerLynx XS were downloaded in EZinfo, a software of Umetrics (Umeå, Sweden) integrated to the Extended Statistics Tools Box of MassLynx v4.1 (Waters), for multivariate analysis. The supervised orthogonal partial least-square-discriminant analysis (OPLS-DA) was employed to discriminate the untreated Fabry males from the healthy male controls. The Pareto scaling (Equation (1)) was chosen to up weight medium intensity metabolites without inflating baseline noise.
x = area of the metabolite
y = mean area of the metabolite
SD = standard deviation of the areas of the metabolite
All the variables were logarithmically transformed (Equation (2)).
x = area of the metabolite
C2 = constant
The C2 constant was automatically determined by the software.
An S-plot was generated to highlight the metabolites contributing the most to discriminate the two sample groups in the OPLS-DA score plot. The more a metabolite contributes to distinguishing the two sample groups, the better it is as a Fabry disease biomarker candidate.
Structural Characterization of Fabry Disease Biomarkers
Tandem mass spectrometry experiments were performed on the UPLC-ESI-QTof-MS system to elucidate or validate the structure of the Fabry disease biomarkers highlighted by the multivariate data analysis. For most of the biomarkers, the samples prepared for the metabolomic run were not sufficiently concentrated to get detailed fragmentation spectra. For this reason, a 10-fold more concentrated urine sample from an untreated Fabry male was prepared for the tandem mass spectrometry experiments. The UPLC and MS parameters were the same as for the metabolomic run except that the MS mode was QTof-MS (quadrupole time-of-flight) instead of Tof-MS, and collision energy ramps were applied to the trap.
Relative Quantification of Fabry Disease Biomarkers
The relative abundances of the Ga2-related biomarkers revealed by the multivariate data analysis and their Gb3-related counterparts were evaluated by measuring their peak areas in the UPLC-Tof-MS chromatograms generated during the metabolomic run for all urine specimens (16 untreated Fabry males and 16 healthy male controls). The integration was performed with the QuanLynx software (Waters) using the Apex track algorithm.
Results and Discussion
UPLC-ESI-Tof-MS Analysis of Urinary Metabolites
Figure 2 shows an example of total ion chromatogram (TIC) obtained during the metabolomic study of an untreated Fabry male with different mass ranges. The Gb3 isoforms/analogs were found in the mass range 1000–1200 Da (Figure 2a), whereas the Ga2 isoforms/analogs were in the mass range 820–1020 Da (Figure 2b). Figure 2c presents the total mass range acquired (50–1300 Da). The peaks corresponding to some of the most abundant Gb3 and Ga2 isoforms/analogs are annotated on the chromatograms. The reproducibility for the retention times as well as for m/z ratios throughout the study were evaluated for a panel of metabolites present in all the samples (Fabry patients and controls). For each of these metabolites, the retention times and m/z ratio windows were, respectively, lower than 0.20 min and 0.05 Da. These parameters were used for the programming of data mining.

Total ion chromatogram (TIC) of a urine sample from an untreated Fabry male (missense classical mutation A143P, creatinine 13.09 mM). (a) Mass range corresponding to Gb3 isoforms/analogs (1000–1200 Da); (b) mass range corresponding to Ga2 isoforms/analogs (820–1020 Da); and (c) whole mass range acquired (50–1300 Da). Peaks corresponding to some of the most abundant Gb3 and Ga2 isoforms/analogs are annotated on the chromatograms
Data Mining and Multivariate Data Analysis
A total of 15,320 markers were aligned in the 32 samples analyzed, for the mass range corresponding to Ga2 isoforms/analogs (820–1020 Da), using MarkerLynx. These markers correspond to the chromatographic peaks detected in at least three samples according to the data mining parameters described earlier. Figure 3a presents the OPLS-DA score plot obtained from this dataset. Each point corresponds to a different sample. The two sample groups consisting of healthy male controls on the left side (n = 16) and untreated Fabry males on the right side (n = 16) are completely discriminated, indicating that some markers are efficiently differentiating the two groups. To find these Fabry disease biomarkers, a S-Plot (Figure 3b) was generated and each point corresponds to a different marker aligned by MarkerLynx. The S-Plot classifies markers according to their magnitude and reliability. The more the marker was at the top right of the S-plot, the more it was present in Fabry samples and absent in control samples, and more it is reliable and efficient to better separate the two sample groups in the OPLS-DA score plot. The markers at the top right of the S-plot, labeled with numbers from 1 to 19, were identified as Ga2 isoforms/analogs and their structure was elucidated using a tandem mass spectrometry approach. The markers corresponding to metal adducts (Na+, and K+), and to in-source fragments (–H2O) were excluded.

(a) OPLS-DA score plot derived from the UPLC-ESI-Tof-MS metabolomic analysis of urine samples from untreated Fabry males (n = 16) and healthy male controls (n = 16). The ellipse corresponds to the Hoteling T2 range with a significance level of P = 0.05. (b) S-Plot showing the correlation in function of the covariance of the metabolites used to discriminate the two sample groups in the OPLS-DA score plot. Fabry disease biomarkers, identified by tandem mass spectrometry, are annotated with numbers from 1 to 19. The multivariate data analysis was performed using the Pareto scaling and the logarithmic transformation
Structural Elucidation of Targeted Fabry Disease Biomarkers
The chemical structures of all 19 Ga2 isoforms/analogs pointed out as potential Fabry disease biomarkers during the principal component analysis were elucidated by tandem mass spectrometry using a 10-fold more concentrated urine sample from an untreated Fabry male patient. The molecular ion of each marker was isolated in the quadrupole of the mass spectrometer, fragmented by collision induced dissociation (CID) in the collision cell, and the fragments were analyzed with high-mass accuracy using the time-of-flight mass analyzer. Figure 4 presents examples of fragmentation spectra for the seven different groups of Ga2 isoforms/analogs identified.

(a) MS/MS fragmentation spectrum of Ga2(d18:1)(C24:0); annotations A to J correspond to the structures presented in the fragmentation mechanism of Scheme 1; (b) to (g) present the part of the fragmentation spectrum corresponding to the sphingosine and fatty acid fragments for selected Ga2 isoforms/analogs. When two structural isomers were fragmented together, the peaks corresponding to the first isomer were annotated in blue (B) and the peaks corresponding to the second isomers were annotated in purple and italics (P); (b) Ga2[(d18:1)(C24:1)] (B) and Ga2[(d18:2)(C24:0)] (P) structural isomers; (c) Ga2[(d18:2)(C24:1)] (B) and Ga2[(d18:1)(C24:2)] (P) structural isomers; (d) Ga2[(d18:1)(C24:0)OH]; (e) Ga2[(d18:1)(C24:1)OH] (B) and Ga2[(d18:2)(C24:0)OH] (P) structural isomers; (f) Ga2[(d18:0)OH(C24:0)OH]; and (g) Ga2[(d18:1)OH(C22:0)OH]Me. Collision energy ramp: 20–40 V for (a), (b), (c), (f); 15–40 V for (d); 20–45 V for (e), and 15–40 V for (g)
-
1.
Ga2 isoforms with saturated fatty acid
Ga2 isoforms with saturated fatty acids from C16:0 to C24:0 were detected on the S-Plot (Figure 3b, markers 2, 3, 8, 16, and 19). Figure 4a presents the fragmentation spectrum of Ga2[(d18:1)(C24:0)]. The proposed fragmentation mechanism for peaks A to J is presented in Scheme 1. For each fragment, the mass difference (ppm) between the measured mass and the proposed structure is presented in brackets. Peaks A, C, and E correspond, respectively, to the molecular ion, the loss of one sugar unit (Gal), and the loss of the two sugar units (Gal, Gal). A loss of a water molecule on the sphingosine moiety was also observed on fragments A, C, and E to generate fragments B, D, and F. The loss of a second water molecule from the dehydrated ceramide (peak F) generates peak G. The deacylation of the dehydrated ceramide (peak F) generated two fragments: the fatty acid on its amide form [(C24:0) – OH + NH2]H+ (peak H) and the dehydrated sphingosine [(d18:1) – H2O]H+ (peak I). The latter undergoes a second dehydration to generate [(d18:1) – 2H2O]H+ (peak J). All Ga2 isoforms/analogs detected in this metabolomic study have similar fragmentation patterns and can be distinguished by their sphingosine and fatty acid fragments. Therefore, only the portion of the fragmentation spectra corresponding to these fragments is presented in Figure 4b–g for the other Ga2 isoforms/analogs.
Scheme 1 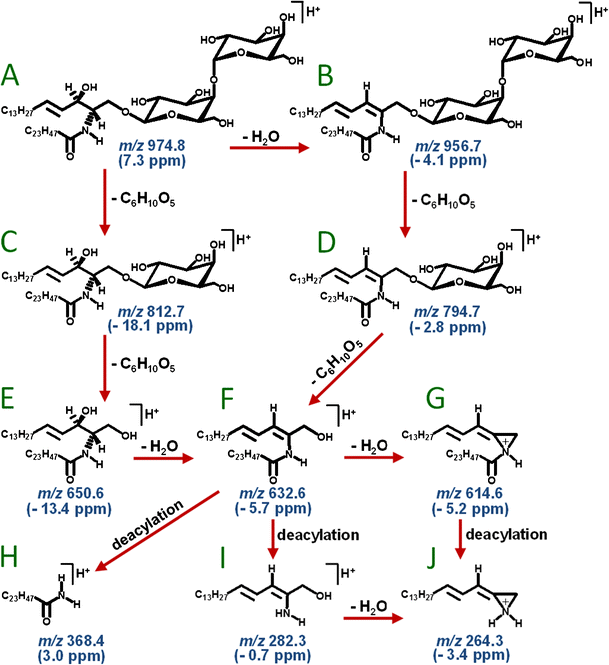
Proposed MS/MS fragmentation mechanism for Ga2[(d18:1)(C24:0)]. The mass difference (delta mass, in ppm) between the fragment detected and the structure proposed is presented in brackets
-
2.
Ga2 isoforms/analogs with one extra double bond
Three isoforms/analogs of Ga2 with one extra double bond were revealed by the S-Plot, the ones with 18 (Figure 3b, marker 17), 22 (Figure 3b, marker 9), and 24 (Figure 3b, marker 6) carbons on their fatty acid chains. Figure 4b shows the fragmentation spectrum corresponding to the fatty acid and the sphingosine moieties of the Ga2 molecule with 24 carbons on the fatty acid and an extra double bond. In reality, this latter biomarker is a mixture of two co-eluting structural isomers: one with the extra double bond on the fatty acid chain (Ga2[(d18:1)(C24:1)]) and the other with the extra double bond on the sphingosine (Ga2[(d18:2)(C24:0)]). Similar structural isomer mixtures were previously observed for Gb3 isoforms/analogs in urine and plasma of Fabry patients [13, 14]. In Figure 4b, the fragments related to (Ga2[(d18:1)(C24:1)]) are annotated in blue (B) and the fragments corresponding to (Ga2[(d18:2)(C24:0)]) are annotated in purple and italics (P).
-
3.
Ga2 isoform/analog with two extra double bonds
The S-plot also revealed a Fabry disease biomarker (Figure 3b, marker 7) corresponding to the co-eluting mixture of the Ga2 isoform Ga2[(d18:1)(C24:2)] and of the Ga2 analog Ga2[(d18:2)(C24:1)]. In Figure 4c, the peaks corresponding to Ga2[(d18:2)(C24:1)] are annotated in blue (B) and the peak corresponding to Ga2[(d18:1)(C24:2)] is annotated in purple and italics (P). Unfortunately, the sensitivity was not sufficient to detect the fragment corresponding to the fatty acid [(C24:2) – OH + NH2]H+ of Ga2[(d18:1)(C24:2)]. Mixtures of isoforms/analogs with two extra double bonds were also previously observed for Gb3 in urine and in plasma of Fabry patients [13, 14].
-
4.
Ga2 isoforms with hydroxylated fatty acid
Three Ga2 isoforms (C20:0 to C24:0) presented a hydroxylated fatty acid chain (Figure 3b, markers 1, 4, and 10). Figure 4d shows the fragments related to the fatty acid and the sphingosine moieties of Ga2[(d18:1)(C24:0)OH]. The presence of the hydroxylation on the (C24:0)OH fatty acid is confirmed by the loss of a water molecule from its amide fragment [(C24:0)OH – OH + NH2]H+ generating the peak at m/z 366.4 corresponding to [(C24:0)OH – OH + NH2 – H2O]H+.
-
5.
Ga2 isoforms/analogs with hydroxylated fatty acid and one extra double bond
The S-plot revealed three Ga2 isoforms/analogs with an extra double bond and a hydroxylated fatty acid. These molecules had 20 (Figure 3b, marker 18), 22 (Figure 3b, marker 14), and 24 (Figure 3b, marker 12) carbons on their fatty acid chain. Similar to group 2, biomarkers of group 5 are, in fact, a mixture of two co-eluting structural isomers: one with the extra double bond on the sphingosine and the second with the extra double bond on the fatty acid. Figure 4e presents the fragments of the mixture of isomers [(d18:1)(C24:1)OH] + [(d18:2)(C24:0)OH]. The fragments related to [(d18:1)(C24:1)OH] are annotated in blue (B), and the fragments related to [(d18:2)(C24:0)OH] are annotated in purple and italics (P). The presence of the hydroxylation on the fatty acid chain is confirmed by the loss of a water molecule on both fatty acid fragments (the saturated [(C24:0)OH – OH + NH2]H+ and the unsaturated [(C24:1)OH – OH + NH2]H+ to generate the fragments at m/z 366.4 and 364.4, respectively.
-
6.
Ga2 analog with hydrated sphingosine and hydroxylated fatty acid
A Ga2 analog with a hydroxylated fatty acid and a hydrated sphingosine (Ga2[(d18:0)OH(C24:0)OH]) was pointed out by the S-plot (Figure 3b, marker 11). The hydration of the sphingosine moiety was revealed by the peak at m/z 300.3 corresponding to the fragment [(d18:0)OH – H2O]H+. The latter was not observed for Ga2 analogs/isoforms with the principle sphingosine (d18:1) such as in Figure 4a, b, d, e, and g. The fragment at m/z 384.4 corresponds to the hydroxylated fatty acid fragment [(C24:0)OH – OH + NH2]H+.
-
7.
Ga2 analogs with methylated amide linkage
The S-Plot revealed two methylated Ga2 analogs: Ga2[(d18:1)(C22:0)OH]Me and Ga2[(d18:1)(C22:0)]Me corresponding to markers 5 and 13 in Figure 3b. The methylation of the amide linkage joining the sphingosine and the fatty acid was previously observed and documented on Gb3 isoforms/analogs in urine and plasma of Fabry patients [13, 14]. The fragmentation profile observed for Ga2[(d18:1)(C22:0)]Me was similar to the one previously observed for Gb3[(d18:1)(C22:0)]Me, except that it presents the loss of two sugar units instead of three. The fragmentation spectrum and the detailed proposed fragmentation mechanism of Gb3[(d18:1)(C22:0)]Me are presented in reference [13]. The methyl group was observed on the sphingosine and the fatty acid fragments. Since the only common atom of these two fragments is the nitrogen of the amide linkage, the methyl group, we concluded that it must be located on that atom. Figure 4g shows the fragments related to the sphingosine and to the fatty acid of the Ga2[(d18:1)(C22:0)OH]Me analog. The fragment at m/z 370.4 corresponds to the methylated and hydroxylated fatty acid fragment [[(C22:0)OH]Me – OH + NH2]H+, whereas the one at m/z 278.3 corresponds to the twice dehydrated methylated sphingosine fragment [(d18:1)Me – 2H2O]H+. The latter lost its methyl group (–14 Da) to generate the fragment at m/z 264.3.
To confirm that the chemical modifications observed on the sphingosine moiety (hydration, double-bond addition), the fatty acid (hydroxylation, double-bond addition), or on the amide linkage (methylation) of Ga2 and Gb3 are not due to the sample preparation, a commercial Gb3[(d18:1)(C17:0)] standard was previously spiked, processed in urine [13] and plasma [14], and analyzed by mass spectrometry. No modification/degradation of the standard was observed following the processing.

Relative Quantification of Fabry Disease Biomarkers
Supplementary Table S-1 presents detailed results of the relative quantification of Fabry disease biomarkers for all Fabry patients (n = 16) and all healthy controls (n = 16), whereas, Table 1 summarizes these results. The relative abundances of the 19 Ga2 isoforms/analogs revealed by the S-Plot (Figure 3b) as Fabry disease biomarkers were obtained by integrating their peak areas in the UPLC-QTof-MS chromatograms acquired during the metabolomic run. These peak areas were normalized with the creatinine concentration for each sample. In addition to these 19 Ga2 biomarkers, the presence of three other Ga2 related Fabry disease biomarkers corresponding to isoforms of biomarkers not revealed by the S-Plot (Figure 3b) were also observed and quantified. These three low abundance biomarkers were, respectively, Ga2[d18:1)(C20:1)] + Ga2[(d18:2)(C20:0)], Ga2[d18:1)(C16:0)OH], and Ga2[d18:1)(C24:0)]Me, and are labelled with (*) in Table 1. Overall, the 22 Ga2-related Fabry disease biomarkers were separated in seven different groups: (1) saturated fatty acids; (2) one extra double bond; (3) two extra double bonds; (4) hydroxylated fatty acid; (5) hydroxylated fatty acid and one extra double bond; (6) hydrated sphingosine and hydroxylated fatty acid; and (7) methylated amide linkage. For comparison measures, the relative abundances of the Gb3 counterparts of the 22 Ga2-related Fabry disease biomarkers were also measured.
The retention times of the Ga2-related isoforms/analogs, on the C8 UPLC stationary phase, are in accordance with their hydrophobicity. The retention times thus increase with the number of carbons on the fatty acid chain, decrease with the addition of extra double bond(s), decrease with the addition of hydroxyl group(s), and increase with the methylation of the amide linkage, whereas the retention times of Gb3 isoforms/analogs are slightly lower (between 0.01 and 0.06 min) than the ones of their Ga2 counterparts because of the small decrease of hydrophobicity conferred by their supplementary sugar unit (the added glucose moiety). The retention time differences between Ga2 and Gb3 with the same ceramide moiety confirm that these Ga2 isoforms/analogs are not in-source fragments of Gb3 isoforms/analogs. The difference between the measured and the theoretical masses for all Ga2- and Gb3-related biomarkers were always lower than 15 ppm. Since the mass accuracy of the instrument was not sufficient to obtain a single empirical formula at such high molecular masses, each biomarker was analyzed by tandem mass spectrometry to confirm its identification. The abundances of all Ga2- and Gb3-related Fabry disease biomarkers were significantly higher in urine samples from untreated Fabry males compared with healthy male controls. There is no overlap between the untreated Fabry male patient group and the healthy male control group for six Ga2-related Fabry disease biomarkers (S-Plot ID: 1, 2, 6, 9, 19), indicating that these biomarkers may have a diagnostic potential.
Table 1 presents the ratios (%) between Ga2 isoforms/analogs and their Gb3 counterparts Ga2/Gb3. The values are indicated in lighter gray when one of the two biomarkers (Ga2 or Gb3) was not detected in all the samples because it can affect the ratio. For the biomarker groups 1, 2, 3, and 7, the abundance of the Ga2-related biomarkers was between 3% and 33% of the abundance of their Gb3 counterparts. However, for the biomarker presenting a hydroxylated fatty acid (Groups 4, 5, and 6) the Ga2/Gb3 ratios are significantly higher (between 72% and 575%). The maximum Ga2/Gb3 ratio (575%) was obtained for the hydroxylated C22:0 fatty acid. These large differences in Ga2/Gb3 ratios between the biomarker groups with and without hydroxylated fatty acid suggest that the Ga2- and Gb3-related molecules are involved in different biochemical pathways.
Figure 5 presents the relative distribution of the different isoform/analog groups for Ga2, Gb3, and the combination of both for untreated Fabry males. For Ga2, the biomarkers with hydroxylated fatty acid (Group 4) are the most abundant (35.8%) compared to Gb3 (1.9%). For Gb3, Group 1 (saturated fatty acid) represents the most abundant group (60.9%) compared with 26.3% for Ga2. Upon combination, Ga2 isoforms/analogs present a global sum of 18%, whereas the global sum for Gb3 isoforms/analogs is at 82%. These results thus show that the excretion of Ga2-related biomarkers in urine of Fabry patients is not negligible compared with the Gb3-related biomarkers.

Relative distribution in urine samples from untreated Fabry patients (n = 16) of (a): Ga2 isoforms/analogs; (b): Gb3 isoforms/analogs; (c): Both Ga2 and Gb3 isoforms/analogs. The isoforms/analogs were separated in seven groups as follows: Group 1 (Gr. 1), saturated fatty acids; Group 2 (Gr. 2), one extra double bond; Group 3 (Gr. 3), two extra double bonds; Group 4 (Gr. 4), hydroxylated fatty acid; Group 5 (Gr. 5), hydroxylated fatty acid and one extra double bond; Group 6 (Gr. 6), hydrated sphingosine and hydroxylated fatty acid; and Group 7 (Gr. 7), methylated amide linkage
Conclusion
A metabolomic approach was used to identify and study Ga2-related Fabry disease biomarkers. A total of 22 Ga2 isoforms/analogs were detected and quantified in Fabry patient urine samples. All these biomarkers were found to be significantly more abundant in urine samples from untreated Fabry males compared with healthy male controls. Ga2-related Fabry disease biomarkers were classified in seven different groups according to their chemical structures: (1) saturated fatty acid; (2) one extra double bond; (3) two extra double bonds; (4) hydroxylated fatty acid; (5) hydroxylated fatty acid with one extra double bond; (6) hydrated sphingosine and hydroxylated fatty acid; and (7) methylated amide linkage. To our knowledge, this is the first report of Ga2 analogs with an extra double bond (Groups 2 and 3) or a hydration (Group 6) on the sphingosine moiety, and a methylation of the amide linkage (Group 7). The extra double bond on the sphingosine and the methylation of the amide linkage were previously observed for Gb3 in urine [13] and in plasma [14] specimens from untreated Fabry males. Moreover, the hydration of the sphingosine was also detected on lyso-Gb3 in plasma from untreated Fabry males [15]. We previously formulated the hypothesis that the methylation of Gb3 might be an intermediate compound leading to the deacylation of Gb3 [13]. The same hypothesis may be formulated for methylated-Ga2.
Surprisingly, the proportion of analogs with hydroxylated fatty acids is significantly higher for Ga2 compared with Gb3. These results suggest different biochemical pathways involved in the synthesis and/or catabolism of these two glycosphingolipids. Future work will consist in the development and validation of a more sensitive multiple reaction monitoring (MRM) method to quantify Ga2 and Gb3 isoforms/analogs in urine of a larger cohort of Fabry patients comprised of males/females, adult/children, and enzyme replacement therapy (ERT) treatment or not. Ga2-related biomarkers will be evaluated as diagnostic tools for untreated Fabry patients (males and females), and for the monitoring of ERT. Finally, the levels of different Ga2 and Gb3 isoforms/analogs will be compared with various Fabry disease mutation types, such as classic mutations as well as cardiac variant mutations (e.g., p.N215S) [25, 26] to evaluate correlations, and to allow a better understanding of the pathophysiology of Fabry disease.
References
Bai, Y., Zhang, H., Sun, X., Sun, C., Ren, L.: Biomarker identification and pathway analysis by serum metabolomics of childhood acute lymphoblastic leukemia. Clin. Chim. Acta. 436, 207–216 (2014)
Caboni, P., Liori, B., Kumar, A., Santoru, M.L., Asthana, S., Pieroni, E., Fais, A., Era, B., Cacace, E., Ruggiero, V., Atzori, L.: Metabolomics analysis and modeling suggest a lysophosphocholines–PAF receptor interaction in fibromyalgia. PLoS ONE 19,9, e107626 (2014)
Li, Y., Song, X., Zhao, X., Zou, L., Xu, G.: Serum metabolic profiling study of lung cancer using ultra high performance liquid chromatography/quadrupole time-of-flight mass spectrometry. J. Chromatogr. B: Analyt. Technol. Biomed. Life Sci. 966, 147–153 (2014)
Lewis, G.D., Asnani, A., Gerszten, R.E.: Application of metabolomics to cardiovascular biomarker and pathway discovery. J. Am. Coll. Cardiol. 52, 117–123 (2008)
Guy, P.A., Tavazzi, I., Bruce, S.J., Ramadan, Z., Kochhar, S.: Global metabolic profiling analysis on human urine by UPLC-TOFMS: issues and method validation in nutritional metabolomics. J. Chromatogr. B. 871, 253–260 (2008)
Katajamaa, M., Ore, M.: Data processing for mass spectrometry-based metabolomics. J. Chromatogr. A. 1158, 318–328 (2007)
Jakóbkiewicz-Banecka, J., Gabig-Cimińska, M., Banecka-Majkutewicz, Z., Banecki, B., Węgrzyn, A., Węgrzyn, G.: Factors and processes modulating phenotypes in neuronopathic lysosomal storage diseases. Metab. Brain. Dis. 29, 1–8 (2014)
Platt, F.M., Boland, B., van der Spoel, A.C.: Lysosomal storage disorders: the cellular impact of lysosomal dysfunction. J. Cell. Biol. 199, 723–734 (2012)
Platt, F.M.: Sphingolipid lysosomal storage disorders. Nature 510, 68–75 (2014)
Clarke, J.T.R.: Narrative Review: Fabry Disease. Ann. Intern. Med. 146, 425–433 (2007)
Deegan, P.B., Baehner, A.F., Barba Romero, M.A., Hughes, D.A., Kampmann, C., Beck, M., on behalf of the European FOS investigators: Natural history of Fabry disease in females in the Fabry outcome survey. J. Med. Genet. 43, 347–352 (2006)
Auray-Blais, C., Boutin, M., Gagnon, R., Dupont, F.O., Lavoie, P., Clarke, J.T.R.: Urinary globotriaosylsphingosine-related biomarkers for Fabry disease targeted by metabolomics. Anal. Chem. 84, 2745–2753 (2012)
Auray-Blais, C., Boutin, M.: Novel Gb3 isoforms detected in urine of Fabry disease patients: a metabolomic study. Curr. Med. Chem. 19, 3241–3252 (2012)
Manwaring, V., Boutin, M., Auray-Blais, C.: A metabolomic study to identify new globotriaosylceramide-related biomarkers in the plasma of Fabry disease patients. Anal. Chem. 85, 9039–9048 (2013)
Dupont, F.O., Gagnon, R., Boutin, M., Auray-Blais, C.: A metabolomic study reveals novel plasma lyso-gb3 analogs as Fabry disease biomarkers. Curr. Med. Chem. 20, 280–288 (2013)
Lavoie, P., Boutin, M., Auray-Blais, C.: Multiplex analysis of novel urinary Lyso-Gb3-related biomarkers for Fabry disease by tandem mass spectrometry. Anal. Chem. 85, 1743–1752 (2013)
Boutin, M., Auray-Blais, C.: Multiplex tandem mass spectrometry analysis of novel plasma lyso-Gb3-related analogues in Fabry disease. Anal. Chem. 86, 3476–3783 (2014)
Auray-Blais, C., Ntwari, A., Clarke, J.T.R., Warnock, D., Oliveira, J.P.F.S., Young, S.P., Millington, D.S., Bichet, D.G., Sirrs, S., West, M.L., Casey, R., Wu, W.L., Keutzer, J., Zhang, K., Gagnon, R.: How well does urinary lyso-Gb3 function as a biomarker in Fabry disease? Clin. Chim. Acta. 411, 1906–1914 (2010)
Boutin, M., Gagnon, R., Lavoie, P., Auray-Blais, C.: LC-MS/MS analysis of plasma lyso-Gb3 in Fabry disease. Clin. Chim. Acta. 414, 273–280 (2012)
Liao, H.C., Huang, Y.H., Chen, Y.J., Kao, S.M., Lin, H.Y., Huang, C.K., Liu, H.C., Hsu, T.R., Lin, S.P., Yang, C.F., Fann, C.S., Chiu, P.C., Hsieh, K.S., Fu, Y.C., Ke, Y.Y., Lin, C.Y., Tsai, F.J., Wang, C.H., Chao, M.C., Yu, W.C., Chiang, C.C., Niu, D.M.: Plasma globotriaosylsphingosine (LysoGb3) could be a biomarker for Fabry disease with a Chinese hotspot late-onset mutation (IVS4 + 919G > A). Clin. Chim. Acta. 426, 114–120 (2013)
Mills, K., Morris, P., Lee, P., Vellodi, A., Waldek, S., Young, E., Winchester, B.: Measurement of urinary CDH and CTH by tandem mass spectrometry in patients hemizygous and heterozygous for Fabry disease. J. Inherit Metab. Dis. 28, 35–48 (2005)
Oshima, M., Asano, K., Shibata, S., Suzuki, Y., Masuzawa, M.: Urinary neutral glycosphingolipid analysis of patients with Fabry’s disease, rapid isocratic elution from high-performance liquid chromatography as per-o-benzoyl derivatives. Biochim. Biophys. Acta. 1043, 157–160 (1990)
Touboul, D., Roy, S., Germain, D.P., Baillet, A., Brion, F., Prognon, P., Chaminade, P., Laprévote, O.: Fast fingerprinting by MALDI-TOF mass spectrometry of urinary sediment glycosphingolipids in Fabry disease. Anal. Bioanal. Chem. 382, 1209–1216 (2005)
Sullards, M.C., Liu, Y., Chen, Y., Merrill, J.R.A.H.: Analysis of mammalian sphingolipids by liquid chromatography tandem mass spectrometry (LC-MS/MS) and tissue imaging mass spectrometry (TIMS). Biochim. Biophys. Acta. 1811, 838–853 (2011)
Saito, S., Ohno, K., Sakuraba, H.: database of the clinical phenotypes, genotypes and mutant α-galactosidase A structures in Fabry disease. J. Hum. Genet. 56, 467–468 (2011)
Auray-Blais, C., Cyr, D., Ntwari, A., West, M.L., Cox-Brinkman, J., Bichet, D.G., Germain, D.P., Laframboise, R., Melançon, S.B., Stockley, T., Clarke, J.T.R., Drouin, R.: Urinary globotriaosylceramide excretion correlates with the genotype in children and adults with Fabry disease. Mol. Genet. Metab. 93, 331–340 (2008)
Acknowledgments
This research was supported by a grant-in-aid of research from Genzyme, now a Division of Sanofi, and the Canadian Institutes of Health Research (CIHR). The authors are grateful to Waters Corporation for their continued scientific support and partnership. They thank all Fabry patients who throughout the years inspired them to devise methodologies, clinical studies, or protocols in order to better understand the pathophysiology of this complex disease. They thank Dr. Joe T. R. Clarke for his scientific expertise.
Author information
Authors and Affiliations
Corresponding author
Electronic supplementary material
Below is the link to the electronic supplementary material.
Table S-1
Mutation, age, creatinine concentration, and relative abundance of Ga2 and Gb3 isoforms/analogs in the two sample groups (Untreated Fabry males and healthy male controls). The Ga2 and Gb3 analogs/isoforms are separated in seven groups: (1) saturated fatty acid; (2) one extra double bond; (3) two extra double bonds; (4) hydroxylated saturated fatty acid; (5) hydroxylated fatty acid and one extra double bond; (6) hydrated sphingosine and hydroxylated fatty acid; and (7) methylated amide linkage. nd = not detected. (a): Ga2 isoforms/analogs in untreated Fabry males; (b): Ga2 isoforms/analogs in healthy male controls; (c): Gb3 isoforms/analogs in untreated Fabry males; (d): Gb3 isoforms/analogs in healthy male controls. (XLSX 30.9 kb)
Rights and permissions
About this article

Cite this article
Boutin, M., Auray-Blais, C. Metabolomic Discovery of Novel Urinary Galabiosylceramide Analogs as Fabry Disease Biomarkers. J. Am. Soc. Mass Spectrom. 26, 499–510 (2015). https://doi.org/10.1007/s13361-014-1060-3
Received:
Revised:
Accepted:
Published:
Issue Date:
DOI: https://doi.org/10.1007/s13361-014-1060-3