
Abstract
The time difference of arrival is a common method to find the leakage point of water pipeline. The leakage point localization is achieved by calculating the time delay between the signals reaching different sensors. Mainstream time delay estimation algorithms based on signal correlation analysis are susceptible to the introduction of noise signals, low sampling rates, and signal clipping, resulting in inaccurate localization results. The article analyzed the impact of different interference factors and proposed a new time delay estimation algorithm based on signal cross-zero information modulation (CZIM) to address these problems. By normalizing the amplitude of the two signals at the detection points on both sides of the pipeline leakage position, two sets of sparse signal sequences with only two eigenvalues of 0 and 1 are obtained. The error coefficient function is calculated by a similar traversal method to finally index the time delay. In this paper, the principle and characteristics of the algorithm are analyzed and compared with the most commonly used GCC method. In both numerical simulations and actual pipe leakage localization experiments, the CZIM algorithm has shown its wide applicability, low impact by low sampling rate, and adaptability to low signal-to-noise ratios, etc. At the same time, the algorithm is simple in design and has a small amount of calculation and can meet the demand for real-time data processing, providing a new idea for the development of acoustic localization technology.
Introduction
Water wastage due to leaking pipes is a problem in many countries (Grant et al. 2012); the situation is particularly serious in developing countries, with an estimated annual global economic loss of $39 billion (Iwanaga et al. 2022). It is important to locate the pipe leak to reduce water costs and protect public safety (Li et al. 2015).
The TDOA (the time difference of arrival) method for pipe leakage localization is one of the most widely used method that using acoustic/vibration sensors to collect leak signals from different locations (Martini et al. 2015; Knapp and Carter 1976; Ahadi and Bakhtiar 2010; Bentoumi et al. 2017), estimate the time difference (time delay) of the signal from the source to the different monitoring units through signal processing, and then mathematically calculate the coordinates of the leaks in combination with the known location of the monitoring units (Nesta and Omologo 2011), of which time delay estimation is a key part (Wang and Zhao 2020).
Due to the complexity of the occurrence of fluid vibration in the pipe, and the signal itself attenuation, reflection, scattering, and other factors during the transmission process, the collected signal tends to be distorted to a certain degree (Li et al. 2020). In order to reduce the errors caused by these factors, scholars from various countries have conducted research from multiple angles over years and proposed methods such as the use of the generalized cross-correlation (GCC) algorithm and the least mean square adaptive (LMS) algorithm (Knapp and Carter 1976; Zhou and Tian 2020), which can improve the accuracy of time delay estimation to a certain extent, but most of these studies are limited by the integrity of the signal. For some complex distorted signals, how to achieve accurate and stable time delay estimation requires further research.
For example, since van Fleck completed a pioneering work on the influence of signal clipping on correlation and proposed the arcsine law (Vleck and Middleton 1966), much research has been conducted on the effect of quantization on signal correlation (Watts 1962; Cooper 1970), finding that loss of amplitude information affects the results of time delay estimation, or although many techniques are effective in general leakage localization, problems may often occur when applied to pipes under conditions of high acoustic signal attenuation (Gao et al. 2004).
In response to these issues, this paper analyzes and quantifies the main causes of time delay estimation errors and proposes a time delay estimation method based on sparse cross-zero information. This method does not rely on specific information about the signal amplitude and can achieve accurate localization only by retaining a certain amount of cross-zero information. Therefore, in addition to being suitable for more common scenarios, it also performs well in situations with severe signal amplitude distortion.
In this paper, we first validate the feasibility of the signal cross-zero information modulation (CZIM) algorithm by using simulated signals and further design pipe leakage localization detection experiments. The most commonly acceleration sensors are used to collect leak signals (Choi et al. 2017); the reliability of the CZIM algorithm for pipe leakage localization applications was evaluated under several signal distortion conditions. The results show that the CZIM algorithm is a time delay estimation algorithm with high precision and high adaptability. The algorithm gets rid of the dependence of traditional algorithms on signal integrity, and the calculation is also effective in the case of low-signal feature.
Forms and the effects of signal distortion
With the application of acoustic techniques in detecting leaks in fluid-filled pipes proved effective (Gao et al. 2006; Khulief et al. 2012; Brennan et al. 2007), the TDOA method based on generalized cross-correlation (GCC) is widely used in pipe leakage localization (Gao et al. 2017; Li and Zhang 2020), which was proposed by Knapp and Carter in 1976 using a maximum likelihood estimator and the algorithm flow is shown in Fig. 1 (Knapp and Carter 1976; Kothandaraman et al. 2020).
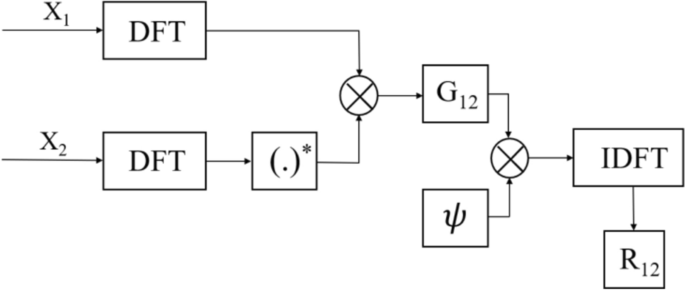
Schematic flow diagram of the GCC algorithm
Two channels of signals \(x_{1} \left( t \right)\) and \(x_{2} \left( t \right)\) are given by
where \(a_{1}\) and \(a_{2}\) are the attenuation coefficients of the signal (it is usually related to the spatial propagation path of the signal. The farther the signal transmission distance, the greater the attenuation, and the greater the value of ‘\(a\)’), \(s\left( t \right)\) is the source signal, \(n_{1} \left( t \right)\) and \(n_{2} \left( t \right)\) correspond to the two noise signals.
Substitute the weight function \(\psi\) and then the cross-correlation function of two channel signals
where \(D\) is the time delay between the two signals.
Substituting Eq. (1) into Eq. (2), this gives
where \(R_{ss}\) is the auto-correlation function of \(s\left( t \right)\), \(R_{{sn_{i} }} \left( {i = 1,2} \right)\) is the cross-correlation function of \(s\left( t \right)\) and n\(\left( t \right)\), and \(R_{{n_{1} n_{2} }}\) is the cross-correlation function of \(n_{1} \left( t \right)\) and \(n_{2} \left( t \right)\).
From Eq. (3) it can be found that the mixing of interference noise \(n\left( t \right)\), the lower sample rate-to-signal dominant frequency ratio and the large amount of distortion of the source signal \(s\left( n \right)\) amplitude information are the main factors that cause the time delay estimation error.
Interference noise
When the signal is collected to locate the leaks of the pipe, due to the complexity of the vibration environment, interference signals are inevitably mixed in during the process of collecting signals, and as the signal-to-noise ratio of the collected signals decreases, the time delay estimation results will be disturbed obviously. And the interference noise is usually not completely independent of each other, which is also a factor that needs to be considered.
In Fig. 2, we use Gaussian white noise to simulate the leak signal and carry out a correlation analysis, although this is not strictly true in practice due to the limited bandwidth of the leak noise at the source (Brennan et al. 2019), but it can be acceptable for use in simulation. The auto-correlation function of a set of Gaussian signals with a standard deviation of 1.0 is calculated, and the result is shown in Fig. 2a. The signal is divided into two channels and independent white noise is added as interference noise to make the signal-to-noise ratio of − 5 dB, the cross-correlation function of the two channels is calculated, and the result is shown in Fig. 2b. If the added white noise is correlated, some corresponding sub-peaks are generated on the image, even though the signal-to-noise ratio remains at − 5 dB, as shown in Fig. 2c.

Cross(auto)-correlation function calculation result under different conditions
Limited sampling frequency
During the sampling process, due to the limitation of the data acquisition instrument itself, the signal collected by the system is limited discrete points, while the actual signal is a continuous line, so the only way to obtain a valid signal waveform is to ensure that the number of points is large enough and that the initial phases of the sampling are all integers.
If the sampling frequency is limited in the face of high-frequency signals (Hu et al. 2018), such as wireless sensors in use, considering the limitation of transmission bandwidth, high-frequency real-time sampling cannot be realized. Which resulting in a large amount of signal information being lost when the sampling rate to signal dominant frequency ratio is too low, will affect the results of time delay estimation to a greater extent.
As shown in Fig. 3, using 1280 Hz and 2560 Hz to sample the same set of waveforms, the completeness of the signal information obtained is quite different.

Signals collected at different sampling rates
Taking the sine wave whose maximum amplitude is A as an example, two sets of samples are performed on the same waveform with the sampling rate K; then the error value E of each sampling point of the two sets of samples satisfies:
Strong interference noise
The strong interference occasionally introduced in the sampling process is also an important factor that causes delay calculation errors. As shown in Fig. 4, strong interference often has the characteristics of large amplitude and short duration, and it can be found from Eq. (3) that this kind of signal can easily cause great disturbance to \(R_{{x_{1} x_{2} }}\).

Sudden strong interference during sampling
Furthermore, if both detection units that need to perform delay estimation receive a certain strong interference, the correlation between the interference signals will further amplify the influence.
Aiming at the main problems such as signal acquisition mixed with noise, sampling rate limitation, and mixed with strong interference, which cause time delay estimation errors, this research proposes a time delay estimation method based on sparse cross-zero information. The method minimizes the impact of signal distortion by normalizing the signal and using a traversal-like approach to achieve accurate calculation the time delay of signal under various complex conditions.
Cross-zero information modulation (CZIM) algorithm
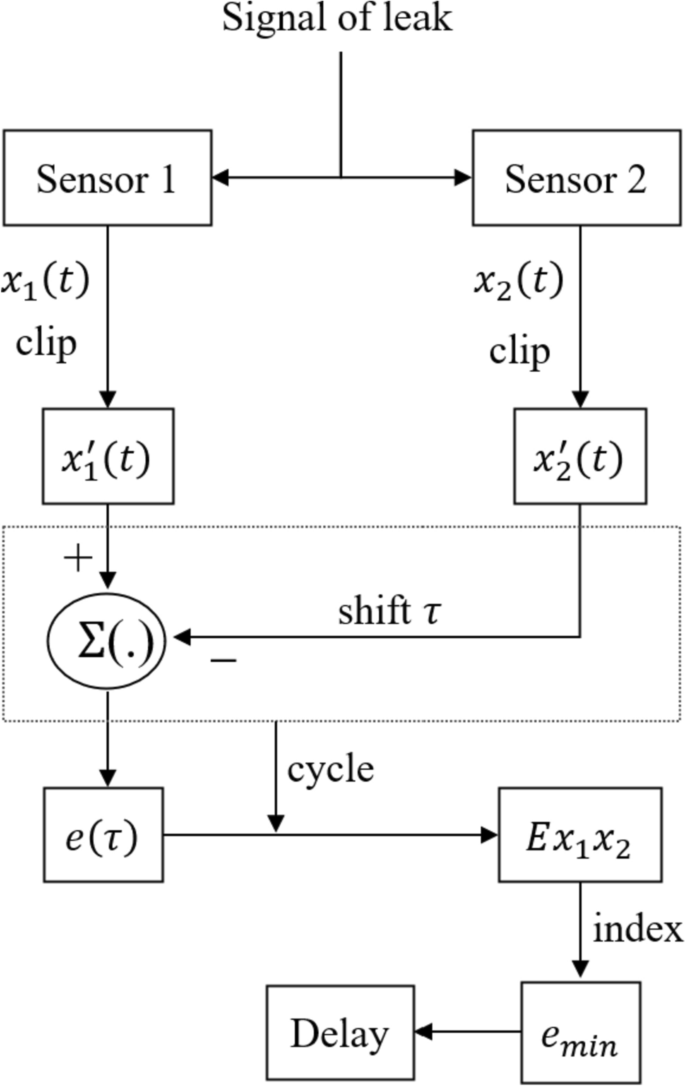
The flow chart of the time delay estimation algorithm based on signal cross-zero information modulation (CZIM) is shown in Fig. 5. After the leak occurs, the signal propagates along the pipe wall toward both ends and is collected by sensor 1 for signal \(x_{1} \left( t \right)\) and collected by sensor 2 for signal \(x_{2} \left( t \right)\), respectively.
Schematic flow diagram of the CZIM algorithm
Clipping is performed on \(x_{1} \left( t \right)\) and \(x_{2} \left( t \right)\), and the time–amplitude information of the signal is converted into a sparse signal with only two eigenvalues of 0 and 1. That is for a certain moment t, if the signal amplitude \(y > 0\), let \(y = 1\); if the signal amplitude \(y \le 0\), let \(y = 0\). Only the cross-zero information or positive can be retained.
Thus, two sets of clipped rectangular waveform signals \(x_{1}{\prime} \left( t \right)\) and \(x_{2}{\prime} \left( t \right)\) can be obtained. The rectangular waveform signal is a sparse signal containing only two characteristic values of 0 and 1. Taking a segment of the signal actually collected as an example, the signal waveform amplitude information sparse processing is shown in Fig. 6.

Signal normalization schematic
Add the signals \(x_{1}{\prime} \left( t \right)\) and \(- x_{2}{\prime} \left( t \right)\) correspondingly, define the terms that are not 0 as error points, calculate the number of error points to get \(Y^{\prime}\), and divide \(Y^{\prime}\) by the total number of terms N to obtain the error coefficient \(e_{0}\).
Let the signal \(x_{1}{\prime} \left( t \right)\) be misaligned and then add it to \(- x_{2}{\prime} \left( t \right)\) with the misalignment value \(\tau\). Thus
The misaligned calculation is performed within a certain range, connect each \(e_{\tau }\) to obtain an error curve \(E_{{x_{1} x_{2} }}\). The curve is indexed to the minimum value to obtain the minimum error factor \(e_{\min }\). At this time the corresponding misalignment value \(\tau\) is the required time delay.
Taking a set of ideal signal as an example, in the absence of on interference we can get \(e_{\min } = 0\) and the error coefficient curve \(E_{{x_{1} x_{2} }}\) is shown in Fig. 7.

Error coefficient curve without interference
This algorithm first performs rectangular processing on signal \(x_{1}\) and \(x_{2}\), then makes the two rectangular waves perform offset subtraction calculation, and finally obtains the error coefficient curve \(E_{{x_{1} x_{2} }}\). The number of error point \(Y^{\prime}\) is represented on the image as the area of the non-overlapping part of the two rectangular waves after the relative translation of the covariate \(\tau\). The smaller the area, the higher the correlation of the signal corresponding to \(\tau\).
Compared with the traditional method, the time delay estimation method based on signal cross-zero information is not only applicable to the calculation of time delay estimation under general conditions, but can also meet the demand for time delay estimation under signal distortion conditions. Through rectangular processing, the signal can be converted into a sequence composed of 0 and 1. When small amplitude signal distortion occurs, the amplitude positive and negative information of most points on the signal curve will not change, so there will be almost no disturbance to the 0 and 1 sequence as shown in Fig. 8. And when the signal has a large-amplitude distortion, such as the introduction of strong burst interference, due to the normalized processing method, the large-amplitude change will be converted into a limited 0, 1 sequence change, thereby effectively limiting the impact of strong interference on the overall curve and obtaining more accurate and stable time delay estimation results.

Original signal and normalized signal before/after introduction of interference
Performance evaluation test of CZIM algorithm
Several sets of representative simulation experiments were designed to research the impact of the three main factors on the CZIM algorithm which are mentioned in “Forms and the effects of signal distortion” section.
In order to make the simulation results closer to the actual application, the standard sound source of the coupled cavity is used to send out the signal and use standard microphone to collect the signal, we designed time delay estimation experiments under different conditions. The frequency and time delay of the simulated signal are set, the AWA14424S coupled-cavity standard sound source is controlled to emit the set signal, and the 130E22 standard microphone is used to collect the emitted sound signal. In the experiment, the standard sound source of the coupled cavity can be used to avoid environmental interference and can effectively control the signal-to-noise ratio of the signal.
Different signal-to-noise ratios
Gaussian random signal is a random signal with a normal distribution of probability density distribution, which is a common random signal (Lopes 2020). In the simulation experiment, two Gaussian random signals with standard deviation of 0.2 are selected as the source signals, and the channel time delay of the two signals is set to 0.5 s with a sampling rate of 10000 Hz. Uncorrelated white noise is mixed in both Gaussian signals as the interference signal, adjust white noise to make the signal-to-noise ratio (SNR) of 5 dB, 0 dB, and − 5 dB, respectively, for testing, and the time delay estimation ability of the CZIM algorithm under different SNR conditions is investigated, and the GCC algorithm is used as the control group for comparison. The results are shown in Figs. 9 and 10.

Estimation of time delay under different signal-to-noise conditions by CZIM algorithm

Estimation of time delay under different signal-to-noise conditions by GCC algorithm
It can be found from the experimental results that for common Gaussian random signals mixed with white noise, CZIM algorithm and GCC algorithm can accurately calculate the time delay \(d = 0.5\) under the three signal-to-noise ratio conditions and have relatively similar time delay estimation characteristics.
Lower sampling frequency
Designed time delay estimation experiments under different sampling frequencies to study the impact of high and low sampling frequencies on the CZIM algorithm, and also set the GCC algorithm as a control group. Use Gaussian random signal mixed with white noise as the experimental signal, make the signal-to-noise ratio of the signals input to the two coupled-cavity standard sound sources both − 5 dB, and set the time delay of the two signals to 0.5 s. Microphones are used to collect signals at sampling rates of 1000, 3000, and 10,000 Hz. Based on the acoustic signals collected by the microphones, the CZIM algorithm and GCC algorithm are used to calculate the time delay. The calculation results are shown in Figs. 11 and 12.

Estimation of time delay at different sampling frequencies by CZIM algorithm

Estimation of time delay at different sampling frequencies by GCC algorithm
From Fig. 12, it can be found that the generalized cross-correlation algorithm is more obviously affected by the sampling frequency. As the sampling frequency increases, the signal information becomes more accurate and the obtained time delay estimation results are more accurate, while at lower sampling frequencies, the GCC algorithm has difficulty in obtaining the required time delay estimation results.
Under the same conditions, the time delay estimation results of the CZIM algorithm are shown in Fig. 11. It can be found that the CZIM algorithm is not sensitive to changes in sampling frequency and can still calculate accurate time delay even at low sampling frequencies compared to the GCC algorithm.
The low sampling rate will lead to the loss of part of the signal information, as shown in Fig. 13, which is one of the important reasons for the error in the time delay estimation using the GCC algorithm under the condition of low sampling rate. For the CZIM algorithm, the cross-zero information of the signal is always easier to retain than the exact amplitude information under the low sampling rate, as shown in Fig. 14, so the CZIM algorithm can perform better time delay estimation characteristics.

Completeness of signal information at different sampling rates

Completeness of signal information at different sampling rates
Strong interference
As mentioned in “Strong interference noise” section, the introduction of strong interference noise in the signal sampling process can have a significant impact on the time delay estimation results of traditional algorithms such as the GCC algorithm. As mentioned above, the CZIM algorithm will normalize the signal amplitude to reduce such effects.
In order to verify the stability of the CZIM algorithm under the condition of strong interference resistance, a simulation experiment is designed: The Gaussian random signal mixed with white noise is used as the source signal, set the signal-to-noise ratio to − 5 dB, the time delay of the two signals is 0.5 s, and the sampling rate is 10000 Hz; a triangular wave with larger amplitude is added to one of the signals to simulate strong interference noise as shown in Fig. 15a and then use the CZIM and GCC algorithms to calculate the time delay for the two signals.

Time delay estimation under strong interference noise: a the strong interference noise; b time delay estimation result using CZIM algorithm; c time delay estimation result using GCC algorithm
The results in Fig. 15c show that when the introduced strong interference noise amplitude reaches about 5 times the source signal amplitude, the result obtained by the GCC algorithm is completely distorted, while the CZIM algorithm is almost unaffected and the calculated time delay is very clear (shown in Fig. 15b).
In practical applications, the distance between the detection units is generally limited so in most cases both units will be affected by strong interference noise. We need to be aware that the correlation of the strong interference signals themselves can also have a significant impact on the time delay estimation. In order to verify the applicability of the CZIM algorithm under such conditions, further simulation experiments were set up: Using the same source signals as above, strong interference noise with the characteristics shown in Fig. 16a was added to the both signals, and the time delay between the two sets of strong interference signals was − 0.25 s. The time delay between the two channels was calculated using the CZIM algorithm and the GCC algorithm.

Time delay estimation under strong interference noise with correlation: a the strong interference noise; b time delay estimation result using CZIM algorithm; c time delay estimation result using GCC algorithm
It can be found that in the case where the strong interference noises are correlated, even if the amplitude of the strong interference noise is only about 1.5 times that of the source signal, the peak at d = − 0.25 s in Fig. 16c has far exceeded the peak d = 0.5 s. In this interference situation, GCC algorithm cannot get accurate delay estimation results. The correlation of the strong interference noises just forming only a small peak in Fig. 16b does not affect the correctness of the time delay calculation with CZIM algorithm.
When strong disturbances are introduced, both methods show different degrees of deviation, while the GCC algorithm shows a larger deviation due to the fact that the magnitude of the correlation coefficient is in a kind of proportional relationship with the amplitude; a strong interference noise with a large amplitude will cause the delay estimation result of the GCC algorithm to have a large deviation to it; for the CZIM algorithm, due to its different computing mechanism, large-amplitude variation is converted into a limited number of 0 and 1 sequence variation during normalization processing, which greatly reduces the influence of strong interference noise, and the final result is shown as a small deviation.
Leakage localization of pipe
In the pipe leakage localization research, due to the complexity of the pipe fluid acoustic system, the vibration signal collected by the sensor is often distorted, which makes the location results unstable or inaccurate, while the CZIM algorithm can reduce the impact of signal distortion to a certain extent. In order to verify the practical effectiveness of the CZIM algorithm, we built a test system for pipe leakage localization and conducted experiments. Due to the particularity of the fuel pipeline, this paper replaces the fluid medium in the pipeline with water to carry out simulation experiments.
In the experiment, the water pressure in the pressure storage tank was controlled to be constant at 0.15 MPa, and the valve at a certain position on the pipe was opened to simulate the occurrence of pipe leak. The acceleration signal was collected by the 1A315E piezoelectric acceleration sensor, and the test system is shown in Fig. 17.

Schematic diagram of pipe leakage localization system
The three acceleration sensors are placed at points 1, 2, and 3, and the mutual distance between the three points is known. After the leak occurs at point \(p\), the vibration signal propagates along the pipe wall to both sides and is collected by the three sensors successively, with the leak point \(p\) between points 1 and 2 as an example.
Since \(L_{2 - 3}\) (the length between point 1 and point 2) is known, the time delay \(\Delta T_{23}\) between the signals collected by sensor 2 and sensor 3 can be used to calculate the vibration signal transmission speed by
In the experiment, the speed of transmission of the vibration signal through the pipe is considered to be constant. Therefore, the time delay difference \(\Delta T_{12}\) between sensors 1 and 2 can be used to calculate the distance difference between the leak point \(p\) and the sensor sampling points 1 and 2 as follows
The locations of points 1 and 2 are known. Thus
Similarly, \(L_{2 - 3}\) can also be calculated according to the time delay \(\Delta T_{13}\) between sensor 1 and sensor 3. Since the distance difference corresponds to
Thus the verification formula can be obtained
Obviously, the key part of the leakage localization is the accurate solution of the time delay between the arrival of the leak signal at each sensor.
The power spectrum analysis of the vibration signals collected at sensor 1 and sensor 3 is shown in Fig. 18. Sensor 1 is closer to the leak position, and sensor 3 is far away. From the peak change of the power spectrum function, it can be found that the vibration signal attenuates significantly as the distance gets farther away, but the main frequency band of the leak signal is always concentrated in 3600–4600 Hz and does not change significantly.

Power spectrum of signal
In order to study the time delay estimation ability of CZIM algorithm under extreme working conditions, the sampling rate is set to 12800 Hz, so that the sampling rate-to-signal dominant frequency is at a low level. The time delay is estimated using the CZIM algorithm and GCC algorithm for the signals collected by the three sensors in such operating conditions, and the experimental results are shown in Fig. 19.

Time delay estimation results of CZIM algorithm and GCC algorithm
From the results in Fig. 19, it can be found that the results of the CZIM algorithm and the GCC algorithm for time delays \(\Delta T_{12}\) and \(\Delta T_{13}\) are the same. But for \(\Delta T_{23}\), the estimated time delay of the CZIM algorithm is 1.953125 × 10⁻³ s (25/12800), while the estimated time delay of the GCC algorithm is 6.40625 × 10⁻³ s (82/12800). By verifying Eq. (10), it can be determined that the GCC algorithm has made an error in the calculation of \(\Delta T_{23}\), the GCC algorithm has a 69.5% (\(\frac{82 - 25}{{82}} \times 100\%\)) higher error rate than the CZIM algorithm, and this error would affect the solution of the vibration transfer velocity \(v\) and render subsequent calculations meaningless. Table 1 lists the leakage localization results of the CZIM algorithm and the relative error between the calculation results and the experimental setting values.
It can be found from Table 1 that even under the conditions of low delay and obvious signal attenuation, the CZIM algorithm can still accurately solve the signal time delay. And the error of solution result is only 0.04 m, achieving an error rate of only 0.167% on a 24-m class pipe.
Further analysis of the results of the time delay estimation results of the two methods can be found that at low sampling rate-to-signal dominant frequency ratio, the traditional GCC method is more likely to be affected by signal distortion and will form a large number of sub-peaks near the main peak, which affects the stability of the time delay estimation, and as the signal-to-noise ratio further decreases, the main peak will be suppressed by the sub-peaks, resulting in wrong locating results; while the CZIM algorithm proposed in the paper is less affected by signal distortion, in the estimation of time delays \(\Delta T_{12}\), \(\Delta T_{13}\), and \(\Delta T_{23}\), the peaks are more obvious than those of the GCC method, especially in the estimation of time delays \(\Delta T_{23}\), although the sub-peaks also appear at 6.40625 × 10⁻³ s (82/12800), but do not exceed the main peaks and can still achieve accurate localization. Therefore, under complex signal distortion conditions caused by low signal-to-noise ratio and low sampling rate-to-signal dominant frequency ratio, the CZIM algorithm has more stable and accurate localization characteristics than the GCC algorithm.
Conclusion
The time delay estimation of the traditional GCC algorithm is susceptible to signal distortion. The paper analyzes the influence of several main signal distortions on the time delay estimation and proposes a time delay estimation method based on sparse cross-zero information. The method normalizes the signal amplitude, draws the error curve, and finally obtains the time delay, which can effectively reduce the influence of signal distortion.
Simulation experiments are designed to verify the theoretical correctness of the CZIM algorithm according to several major signal distortions mentioned in the paper. At the same time, the CZIM algorithm is compared with the GCC algorithm. The experimental results show that the CZIM algorithm is easy to design, simple to implement, and has a good time delay estimation effect for various use conditions, and the scope of application is relatively wide; it is insensitive to changes in sampling frequency and can be used for experiments on time delay estimation at low sampling frequencies; it can effectively overcome the influence of signal amplitude distortion and can still guarantee good results under more extreme conditions such as mixed with strong interference. The paper applies the CZIM algorithm to the pipe leakage localization experiment in a complex environment. The results show that the CZIM algorithm can still perform more accurate and stable time delay estimation under the conditions of low signal-to-noise ratio, low sampling rate to signal dominant frequency ratio, and significant signal distortion, which has obvious advantages over the traditional GCC algorithm.
In addition, the CZIM algorithm proposed in the paper adopts a new way of thinking and has a lot of room for further research. For example, in addition to the update and improvement of the algorithm, a certain degree of expansion research can also be carried out on the hardware. Up to now, a low-cost, low-power wireless sensor is being considered to be combined with the CZIM algorithm for use in the water pipe leakage localization scheme. With the successful implementation of the algorithm validation experiments, it is foreseen that the algorithm will have long-term potential in the field of acoustic localization.
References
Ahadi M, Bakhtiar MS (2010) Leak detection in water-filled plastic pipes through the application of tuned wavelet transforms to acoustic emission signals. Appl Acoust 71(7):634–639
Bentoumi M, Chikouche D, Mezache A et al (2017) Wavelet DT method for water leak-detection using a vibration sensor: an experimental analysis. IET Signal Process 11(4):396–405
Brennan MJ, Gao Y, Joseph PF (2007) On the relationship between time and frequency domain methods in time delay estimation for leak detection in water distribution pipes. J Sound Vib 304(1–2):213–223
Brennan MJ, Gao Y, Ayala PC et al (2019) Amplitude distortion of measured leak noise signals caused by instrumentation: effects on leak detection in water pipes using the cross-correlation method. J Sound Vib 461:114905
Choi J, Shin J, Song C et al (2017) Leak detection and location of water pipes using vibration sensors and modified ML prefilter. Sensors 17(9):2104
Cooper BFC (1970) Correlators with two-bit quantization. Aust J Phys 23:521–527
Gao Y, Brennan MJ, Joseph PF et al (2004) A model of the correlation function of leak noise in buried plastic pipes. J Sound Vib 277(1–2):133–148
Gao Y, Brennan MJ, Joseph PF (2006) A comparison of time delay estimators for the detection of leak noise signals in plastic water distribution pipes. J Sound Vib 292(3–5):552–570
Gao Y, Liu Y, Muggleton JM (2017) Axisymmetric fluid-dominated wave in fluid-filled plastic pipes: loading effects of surrounding elastic medium. Appl Acoust 116:43–49
Grant SB, Saphores JD, Feldman DL et al (2012) Taking the “waste” out of “wastewater” for human water security and ecosystem sustainability. Science 337(6095):681–686
Hu Z, Le C, Zhang Y (2018) Generalized cross-correlation time delay estimation algorithm based on frequency division in reverberation environment. Comput Eng 44(9):269–273 (in Chinese)
Iwanaga MK, Brennan MJ, Almeida FCL et al (2022) A laboratory-based leak noise simulator for buried water pipes. Appl Acoust 185:108346
Khulief YA, Khalifa A, Mansour RB et al (2012) Acoustic detection of leaks in water pipelines using measurements inside pipe. J Pipeline Syst Eng Pract 3(2):47–54
Knapp C, Carter G (1976) The generalized correlation method for estimation of time delay. IEEE Trans Acoust Speech Signal Process 24(4):320–327
Kothandaraman M, Law Z, Gnanamuthu EMA et al (2020) An adaptive ICA-based cross-correlation techniques for water pipeline leakage localization utilizing acousto-optic sensors. IEEE Sens J 20(17):10021–10031
Li B, Zhang X (2020) Improved microphone array sound source localization method based on generalized mutual correlation. J Nanjing University Nat Sci 56(6):917–922 (in Chinese)
Li R, Huang H, Xin K et al (2015) A review of methods for burst/leakage detection and location in water distribution systems. Water Sci Technol Water Supply 15(3):429–441
Li J, Chen Y, Qian Z et al (2020) Research on VMD based adaptive denoising method applied to water supply pipeline leakage location. Measurement 151:107153
Lopes PAC (2020) Bayesian step least mean squares algorithm for Gaussian signals. IET Signal Process 14(8):506–512
Martini A, Troncossi M, Rivola A (2015) Automatic leak detection in buried plastic pipes of water supply networks by means of vibration measurements. Shock Vib 2015:1–13
Nesta F, Omologo M (2011) Generalized state coherence transform for multidimensional TDOA estimation of multiple sources. IEEE Trans Audio Speech Lang Process 20(1):246–260
Van Vleck JH, Middleton D (1966) The spectrum of clipped noise. Proc IEEE 54(1):2–19
Wang H, Zhao X (2020) Analysis of accurate time delay extraction method based on endpoint detection and its localization accuracy. Acoust. Technol. https://kns.cnki.net/kcms/detail/31.1449.TB.20200908.0923.002.html(in Chinese)
Watts DG (1962) A general theory of amplitude quantization with applications to correlation determination. Proc IEE Part C Monogr 109(15):209–218
Zhou H, Tian Z (2020) Improvement of time de-lay estimation based on generalized mutual correlation algorithm. In: Proceedings of the 2020 Western China acoustical academic exchange conference. Editorial Board of Acoustics Technology, p 3 (in Chinese)
Acknowledgements
The authors would like to thank the members of the School of Civil Engineering of Tianjin University. We thank LetPub (www.letpub.com) for its linguistic assistance during the preparation of this manuscript. We also thank the associate editor and the reviewers for their useful feedback that improved this paper.
Funding
This work was supported by the National Key R&D Program of China (Grant No. 2020YFA040070) and Science and Technology Commission Innovation Fund (Grant No. 22020401023).
Author information
Authors and Affiliations
Corresponding author
Ethics declarations
Conflict of interest
No conflict of interest exists in this manuscript, and manuscript is approved by all authors for publication. I would like to declare on behalf of my co-authors that the work described was original research that has not been published previously, and not under consideration for publication elsewhere, in whole or in part. All the authors listed have approved the manuscript that is enclosed.
Rights and permissions
Open Access This article is licensed under a Creative Commons Attribution 4.0 International License, which permits use, sharing, adaptation, distribution and reproduction in any medium or format, as long as you give appropriate credit to the original author(s) and the source, provide a link to the Creative Commons licence, and indicate if changes were made. The images or other third party material in this article are included in the article's Creative Commons licence, unless indicated otherwise in a credit line to the material. If material is not included in the article's Creative Commons licence and your intended use is not permitted by statutory regulation or exceeds the permitted use, you will need to obtain permission directly from the copyright holder. To view a copy of this licence, visit http://creativecommons.org/licenses/by/4.0/.
About this article

Cite this article
Yue, Y., Qu, Y., Yan, L. et al. Research on pipeline leakage localization method based on CZIM algorithm. Appl Water Sci 14, 135 (2024). https://doi.org/10.1007/s13201-024-02112-7
Received:
Accepted:
Published:
DOI: https://doi.org/10.1007/s13201-024-02112-7