
Abstract
Floods are the most common natural disasters on earth. Population growth with global warming and climate changes increases the impact of floods on people every year. Combating natural disasters such as floods is possible with effective disaster management. An effective disaster management can only be possible with a comprehensive risk analysis. Flood risks depend on many factors such as precipitation, flow, earth slope, soil structure, and population density. A holistic flood risk analysis considering all these factors will provide a more effective disaster management. This study focuses on an assessment of flood hazard analysis in Bitlis province of Turkey using analytical hierarchy method which is a multi-parameter modeling technique. Flood hazard zones were mapped according to the weight of the selected factor by using geographic information system. It is concluded that while especially the south-western regions are exposed to high flood risk due to high stream density and precipitation, the high slope and rugged nature of this region restrict the risk mainly to the vicinity of low elevation streams and high population regions.
Introduction
Although it is not possible to completely prevent natural disasters, the damage caused by these disasters can be minimized with structural and non-structural measures. Floods are one of the most common natural disasters in the world that cause major economic, social and infrastructure damage as well as significant loss of life. For this reason, it is important to determine the flood risks especially in the settlements in order to prevent possible damages. Analytical hierarchy process (AHP), which has become popular in the spatial evaluation of multi-parameter problems in recent years, is an effective method in the spatial assessment of flood risks together with geographic information systems (GIS). AHP is a highly cultivated method in multivariate problems in terms of determining the effect of the variables on the event in proportion to their weights. Many researchers have used the AHP supported by some additional techniques such as GIS and artificial intelligent (AI) to analyze the flood risk assessment for their region. Seejata et al. (2018) used the GIS-supported analytical hierarchy method to evaluate flood hazard areas in Sukhothai province, Thailand. They weighed six relevant physical factors namely rainfall amount, slope, elevation, river density, land use and soil permeability for the estimation of flood risk zones. Chakraborty and Mukhopadhyay (2019) obtained flood risk maps based on flood hazard index and flood susceptibility index of a flood-threatened region using AHP. Dandapat and Panda (2017), considering Paschim Medinipur district in West Bengal as study area, used AHP aided GIS to evaluate the vulnerability and risk assessment of flood. To describe the flood risk zones, they prepared a composite vulnerability index accomplished with physical and social vulnerability index along with a coping capacity index. Ekmekcioglu et al. (2021) proposed a new AHP technique that consists of thirteen flood vulnerability and hazard criteria to generate Istanbul’s district-based flood risk map. They used a fuzzy AHP to obtain the weights of criteria. Their findings showed that high-risk districts were mainly at the center and highly populated areas of Istanbul. The accuracy of their model was validated by observations of the significant flood events in the last decades, and it was proposed that the method could be used advantageously to obtain a quick and regional flood risk assessment. Ghosh and Kar (2018) attempted to assess risk due to flooding using AHP incorporating flood hazard elements and vulnerability indicators in GIS environment. They used morphological and hydrometeorological parameters to prepare a flood hazard map while demographic, socio-economic and infrastructural parameters to produce the vulnerability map. Sinha et al. (2008) performed a flood risk analysis in the Kosi river basin integrating the hydrological analysis with a GIS-based flood risk mapping in parts of the basin. They used geomorphological, land cover, topographic and social parameters to define a flood risk index through HYP. In addition to these studies, several researchers have performed to integrate the GIS tools with the AHP to determine flood risk maps (Wang et al. 2011; Aher et al. 2013; Stefanidis and Stathis 2013; Papaioannou et al. 2015; Dahri and Abida 2017; Hammami et al. 2019; Meshram et al. 2019; Souissi et al. 2019; Sepehri et al. 2020).
These above studies showed that especially GIS-based AHP is a powerful tool for analyzing flood risk of a particular region and creating flood risk maps. Floods are the second among all disasters in terms of loss of life and property and the first among meteorological disasters in Turkey (SYGM 2020a, b). In this study, flood analysis of Bitlis province in eastern Turkey, which is exposed to significant floods with its rugged structure and excessive precipitation, was carried out with GIS-based AHP. The outputs obtained from this method will contribute significantly to the pre-disaster flood control studies.
Study area
The province of Bitlis, chosen as the study area, is located in a mountainous and rugged region at 1500–1800 m elevations in eastern Turkey. The climate of this region shows a micro-climatic behavior due to the transition of different climatic zones and the Van Lake located in the east. With these features, the region is the settlement that receives the most snowfall in Turkey. Significant flooding events may occur as a result of snow melting caused by the increase in hot temperatures, especially with the falling precipitation. As seen on the map in Fig. 1, Bitlis is the fourth among the flood events that occurred in Turkey between 1950 and 2019 with 247 flood records. Bitlis city center, which has a historical and distorted structure, has been exposed to significant floods in the past due to the stream passing through it (Aydin and Isik 2015; Aydin and Yaylak 2016). The largest known flood disaster in Bitlis was reported on May 2, 1995. The rainfall, which lasted for about 36 h, caused a perfect flood in the Bitlis stream passing through the city center, resulting in significant damage in the city (Arınç 1996). In the city center of Bitlis, flood disasters were also experienced in 2017 and 2018, caused by heavy rainfall. In addition, the floods that occurred in Hizan district in 2006 and Tatvan district in 2006, 2012 and 2020 are some examples of important flood events in this area. It is reported that more than 4000 people would be affected by the flood in the most unfavorable scenario of the 500-year recurrent possible flood flows within the borders of Bitlis province. Possible losses in the region for 500-year period floods are given in Table 1 (SYGM 2020a, b).

The number of flood events in Turkey between 1950 and 2019 (AFAD, 2019)
Methodology
Analytical hierarchy process (AHP) is an effective method in multiple decision-making processes using in many fields such as finance, business, education, politics and engineering. Among the multi-criteria decision-making methods (MCDM), the most commonly used method is the AHP, which was developed by Saaty (1980) with inspiration from Myers and Alpert (1968). The AHP has been reconstructed by many researchers because of its several advantages in making critical decisions (Yang et al. 2013; Budayan 2019; Darko et al. 2019; Gurgun and Koc 2020). The AHP is a flexible mathematical model considering the priorities of the individual or group and evaluates both quantitative and qualitative criteria in decision-making problems (Dagdeviren et al. 2004). The method consists of decision stages in which the values are assigned and alternative values are determined according to the criteria chosen to manage the decision-making process. The first stage in AHP is to define the hierarchical structure and the comparison matrix. Then, the comparison matrix is converted to a priorities vector, and the compliance rate is estimated by means of random index value (Can 2019). Figure 2 shows the schema of three-level hierarchical structure for a MCDM problem presented by Wang et al. (2008). The top level indicates the decision goal, a lower level represents the criteria, and the low level represents the low alternatives, if any. There are decision options at the bottom level. For consistency of pairwise comparison, the number of criteria and each criterion should be defined correctly. The criteria should be classified according to their common characteristics. AHP can be applied with many criteria. The importance levels of the criteria are determined by comparing the two criteria in AHP after the hierarchical structure is established. While making a pairwise comparison between the decision criteria, the most appropriate decision is scored between 1 and 9, as in Table 2, in consultation with the decision-makers as well (Wang et al. 2008). Thus, the pairwise comparison matrix for the certain assessment criteria is defined as in Eq. (1) (Timur 2011). The relationship between the pairwise comparison values of two reciprocal criteria is expressed as a21 = 1/a12.
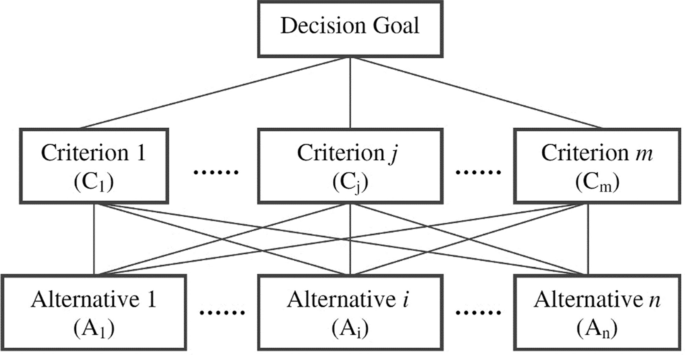
A three-level hierarchy for a MCDM problem (Wang et al. 2008)
To obtain the normalized matrix, first, the elements of each column in the comparison matrix are summed and then, each element of the comparison matrix is divided by the column sum. The weight vector is determined by calculating the average of each row of the normalized matrix. The priorities matrix is also determined by multiplying the comparison matrix and the weight vector as follows:
The maximum eigenvalue (λmax) is computed with the following.
In these equations, n is criteria number, A is the pairwise comparison matrix, and W is the weight vector. This method for determining the weight vector of a pairwise comparison matrix is called the principal right eigenvector method (EM) (Saaty 1980). Because the decision-maker may not provide perfectly consistent pairwise comparisons, it is recommended that pairwise comparison matrix A should have an acceptable consistency that can be checked by the following consistency ratio (CR) (Wang et al. 2008):
where the CI is the consistency index, and RI is the random inconsistency index that is taken from Table 3 depending on n number.
If CR is below 0.10, the comparison matrix is considered to have acceptable consistency; otherwise, the decision-making process is repeated until consistency is achieved. CR = 0.00 means the CR value is the best value for consistency (Saaty 1990; Subramanian and Ramanathan 2012).
Flood risk analysis
The hazard and vulnerability criteria should be evaluated together when assessing risk scores. This approach, which is frequently used in risk assessment, was expressed by many researchers as follows (Wisner et al. 2004; Masood and Takeuchi 2012; Dandapat and Panda 2017Chakraborty and Mukhopadhyay 2019):
Flood risk can be considered as a combination of both the hazard and the vulnerability factors as detailed. While the hazard factors directly affect the severity of the disaster, such as precipitation, river distance, geological structure, slope and aspect, the vulnerability factors reflect the sensitivity of the affected area such as population, soil and land use. For the risk to occur in an area, these two factors must be together, otherwise there is no risk. The flowchart of the method of the GIS-based AHP used in this study is detailed in Fig. 3. Here, a GIS interface was used to create and combine hazard and vulnerability maps. The final risk score was determined based on weights (wi) and overall criteria (ci) which was obtained from AHP analysis as follows (Hajkowicz and Collins 2007; Ekmekcioglu et al. 2021):
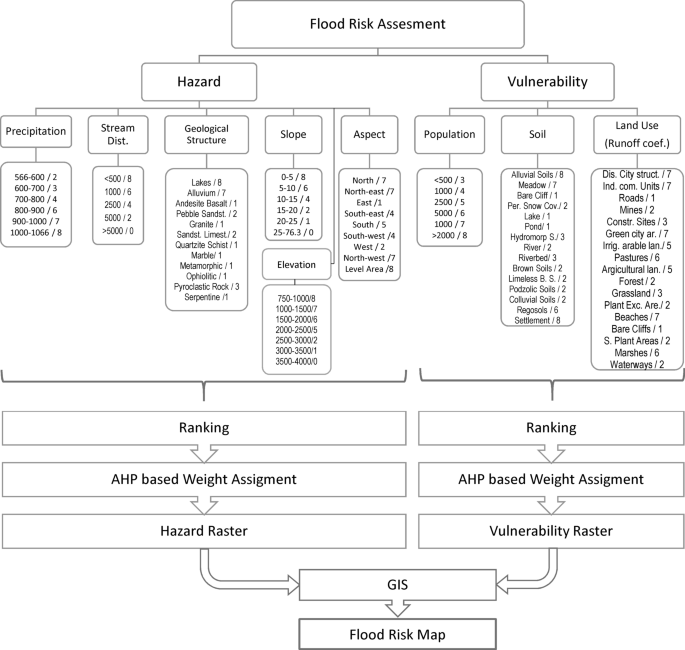
Hierarchical framework of the flood risk assessment
The criteria affecting the selection decision should be determined correctly to implement the spatial analysis process. Precipitation, distance to river, slope, geological structure, elevation, aspect, population, soil and land use were considered as flood risk decision criteria. The data of these criteria were obtained from the open access sources of the relevant institutions (HGM 2021; USGS 2021; Geofabrik 2021; TAD 2021; Copernicus 2021; MTA 2021; TUIK 2021; MGM 2021; Climate-Data 2021).
The pairwise comparison matrix in Table 4 was formed by scoring each criterion according to the scales (1–9) in Table 2 based on the expert's opinion. The normalization matrix in Table 5 was calculated by dividing each score in Table 4 by the sum of its relevant column. The weights vector of the criteria was obtained by averaging each row of the normalized vector given in the last column of Table 5. After computing the priorities matrix using Eq. (2), the maximum eigenvalue (λmax) was calculated as 9.538 by Eq. (3). According to Table 3, Eqs. (4) and (5), RI, CI and CR values were estimated as 1.45(for 9 criteria), 0.067 and 0.05 respectively. Since the consistency ratio, CR = 5%, is less than 10%, the comparison matrix is considered to be consistent. As a result, the weights were determined as the precipitation of 22%, the distance to stream of 34%, the slope of 13%, the land use of 11%, the soil 6%, the geological structure of 6%, the elevation of 3%, the aspect of 3% and the population 2% based on the AHP.
Spatial analysis
After the layers representing each criterion and their weights were determined by AHP, a common projection was created using ArcGIS. For this, first, the projection system of all criteria has been checked and if there is any difference, it has been converted into a common projection system via Arctoolbox–Projections and Transformations–Raster Protect in ArcGIS. Then, raster data were reclassified by means of Arctoolbox–3D Analyst Tools–aster–Reclass. After the classification process, the data were converted into vector data via Conversion Tools–From Raster–Raster to Polygon. Finally, vector data were integrated via Data Management Tools–Generalization–Dissolve. Data Management Tools–Fields–Add Field tool was used to enter the scoring values into the attribute table of each criterion.
The raster maps of the study area prepared for each criterion are presented in Fig. 4. The amount of precipitation given in Fig. 4a is the most effective criteria on the flood hazard. These values are taken from the annual precipitation averages of the study area. As the other two criteria influencing flood hazard, the distance to stream and the slope are given in Fig. 4b and c. As the areas close to the stream will be the most affected by floods, the closing to streams increases the flood risk scores. On the other hand, since the slope will increase the flow velocity and the floodwater will be carried to lower elevations quickly, the places with low slopes have higher risk scores than those of high slopes. As can be seen, there is an inverse relationship between these two criteria. In other words, while the slopes are high in the southern regions where the river density is high, the slopes are low in the northern regions where the rivers are less. Which of these two criteria has more weight on the flood is determined by the pairwise comparison matrix given in Table 4. Another parameter effective on the flood is the runoff coefficient. Since the amount of runoff from precipitation is higher in the region with high runoff coefficient, the risk score is higher as seen in Fig. 4d. Here, the runoff coefficients were obtained according to the land use data based on USDA (1986). In Fig. 4e and f, the soil and geological structure of the study area were scored. Considering the effect of these criteria on permeability and flow, scoring was done by taking expert opinion. In the elevation data in Fig. 3g, high regions were scored as low risk, while low elevation was scored with the higher risk, because the low regions have higher flood potential. In the aspect scoring in Fig. 4h, the northern faces, where snow accumulations are more common, and the southern faces, where snowmelt will be high, have high-risk scores, while the highest risk points are given to flat areas. The population density is given in Fig. 4i where provincial and district centers with dense populations have higher risk scores.

Raster maps of the criteria
The final map in Fig. 5 was obtained by using the GIS technique by applying the weights obtained from the AHP to the scoring given with these maps. This map represents the flood risk map of the study area. According to this risk map, regions close to the stream bed and areas with high population density are highest flood risk areas, as expected. On the other hand, it is seen that relatively flat lands close to the stream beds are moderate risky, while the high areas far from the main streams are low risk. The high precipitation together with the stream density is the main reason for the high risk at low elevations in the northwest region. Population densities in city centers such as Bitlis, Tatvan, Ahlat, Adilcevaz and Güroymak, which are close to the stream beds, are another important factor that increases the flood risk level. The average risk in the southern regions is due to low land slope and moderate precipitation. The risk map also coincides with the flood events of the settlements in the study area given in Table 1.

Flood risk map
The flood risk map in Fig. 5 also marked the actual floods events in the past presented by Ekinci et al (2020). Accordingly, 43 of the 46 flood events in the past overlap with the high-risk areas on the map. In other words, the correspondence rate of past floods with the map is 93%. This ratio shows that the flood risk map obtained from the study is of high accuracy.
Locally, the following settlements are determined as the highest flood risk; in the center of Bitlis, around Bitlis Stream, Kokarsu, Geçitbaşı, Dereağzı, Kavakdibi, Yolcular, Doğruyol, Ilıcak, Aşağı Yolak, Çeltikli, Yarönü and around Kocaçay passing through Çobansuyu, around Boğazönü's Yuvacık Stream and Gümüşkanat Stream in Mutki, Newborn, Çitliyol, Beşevler, Bozburun, Yalıntaş, Göztepe Village, surroundings of Gümüşkanat stream in Özenli, in areas close to the stream bed of Gayda Village in Hizan, in Değirmenköy around Iron marshes in Güroymak, Yeniköprü stream surrounding areas in Ahlat and in the Nazik village, which is close to Lake Nazik.
Conclusion
Floods are one of the most common natural disasters on earth, resulting in loss of life and property. Especially in places with high precipitation regime and stream density, flood risks are also high with population density. As with other disaster risks, determining the flood risks of a region is important for effective disaster management. In this study, the flood risk assessment of the study area in the east of Turkey and within the borders of the province of Bitlis, which has a microclimatic behavior, was carried out with AHP supported by GIS. As a result of the study, it has been observed that especially the south-western regions are exposed to high flood risk where the stream density and precipitation are high. However, the high slope and rugged nature of this region restrict the risk mainly to the vicinity of low elevation streams. On the other hand, due to the average precipitation and relatively lower slope, the flood risk in the northern regions is at a moderate level and spreads over a wider area. Urban centers with the high population density, which have the greatest vulnerability on risk, are seen as the highest risk areas. Moreover, high-elevation regions with low stream density were obtained as low flood risk regions. It was observed that the obtained risk zones coincide with the places where flood events occurred before.
With the effect of population and global warming, the risks posed by floods are increasing day by day. Predicting flood events with such techniques would make significant contributions to pre-disaster planning in order to prevent loss of life and property. The study showed that GIS-based AHP is a very successful approach in modeling multi-parameter decision-making problems.
Data availability
Some or all data, models, or code that support the findings of this study are available from the corresponding author upon reasonable request.
References
AFAD (2019) Overview of 2019 and natural event statistics within the scope of disaster management, T.R. Ministry of Interior, Disaster and emergency management presidency, www.afad.gov.tr. Access Date: 26.01.2022.
Aher PD, Adinarayana J, Gorantiwar SD (2013) Prioritization of watersheds using multi-criteria evaluation through fuzzy analytical hierarchy process. Agric Eng Int CIGR J 15:11–18
Arınç K (1996) Flood and Flood Disaster in Bitlis. Atatürk University, Faculty of arts and sciences, Turkish Geography Research and Application Center, III. Geography Symposium (in Turkish)
Aydin MC, Isik E (2015) Evaluation of ground snow loads in the micro-climate regions. Russ Meteorol Hydrol 40(11):741–748
Aydin MC, Yaylak MM (2016) Flood hydrology of bitlis stream. BEU J Sci 5(1):49–58
Budayan C (2019) Evaluation of delay causes for BOT projects based on perceptions of different stakeholders in Turkey. J Manag Eng 35:04018057. https://doi.org/10.1061/(ASCE)ME.1943-5479.0000668
Can G (2019) Using geographical information systems and analytical hierarchy method for site selection for wind turbine plants: the case of Çanakkale province, Master Thesis, Graduate School of Natural and Applied Science, Çanakkale Onsekiz Mart University, Turkey.
Chakraborty S, Mukhopadhyay S (2019) Assessing flood risk using analytical hierarchy process (AHP) and geographical information system (GIS): application in Coochbehar district of West Bengal. India Natural Hazards 2019(99):247–274. https://doi.org/10.1007/s11069-019-03737-7
Climate-Data (2021) https://tr.climate-data.org/ , Access date: 16.12.2021.
Copernicus (2021) Data of land use from Copernicus land Monitoring Service. https://land.copernicus.eu/ Access date: 16.12.2021.
Dagdeviren M, Akay D, Kurt M (2004) Analytical hierarchy process for job evaluation and application. J Fac Eng Arch Gazi Univ 19(2):131–138
Dahri N, Abida H (2017) Monte carlo simulation-aided analytical hierarchy process (AHP) for flood susceptibility mapping in Gabes Basin (southeastern Tunisia). Environ Earth Sci 76:1–14. https://doi.org/10.1007/s12665-017-6619-4
Dandapat K, Panda GK (2017) Flood vulnerability analysis and risk assessment using analytical hierarchy process. Model Earth Syst Environ 3:1627–1646. https://doi.org/10.1007/s40808-017-0388-7
Darko A, Chan APC, Ameyaw EE, Owusu EK, Parn E, Edwards DJ (2019) Review of application of analytic hierarchy process (AHP) in construction. Int J Constr Manag 19:436–452. https://doi.org/10.1080/15623599.2018.1452098
Ekinci R, Buyuksarac A, Ekinci YL, Isik E (2020) Natural disaster diversity assessment of Bitlis Province. J Nat Hazards Environ 6(1):1–11. https://doi.org/10.21324/dacd.535189
Ekmekcioglu O, Koc K, Ozger M (2021) District based flood risk assessment in Istanbul using fuzzy analytical hierarchy process. Stoch Env Res Risk Assess 35:617–637. https://doi.org/10.1007/s00477-020-01924-8
Geofabrik (2021) Maps and Data, https://www.geofabrik.de/data/ Access date: 16.12.2021.
Ghosh A, Kar SK (2018) Application of analytical hierarchy process (AHP) for flood risk assessment: a case study in Malda district of West Bengal, India. Nat Hazards 94:349–368. https://doi.org/10.1007/s11069-018-3392-y
Gurgun AP, Koc K (2020) Contractor prequalification for green buildings–evidence from Turkey. Eng Constr Archit Manag 27:1377–1400. https://doi.org/10.1108/ECAM-10-2019-0543
Hajkowicz S, Collins K (2007) A review of multiple criteria analysis for water resource planning and management. Water Resour Manag 21:1553–1566. https://doi.org/10.1007/s11269-006-9112-5
Hammami S, Dlala M, Zouhri L et al (2019) Application of the GIS based multi-criteria decision analysis and analytical hierarchy process (AHP) in the flood susceptibility mapping (Tunisia). Arab J Geosci 12:1–16. https://doi.org/10.1007/s12517-019-4754-9
HGM (2021) Republic of turkiye ministry of national defence general directorate of mapping. Turkish administrative borders data. https://www.harita.gov.tr/ Access date: 16.12.2021.
Masood M, Takeuchi K (2012) Assessment of flood hazard, vulnerability and risk of mid-eastern Dhaka using DEM and 1D hydrodynamic model. Nat Hazards 61:757–770. https://doi.org/10.1007/s11069-011-0060-x
Meshram SG, Alvandi E, Singh VP, Meshram C (2019) Comparison of AHP and fuzzy AHP models for prioritization of watersheds. Soft Comput 23:13615–13625. https://doi.org/10.1007/s00500-019-03900-z
MGM (2021) Precipitation Data, Climate-Data, Turkish State meteorological service, https://www.mgm.gov.tr/, Access date 16.12.2021.
MTA (2021) Data of geological structure from GeoScience Mab Viewer and Drawing Editor, General directorate of mineral research and expolaration of Türkiye, http://yerbilimleri.mta.gov.tr/anasayfa.aspx Access date: 16.12.2021.
Myers JH, Alpert MI (1968) Determinant buying attitudes: meaning and measurement. J Mark 32(4):13–20
Papaioannou G, Vasiliades L, Loukas A (2015) Multi-criteria analysis framework for potential flood prone areas mapping. Water Resour Manag 29:399–418. https://doi.org/10.1007/s11269-014-0817-6
Saaty TL (1980) The analytic hierarchy process. McGraw-Hill, New York, New York, pp 20–25
Saaty TL (1990) How to make a decision: the analytic hierarchy process. Eur J Oper Res 48(1):9–26
Seejata K, Yodying A, Wongthadam T, Mahavik N, Tantanee S (2018) Assessment of flood hazard areas using analytical hierarchy process over the lower Yom Basin, Sukhothai Province. Procedia Eng 212:340–347. https://doi.org/10.1016/j.proeng.2018.01.044
Sepehri M, Malekinezhad H, Jahanbakhshi F et al (2020) Integration of interval rough AHP and fuzzy logic for assessment of flood prone areas at the regional scale. Acta Geophys. https://doi.org/10.1007/s11600-019-00398-9
Sevgi Birincioglu, E (2021) Disaster risk analysis of Bitlis province using geographical information systems and analytical hierarchy method. Master Thesis, Bitlis Eren University Graduate Education Institute, Department of Emergency and Disaster Management, Turkiye.
Sinha R, Bapalu GV, Singh LK, Rath B (2008) Flood risk analysis in the Kosi river basin, North bihar using multi-parametric approach of analytical hierarchy process (AHP). J Indian Soc Remote Sens 36:335–349
Souissi D, Zouhri L, Hammami S et al (2019) (2019) GIS-based MCDM–AHP modeling for flood susceptibility mapping of arid areas, southeastern Tunisia. Geocarto Int 10(1080/10106049):1566405
Stefanidis S, Stathis D (2013) Assessment of flood hazard based on natural and anthropogenic factors using analytic hierarchy process (AHP). Nat Hazards 68:569–585. https://doi.org/10.1007/s11069-013-0639-5
Subramanian N, Ramanathan R (2012) A review of applications of analytic hierarchy process in operations management. Int J Prod Econ 138:215–241
SYGM (2020a) Firat – Dicle and lake van basin flood management plan, Ministry of agriculture and forestry general directorate of water management. Ankara Turkey.
SYGM (2020b) Van lake basin flood management plan. Ministry of agriculture and forestry, general directorate of water management, department of flood and drought management in Turkey.
TAD (2021) Agricultural land evaluation portal (TAD Portal), Republic of Turkey ministry of agriculture and forestry general directorate of agricultural reform. https://www.tarimorman.gov.tr/ Access date: 16.12.2021.
Timor M (2011) The analytical hierarchy process. Turkmen Bookstore, Istanbul, 29–51 (in Turkish).
TUIK (2021) Population data from data portal for statistical, Turkish statistical institute, https://data.tuik.gov.tr/ Access date: 16.12.2021.
USDA, 1986. U.S. Department of agriculture, U.S. soil conservation service. Technical release 55: Urban hydrology for small watersheds, available from NTIS (National technical information service), NTIS #PB87101580, http://www.evergladesplan.org
USGS (2021) EarthData and digital elevation model (DEM) for Bitlis province, United States geological survey (USGS). https://www.usgs.gov/ Access date: 16.12.2021
Wang Y, Liu J, Elhag T (2008) An integrated AHP-DEA methodology for bridge risk assessment. Comput Ind Eng 54(3):513–525
Wang Y, Li Z, Tang Z, Zeng G (2011) A GIS-based spatial multicriteria approach for flood risk assessment in the Dongting Lake region, Hunan, central China. Water Resour Manag 25:3465–3484. https://doi.org/10.1007/s11269-011-9866-2
Wisner B, Blaikie P, Cannon T, Davis I (2004) At risk, natural hazard, people’s vulnerability and disasters, 2nd edn. Routledge, London, pp 49–52
Yang XL, Ding JH, Hou H (2013) Application of a triangular fuzzy AHP approach for flood risk evaluation and response measures analysis. Nat Hazards 68(2):657–674. https://doi.org/10.1007/s11069-013-0642-x
Acknowledgements
This study has been derived from a part of Sevgi Birincioğlu’s (2021) master thesis.
Funding
The authors received no specific funding for this work.
Author information
Authors and Affiliations
Corresponding author
Ethics declarations
Conflict of interest
The authors declare that they have no conflict of interest.
Additional information
Publisher's Note
Springer Nature remains neutral with regard to jurisdictional claims in published maps and institutional affiliations.
Rights and permissions
Open Access This article is licensed under a Creative Commons Attribution 4.0 International License, which permits use, sharing, adaptation, distribution and reproduction in any medium or format, as long as you give appropriate credit to the original author(s) and the source, provide a link to the Creative Commons licence, and indicate if changes were made. The images or other third party material in this article are included in the article's Creative Commons licence, unless indicated otherwise in a credit line to the material. If material is not included in the article's Creative Commons licence and your intended use is not permitted by statutory regulation or exceeds the permitted use, you will need to obtain permission directly from the copyright holder. To view a copy of this licence, visit http://creativecommons.org/licenses/by/4.0/.
About this article

Cite this article
Aydin, M.C., Sevgi Birincioğlu, E. Flood risk analysis using gis-based analytical hierarchy process: a case study of Bitlis Province. Appl Water Sci 12, 122 (2022). https://doi.org/10.1007/s13201-022-01655-x
Received:
Accepted:
Published:
DOI: https://doi.org/10.1007/s13201-022-01655-x