
Abstract
Floodplains provide a multitude of ecosystem functions and services with water purification being one of them. For this study we modelled the retention of total phosphorous (TP) in the floodplains of the river Rhine and the river Elbe, looking at sediment deposition as the main process responsible for removing TP from rivers during inundation events. We applied two different approaches: a proxy-based approach (PBA) and a one-dimensional model based approach (MBA). We used both to calculate the yearly TP retention and compared it with the annual TP load in the rivers. Compared to the transported river load the Elbe floodplains investigated retained approx. 4.9% TP resp. 1.4% (PBA vs. MBA) while in the floodplains of the river Rhine about 1.8% vs. 0.3% TP was retained. We found that the greatest difficulty in quantifying TP retention in floodplains is due to the lack of spatial detail on the hydrological connectivity between rivers and their adjacent floodplains and that a sound validation of the results is absolutely necessary. Long-term monitoring data for floodplains, especially on hydrological connectivity, are of crucial importance in this respect.
Introduction
Nutrient pollution is one of the major pressures on European riverine ecosystems (Grizzetti et al., 2016, EEA 2000). Grizzetti et al. (2021, pre-print) summarises that currently more than half of the water bodies in the EU are not in good ecological status, with nutrients being one of the main causes of degradation. They further note that many marine ecosystems suffer from hypoxia and eutrophication, and in estuaries and coastal waters nutrient availability from river loads is increasing sharply, causing eutrophication here too. For example, the imbalance of nitrogen and phosphorus relative to silica may be responsible for the proliferation of harmful algal blooms (Billen & Garnier, 2007). Furthermore, eutrophication affects water quality and alters the condition and functioning of freshwater and marine ecosystems. As a result, their ability to provide important ecosystem services and sustain economic activities is severely impaired (e.g. Grizzetti et al. 2016, Liquete et al. 2016, Piroddi et al. 2017, Culhane et al. 2019). As water purification is one of the most important ecosystem services that floodplains provide, they significantly support to achieve the objectives of the EU Water Framework Directive (EU WFD) (EEA 2020). There is an urgent need for nutrient control, and an important part of this is sediment and total phosphorous (TP) control. The retention of TP is strongly related to the process of sedimentation. Thus particulate P is the largest fraction of TP and flood events with river water are the main source for the deposition of sediments and TP in floodplains (EEA 2018, pre-print). However, floodplains are strongly influenced by various human activities, which often lead to severe degradation (EEA 2016, Schindler et al. 2016). It is often the case that lateral connectivity in particular is disturbed (e.g. Hein et al. 2016), negatively affecting the dynamic connections between the floodplain and the main river channel (Amoros & Bornette 2002) and even leading to a permanent change in the ecosystem functions provided, such as sediment and TP retention (Funk et al. 2019). Indeed, it is more important now than ever to quantify the functionality of the remaining ecosystem functions in floodplains, since in Europe and North America up to 90% of former floodplains along main rivers have become functionally extinct (Tockner & Stanford 2002).
There are various methods to measure sedimentation rates in floodplains (e.g. Noe & Hupp 2005, Baborowski et al. 2007, Kiedrzynska et al. 2008, Gonzalez-Sanchis et al. 2015). Most of these studies refer to single case studies, small catchments or river sections, meaning that an up-scaling of TP retention rates that were obtained like this is hardly viable (Gelbrecht et al. 2005). This is also because the sedimentation process is extremely variable and depends on changing hydrology and the amounts of transported sediments (e.g. Rusjan et al. 2008, Oeurng et al. 2010). Moreover, TP retention rates were found to depend on the transported load in the river (Noe & Hupp 2005), residence time (Hoffmann et al. 2009), flow velocity (Venterink et al. 2006), vegetation type, age of the wetland, as well as geomorphological features (Steiger & Gurnell 2002), land use (Venterink et al. 2006), distance to the river and elevation (Kiedrzynska et al. 2008). Accordingly, different modelling approaches to determine TP retention do exist. Mander & Mauring (1994) built a regression model based on the assumption that TP retention in wetlands can be described as a relationship that depends on differently combined or single parameters such as nutrient load, wetland area and/or residence time or the so-called hydraulic load (HL). Other approaches combine averaged values or available landscape data with a given constant floodplain extent to calculate TP retention (e.g. Kronvang et al. 2004a and b) or to derive information on ecosystem functions directly from land use data and habitat maps (e.g. Burkhard et al. 2009, Kienast et al. 2009, Vihervaara et al. 2010, Haines-Young et al. 2012). According to Maes et al. (2012) such approaches may be feasible on large scales and for areas where data availability is limited.
All of the approaches described above are usually not able to narrow inundation areas and integrate retention processes as a function of riverine flooding. However, suitable methods are urgently needed to determine the current status of floodplain functioning with respect to TP retention. Such methods must take into account that rivers and floodplains that are disconnected by dikes and cut-off side-arms, are affected by transverse structures such as weirs and that land use changes lead to shifts in the functionality of riverine landscapes.
We developed two simple modelling approaches for the large-scale assessment of TP retention in floodplains. Various stakeholders urgently need such information, especially for future management activities such as restoration measures and land use within these landscapes, and alternatives to these simple approaches are currently not available. We integrated information about the frequency and duration of flood events as well as TP input and sedimentation patterns by using indicators that provide indirect information about hydrological connectivity and TP retention in floodplains. Here we follow Amoros & Bornette (2002) who refer to the gradient of lateral connectivity as the degree of connectivity between the various water bodies of the floodplain and the main river channel. The indicators used were the ‘status of floodplains’ (Brunotte et al. 2009), the ‘TP concentration in rivers’ (Natho et al. 2020) and the ‘hydraulic load’ (Behrendt & Opitz 2000).
By using these we hypothesized that simple models can be used to estimate TP retention in floodplains and provide reliable results even with imperfect data. We tested this hypothesis by implementing a model-based approach (MBA) and a proxy-based approach (PBA) to quantify TP retention in floodplains and compared the results with data from a field study. We discussed the credibility of our results and even introduced model adaptations.
METHODOLOGY.
Study sites
The floodplains under investigation are located along the rivers Elbe and Rhine (Fig. 1). Both are among the largest rivers in Germany, experiencing winter and/or early spring floods. Data about length, load and TP concentration of the two rivers are given in Table 1. The remaining active (regularly flooded) floodplains along the river Elbe account for 56,978 ha (19.4%) and similarly along the Rhine 45,384 ha (20%) of active floodplains remain (Brunotte et al. 2009). The ‘status of floodplains’ along the Elbe is predominantly classified as ‘slightly modified’, whereas along the Rhine it ranges from ‘slightly modified’ to ‘totally modified’ (Brunotte et al. 2009). We selected one case study for each floodplain to test the two different modelling approaches: ‘Schönberg Deich, (SbD)’ (215 ha) − an active Elbe floodplain that is regularly flooded every spring and ‘Kühkopf-Knoblochsaue’ (KkK)’ (2318 ha) − a Rhine floodplain that used to be partially dammed but was completely reconnected to the Rhine in 1983.

Study sites along the river Elbe (right) and the river Rhine (left) (MBA:River length is indicated by the used gauges, PBA: river length according to Brunotte et al. (2009), for the Elbe river without the tidal Elbe)
Only for the case study SbD (Elbe) data on sedimentation and TP input were available for the years 1997/98, 1998/99 and 2005, corresponding to flood events (Rupp et al. 2000, Büttner et al. 2006, Baborowski et al. 2007, Krüger 2015). Fifty-four sediment traps were installed prior these flood events at different locations and with varying distances to the Elbe. Sediment weight was measured after each flood and TP input was analysed as TP in g kg−1 sediment (data 2000, unpublished). For the analysis we divided the active floodplain into two sections. In the first section highest TP input was found near the river, within a 45 m strip (buffer 1, approx. 21 ha) with an average inundation duration per flood event of approx. 23 days. The second section lies behind this virtual line up to the dike (buffer 2 approx. 197 ha). This is additionally influenced by pressurised water and has an average flooding duration per flood event of up to 51 days. From the event-related TP input at the traps, a mean TP input per hectare and year was determined for the respective spatial sections (buffer 1, buffer 2).
Model-based approach (MBA)
The MBA calculates TP retention rates based on the inundated area (submodel 1) (Natho et al. 2013), the water volume and the TP load (runoff and concentration from measuring points upstream) entering this area (submodel 2). It therefore takes into account different hydrological conditions on a monthly and annual basis. The MBA combines the TP retention model developed by Behrendt (1996) and applied in Venohr et al. (2011) (submodel 3, described in Fig. 2 as RTP% of total transported river load) with submodel 1 (for inundated areas) and submodel 2 (for discharge and load entering the inundated floodplain). This data is derived from the 1D hydrodynamic numeric Software model SOBEK by Delft Hydraulics implemented in the software FLYS 2.1.3 (BfG 2017). FLYS serves as a quick visualising tool for discharges given at official gauges along Federal Waterways. Modelled FLYS results of selected smaller floods were plotted against the inundated area (percent of the total available floodplain area). Sigmoidal functions were found to best describe the relation between discharge and inundated area as a percent (submodel 1). Additionally, static water volume for discharges given from gauge data were calculated for the floodplains and the rivers individually. The discharge given from gauge data was then plotted against the discharge entering the floodplain as a percentage of the entire discharge from the floodplains and the rivers (submodel 2). With the information about the amount of discharge entering the floodplain as a percentage, incoming nutrient loads and incoming discharges for any discharges given by discharge data in the study period were calculated (Natho et al. 2013). These steps were necessary to identify smaller floods that are of greater relevance for nutrient retention (Natho & Venohr 2014). The final selection was made with quite a few events occurring statistically during different time periods to obtain enough data for the relationships between the discharge given by gauges and inundated area. In the end, we used eleven events that statistically occur on 45 days per year, up to floods that statistically only occur once in five years (see Fig. 2 and Natho & Venohr 2012). In the floodplains in our investigation water depths (FLYS, BfG 2017) and land use (Corine Land Cover 2006) as well as daily average discharge at the upstream and downstream gauge were known (Fig. 2). Flow velocity was considered by applying roughness values (Kst) and the Gauckler-Manning-Strickler algorithm to calibrate the calculated share of discharge leaving and entering the floodplain (Natho et al. 2013). In the TP retention model sedimentation as the main process was expressed by a function depending on the hydraulic load (HL) which is equal the water depth divided by residence time of the load (here sediment) respectively discharge. HL is used as the essential parameter for calculating TP retention (Behrendt 1996, Venohr et al. 2011) and calculated as the average height of a water column flowing above an area (Behrendt & Opitz 2000). It is derived from the monthly/ yearly sum of daily average (submodel 2) divided by the inundated floodplain area (submodel 1). To account for TP retention during flood events it is assumed that sediments and thus TP are equally distributed within the water column. Based on these calculations in FLYS (BfG 2017) and based on long term average discharges (MQ) we identified:
-
(i)
a wet year(MQRhineEmmerich = 131 m3s−1, MQElbeNeuDarchau = 160 m3s−1),
-
(ii)
a dry year(MQRhineEmmerich = 83 m3s−1, MQElbeNeuDarchau = 72 m3s−1) and
-
(iii)
a mean year (MQRhineEmmerich = 101 m3s−1, MQElbeNeuDarchau = 91 m3s−1).

Flowchart to describe the MBA
Proxy-based approach (PBA)
The PBA calculates TP retention potential and was developed for 79 German rivers and their adjacent floodplains with a catchment area greater than 1000 km2 (Schulz-Zunkel et al. 2012). It estimates retention on basis of following input data:
-
the extent of the active floodplain area by using 1 km floodplain segments according to the national setting for floodplains (Fig. 3) (Brunotte et al. 2009, GeoBasis-DE/BKG 2009)
-
area-specific land use data (7 classes: cropland, grassland, waters, urban areas, forest, wetlands, other), summarised from a digital land use map, scale 1:25,000) (GeoBasis-DE/BKG 2009–2012),
-
roughness values derived from land use data (Mehl et al. 2012, Supplement 1).
Fig. 3 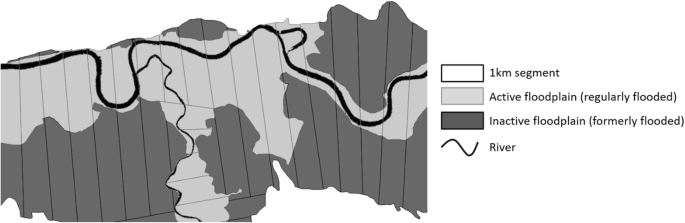
Map section of the 1 km floodplain segments with river, active and inactive floodplain areas (Data sources: Brunotte et al. 2009, GeoBasis-DE/BKG 2009), The 1 km floodplain segments were selected along the length of the river. A segment is then 1 km long in relation to the longitudinal course of the river)

The estimation procedure is based on 1 km floodplain segments, which individually collect information about rivers, active floodplains and inactive floodplains (Fig. 3).
To calculate the potential TP retention in active floodplain areas, roughness (Mehl et al. 2012) was used as a substitute for flow velocity during flood events. The TP sedimentation was estimated by TP retention proxies derived from published data (see Schulz-Zunkel et al. 2012). The calculated roughness values per land use class (Supplement 1) were area-weighted averaged for each 1 km floodplain segment. The averaged roughness values were grouped into five classes and TP retention proxies were assigned to them. These proxies were also averaged values ranging between 0.5 kg ha−1a −1 and 5 kg ha−1a−1 (Fig. 4). Measured data on TP retention in floodplains are rarely available in the literature; moreover, these datasets often show large variations among each other (see Schulz-Zunkel et al. 2012). Thus we decided to use the value of 1 kg ha−1a−1 as an anchor point for an averaged TP retention proxy in floodplains, according to Trepel (2009), who specifies a TP retention by sedimentation of 1 kg TP ha−1 a−1 for the construction of new floodplains. This value should be regarded as conservative for an average roughness and already takes into account the uncertainty that the frequency of flooding and the amount of the recent inundated floodplain is not known in detail. This conservative value also considers the fact that floodplains can be a source of TP as sediments can also be remobilised during extreme floods. Thus measured values for individual events are in some cases significantly higher than this value (Schulz-Zunkel et al. 2012). Comparable to the procedure according to Trepel (2009), rather conservative assumptions are made for all levels; based on the anchor value (level 3); the allocation of the levels 1 and 2 was carried out in −0.25 steps each, of the levels 4 and 5 in steps of +1.5 and + 2.5, respectively. Due to its special importance for TP retention, the land use class ‘water’ was given an individual proxy and was not averaged per segment. This was defined at 3 kg ha−1 a−1 (see Kronvang et al. 1999) and is supposed to reflect, again, the fact that phosphorus can be expected to be reabsorbed in floodplain waters (Kronvang et al. 2009, Wagenschein 2006).

Flowchart to describe the PBA and its further adaptation. The PBA works with database queries, e.g. if ‘roughness’ = 1 or 2 or 3 and ‘status of floodplains’ = 1 or 2 or 3 and TP concentration = mean, then level 8 should be assigned, otherwise a value from levels 1–5 should be assigned. Behind the latter (levels 1–5) lies a similar database query. This results in the assignment of one level per 1 km floodplain segment. This query brings ‘roughness’, ‘status of floodplains’ and ‘TP concentration in the rivers’ together and generates TP retention via allocated proxies into the levels 1–9)
For this study we further developed the PBA (Schulz-Zunkel et al. 2012) described above by including the parameters ‘status of floodplains’ (Brunotte et al. 2009) and ‘TP concentration in rivers’. The characterisation of the ‘status of floodplains’ is part of a German-wide data set based on the same 1km floodplain segments. It quantifies the spatial extent of rivers, active and inactive floodplains and thus the loss of floodplain area, the morphological condition, the nature conservation areas, and the land use intensity within the entire area delineated as floodplains for each of these segments. Based on this data it was possible to derive the ‘status of floodplains’ for 79 rivers in Germany with a catchment area of more than 1000km2 (Brunotte et al. 2009). Therefore we assumed that an overall good status of floodplains (class1 (very slightly modified) to class3 (moderately modified)) generally indicates good hydrological connectivity between a river and its adjacent floodplains which could result in a good performance of the floodplain functions over such stretches (Supplement 2). Combined with low flow velocities (high roughness) this may lead to a higher potential of sediment and TP deposition in these segments. We then combined this information with data about ‘TP concentration in rivers’. This is decisive for TP retention in floodplains because high discharge might decrease TP retention efficiency (Gordon et al. 2020). If, during flood events, the flooded area is large enough to retain a low HL, it indicates a very well hydrologically connected floodplain as a whole and high TP retention is possible (Natho et al. 2020, Podschun et al. 2018). Therefore, if the floodplain area is large enough, this can lead to higher TP retention and could therefore indirectly reflect the hydrological connectivity between a river and its floodplains. For this purpose, we divided the 79 German rivers investigated into three classes based on their TP concentrations according to officially accessible monitoring data (Supplement 3). This meant that if information about the ‘status of floodplains’ and the ‘TP concentration in rivers’ was available three new levels could be added to the existing PBA: level 7: 5 kg ha−1a−1, level 8: 7.5 kg ha−1a−1, and level 9: 10 kg ha−1a−1. For this adapted PBA we followed the same rule and assigned conservative proxies in steps of +2.5. Level 7 corresponds to level 5 in the original PBA, again to avoid overestimation. The adjustments are also in the lower range of the values given in the literature (Schulz-Zunkel et al. 2012). Therefore, the former TP retention classes’ level 4: 2.5 kg ha−1a−1 and level 5: 5 kg ha−1a−1 could be adjusted into level 9: 10 kg ha−1a−1, level 8: 7.5 kg ha−1a−1 and/or level 7: 5 kg ha−1a−1 (the same as level 5). Level 1 to 3 were assumed to be unchanged resp. constant, as here the roughness values ranged from ‘average’ to ‘very low’ indicating high flow velocities and thus lower sedimentation rates (Fig. 4). However, we were still not able to include data on site-specific flood events and flood durations, as such data were not available on the national level. Nevertheless, the method can be applied to individual case studies within the German study area. Therefore, we were able to extract results for the case studies ‘Schönberg Deich’ (SbD, Elbe) and ‘Kühkopf-Knoblochsaue’ (KhK, Rhine) and to compare them with collected field data at least for SbD (Elbe).
Results
Large-scale assessment of TP retention in the floodplains of the Elbe and Rhine
The PBA calculates a slightly higher TP retention within the floodplains of the Rhine (2.6 kg ha−1 a−1) compared to the Elbe floodplains (2.2 kg ha−1 a−1). Both values rather lie in the category of a dry year calculated by the MBA (Rhine: 3.0 kg ha−1 a−1, Elbe: 5.7 kg ha−1 a−1). By contrast, TP retention determined using the PBA are not confirmed by the MBA for wet years. Here TP retention even increases up to 13.8 kg ha−1a−1 for the Rhine and 24.8 kg ha−1a−1for the Elbe floodplains. The MBA calculates an annual average TP load and the actually inundated floodplain areas within the active floodplain. Therefore, the annual percentage TP retention rates between the studied years show ranges between 1.4% to 4.9% for the Elbe floodplain and 0.3% to 1.8% for the Rhine floodplain (Table 1).
TP retention in the two case studies ‘Schönberg Deich, SbD’ (Elbe) and ‘Kühkopf-Knoblochsaue, KbK’ (Rhine)
The results of the modelled TP retention are not too different for the two case studies and for the different approaches (Table 2). The PBA yielded an average TP retention of 1.13 kg ha1a−1 (Elbe) and 0.88 kg ha−1a−1 (Rhine), whereas the MBA calculated TP retention for dry to wet years between 2.6–20.5 kg ha−1 a−1 (Elbe) and 0.4–3.5 kg ha−1a−1 (Rhine). To understand the latter flood characteristics of the hydrological conditions analysed with data from the years 2002 (wet year), 1998 (average year) and 2004 (dry year) are given in Table 3. For each of these years, there are more flood events in KkK (Rhine) than in SbD (Elbe). However, except for 2002, the total number of days with floods are higher in SbD (Elbe) than in KkK (Rhine). In the wet year flood duration differs between 219 (SbD, Elbe) and 248 (KkK, Rhine) days, whereas in the dry year it ranges between 77 (SbD, Elbe) and 67 (KkK, Rhine) days. The year 1998 represents an average hydrological year for both rivers (SbD, Elbe: 92, KkK, Rhine: 90 days).
For SbD (Elbe) we also analysed existing field data about TP input for the years 1997/98, 1998/99 and 2005. This data set shows a strong relationship between sediment and TP input (Fig. 5). The averaged event-related TP input during the three flood events was 73.4 kg TP ha−1 a−1 for buffer1 and 15.8 kg TP ha−1 a−1 for buffer 2. By summing both an event-related TP retention in the entire SbD (Elbe) case study of approx. 90.4 kg ha−1 a−1 can be expected. These rates clearly surpass the modelled results.

Relationship between sediment and TP input for the measured data from ‘Schönberg Deich, SbD (Elbe)’
Integrating the parameters ‘status of floodplain’ and ‘TP concentration in rivers’ into the existing PBA
TP retention changed for all Elbe and Rhine floodplains as well as in both case studies between the current and the adapted PBA (Fig. 6). The adjusted proxies (see Fig. 4) lead to higher TP retention overall. Both, in the entire Elbe floodplains and in the SbD (Elbe), the gain is about 50%. In the Rhine floodplains and in the KkK (Rhine) the increase is about 14%. Also the distribution of the potential TP retention before and after the further development of the PBA changed (Fig. 6). This illustrates an increasing amount of 1 km floodplain segments in both the entire floodplains and the case studies with higher TP retention potentials.

Calculated TP retention in the floodplains of the Elbe (left) and the Rhine (right) and the assigned TP retention rates for two scenarios: (A) status quo = PBA without model adaptation and (B) adapted PBA. (The two case studies ‘Schönberg Deich, SbD (Elbe)’ (left) and ‘Kühkopf-Knoblochsaue, KkK (Rhine)’ (right) are shown within the rectangles
Discussion
How beneficial are field data for verifying the modelled results?
Both models provide reasonable results about TP retention. However, field data measured for SbD (Elbe) give much higher TP retention values. Only the modelled values for the wet year using MBA show comparable results to the SbD (Elbe) case study, while the calculated results of the PBA are even calculated as 80 times lower. This general underestimation of both models indicates that a transfer of single event-related, measured values to entire floodplains, investigated active floodplains or even along other river-floodplain-ecosystems is not possible. Due to the lack of spatial detail of the data on the terrain and the hydrogeological conditions (Bouwman et al. 2013), our models do not allow us to distinguish between sites with high and low TP retention. This shows that measured values cannot be fully represented by the models and the presence of flood and TP retention gradients from the river to the floodplain cannot be taken into account (see Kronvang et al. 1999, Gonzalez-Sanchis et al. 2015) as the approaches consider the active floodplain as an average unit (PBA) or the TP retention is averaged based on the incoming and hydraulic load (HL) (MBA), with the latter one known to be positively correlated to TP mass retention (Gordon, 2020). Moreover, both models are based on empirical relationships and do not consider sedimentation processes in detail, such as the further remobilisation of floodplain sediments (including P) as inherent source (Krüger 2015, Wijnhoven et al. 2006). The PBA uses vegetation roughness as a substitute for flow velocity during inundation events while the MBA uses it to calculate flow velocities. Hence, the transferability of the findings from SbD (Elbe) to larger scales needs to be ensured at least through a higher number of monitoring sites exposed to various flooding conditions (Baborowski et al. 2007) since a large proportion of TP is particle bound and therefore TP deposition is strongly related to sediment deposition (Steiger & Gurnell 2002, Noe & Hupp 2005). We also proved this with the SbD (Elbe) data set (Fig. 5). Based on this, we also equated the measured TP input with the TP retention for the purpose of comparing field data with modelled data, in the knowledge that we are ignoring the underlying processes of TP retention. The SbD (Elbe) data set indicates that even narrow floodplain areas can have a high relevance for TP input and thus retention in event-related observations (e.g. Gericke et al. 2020). However, the used field data show a high variation within and between the investigated years and imply that different flood events influence the deposition of transported sediment and the amount of deposited particulate P differently (Baborowski et al. 2007). More field data are needed and should provide data on all known multiple processes influencing TP retention in floodplains (Trentmann et al. 2020) including a detailed description of the experiment and the environment so that meta-analyses can be carried out successfully (de Groot et al. 2010). Only field studies that provide such data, including in-depth statistical analysis, enable cautious attempts to upscale measured data (Steiger & Gurnell 2002).
Credibility of the modelled results of TP retention along large rivers
We calculated that 4.9% (PBA, long term average) and 4.6% (MBA, annual average wet year) of the transported TP load (long term average, PBA vs. annual average, MBA) in the river can be retained in the Elbe floodplains. This is in line with TP retention values reported in other, similar, European and American river-floodplains (van der Lee et al. 2004, Noe & Hupp 2005, Venterink et al. 2006). The calculated retention values for the Rhine floodplains are distinctly less; ca. 1.8% (long term average, PBA) and 0.7% (MBA, annual average wet year). It is remarkable that the results between the two approaches are not that different. This is because the assumed inundated floodplain area, which forms the basis of the calculations, should be almost the same for both approaches in terms of long-term average and wet years. Moreover, the calculated TP retention in both case studies illustrates very clearly that a comparison of TP retention (kg ha−1 a−1) derived by both models is reliable allowed. These values are averaged and do not come from congruent areas, but nevertheless reflect a trend of TP retention in the floodplains of the two rivers and eliminate non-comparability through the spatial reference.
And of course the differences between the two approaches are obvious. The PBA calculates the TP retention for the entire active floodplain area and thus determines a high TP retention for KkK (Rhine) of 2047 kg a−1. The MBA only considers the actually inundated floodplain area and thus determines a maximum TP retention for KkK (Rhine) of 1069 kg a−1. Ultimately, the area-weighted TP retention of both approaches in kg ha−1 a−1 yields comparable results and shows the potential of applying the PBA. However, instead of the PBA, the MBA includes hydraulic information and data about the incoming load. Both factors reflect hydrological connectivity, which is crucial for sediment dynamics, including high spatial variability of sediment deposition in floodplains (Noe & Hupp 2005, Baborowski et al. 2007, Gonzalez-Sanchis et al. 2015). Thus a higher TP retention calculated by the MBA for the overall floodplains of the Elbe compared to the overall floodplains of the Rhine is also appropriate due to differences in the existing river morphology and ‘status of floodplains’ (Brunotte et al. 2009). The higher flow velocity in the main channel means that the exchange of water and nutrients between the river and the floodplain is lower in straight sections of the river, which is true for most of the Rhine under consideration, compared to the more meandering sections of the Elbe (see Chen et al. 2020). As a result, a comparatively smaller amount of the nutrient load transported in the river reaches the Rhine floodplains. Additionally, more natural river banks (and floodplains) along the Elbe enable inundation events during rather small floods, which are important for the nutrient cycle (Natho & Venohr 2014). Additionally, more diverse land use pattern and thus a wider range of roughness values (Mehl et al. 2012, Brunotte et al. 2009) are prevail for the active Elbe floodplains.
All these explanations support the findings obtained and the assumption that the results of the MBA are preferably more scientifically sound. This further indicates that it should be examined whether the MBA could provide the opportunity to validate the TP retention rates (see Fig. 4) used in the PBA. Here, the indicated TP retention rates are between 0.5 and 10 kg ha−1a−1 (including the levels of the adapted PBA), while the MBA generates values between 0.4 and 20.5 kg ha−1a−1. The potential to use the MBA for the validation of the PBA is possible in principle and seems to make much more sense than the use of field data. However, a corresponding post-processing is urgently required, especially since both models use simplified roughness values for the calculation and it is generally known that there are different conclusions about the influence of vegetation on flow velocity. Venterink et al. (2006) described highest deposition rates in areas with reduced flow velocities due to dominant vegetation structures such as reedbeds or reduced surface elevation e.g. ponds. Furthermore, the effectiveness of grasslands for TP retention seems to be highly variable and sometimes only temporary if several floods occur successively over a limited period (Gordon et al. 2020, Naiman & D’ecamps 1997). Steiger & Gurnell (2002) described sedimentation during flood events as being mainly dependent on elevation regardless of the managed vegetation cover.
Reliable adaptations of the PBA and application of the current PBA in practice
The PBA in particular calculates TP retention in floodplains on the basis of well-known relationships in landscape ecology. Based on the results of the MBA, which includes hydrological connectivity over the incoming load and the size of the actual inundated area, we know that hydrological connectivity is crucial to obtain scientifically sound results in terms of TP retention. By integrating the parameters ‘status of floodplains’ and ‘TP concentration in rivers’ into the PBA we were able to gain indirect information about the hydrological connectivity here, too. This is still different from the MBA, as the PBA does not contain hydraulic data or information about the incoming or transported load. However, as a result of the further development of the PBA, TP retention has doubled for the entire floodplains of the Elbe and SbD (Elbe) and increased by a factor of 1.15 for the entire floodplains of the river Rhine and the KkK (Rhine). Especially for the case studies, it becomes apparent that the improvement of the PBA has a significant impact. In KkK (Rhine) the further development of the PBA clearly shows that the integration of the ‘status of floodplains’ and the consideration of the low ‘TP concentration of the river’ Rhine have both a positive effect in the assessment. However, the ‘status of flooplains’ is already important in the original PBA since KkK (Rhine) is characterised by the land use type forests. Thus, the original PBA was already able to provide a reliable TP retention for KkK (Rhine). For SbD (Elbe) it becomes evident that the high ‘TP concentration in the rivers’ are taken into account and that the integration of the ‘status of floodplains’ is an essential factor. Here grassland is the prevailed land use class, which does not receive the highest TP retention values in the former PBA. By adding the ‘status of floodplains’ SbD (Elbe) is obviously recognised as a well-connected floodplain that can retain TP to a higher degree. With this further development, we believe that the PBA is much better suited for the evaluation of TP retention on a large scale, and that it can lead to better results especially when data are limited or little scientific expertise is available (see also Maes et al. 2012). We therefore went beyond describing the presence of ecosystem functions and services and also attempted to quantify TP retention. The development of a cascade framework with entry points for the inclusion of values from case studies, which offer the possibility to apply field or modelled data to validate the results, is already in line with the proposal of Maes et al. (2012) for such PBAs. We were careful not to over-simplify our approach (Seppelt et al. 2011) even though we would like to provide a tool for making some preliminary estimations about the quantification of TP retention open to further validation and advancements. The value of additional information therefore comes with the understanding of the complexity and the variation of social-ecological systems, and the necessity to include this in future research projects (Renard et al. 2015).
Several studies have already used the original, not the further developed, PBA in their studies, mainly to assess the effects of different management options for TP retention in floodplains. For example Symmank et al. (2020) implemented the PBA to calculate changes in TP retention as an effect of the use of bioengineering techniques in riverbank protection instead of fixed riverbanks along the river Weser, Germany. The results show a significant gain in TP retention through changes in environmental conditions. Assuming a change in land use (reed beds) and inundation frequency due to a levelling of the slope, the bioengineering bank stabilization measure can exhibit approximately 40 times higher TP retention than conventional technical bank fixations. In conclusion, the PBA could show that bioengineering bank stabilizations can help to improve the ecosystem functioning of riverbanks in order to retain TP. Horchler et al. (2015) investigated the effects of riverbed erosion processes in the Lower Rhine and determined the TP retention with the help of the PBA. For this study the PBA was extended and parameters such as ‘the average flood duration’ (2002–2010) was calculated (INFORM, e.g. Fuchs et al. 2012) and incorporated into the PBA. In addition, areas where no effective TP retention (selected by visual examination) were eliminated and thus excluded from the analysis. As a result the PBA calculated TP retention for the studied area (3506 ha), excluding zones of settlement, of approx. 29.2 t TP per year (8.3 kg TP ha−1 a−1). The highest TP retention was found in vegetation zones near the riverbanks. According to these results, the loss of TP retention amounts to 0.2% per year with a riverbed erosion of about 2 cm a−1 and a subsequent decrease in water levels. Both approaches support our finding that the PBA has possible entry points at which further information might be included to obtain more accurate results. The level of detail can be improved by implementing flood duration information and eliminating areas that might not be effective for TP retention. Further developments of the PBA, e.g. the integration of spatial proxies for TP retention such as buffer 1 and buffer 2 (see section 2.1) could further improve the results significantly.
Uncertainties
Our study introduces two approaches that enable TP retention to be modelled in floodplains at landscape scales. Both the MBA and the PBA deliver reasonable results. However, there are still uncertainties that should ideally be confirmed with field data in the future. Initially, the calculated TP retention is based on land use classes and thus on the roughness values derived from them at the landscape level with a spatial resolution of 25 m (Schulz-Zunkel et al. 2012, Natho et al. 2013). These are considered irrespective of seasonal differences and thus their seasonal importance for flow velocity and sedimentation (see Kiedrzynska et al. 2008) is overlooked. In addition, different woodland types are not distinguished. Thus, different capacities for sediment deposition caused by heterogeneous topography, changing hydrological connectivity and altered roughness values are also excluded (e.g. Kretz et al. 2020). In the case of the Rhine floodplains, in particular, where many woodlands consist of commercial forests, often without a dense herb layer, the calculated TP retention may be partially overestimated (see Bernhart 2010). Hence, the actual proxies in the PBA for the TP retention rates per roughness class have been made rather conservatively, so that the overall assessment across the 79 floodplains in Germany is not overestimated. It is therefore likely that some of the actual values will be considerably higher. This is also true for the MBA; each land use class is represented by a conservative estimate of roughness, which generalises e.g. different types of more or less dense forest or grassland. Furthermore, the most important factor for sediment deposition and thus TP retention in floodplains, namely ‘hydrological connectivity’, could also only be considered indirectly: in the PBA with the parameters ‘status of floodplains’ and ‘TP concentration in rivers’. For the MBA, hydrological connectivity forms the basis for the underlying functions, such as the differentiation of flooded areas and nutrient input into floodplains during certain discharges. Finally, these data are also generalised for entire river stretches, without being able to take into account specific characteristics of certain river sections due to the spatial resolution of the approach. Consequently, the results are only valid for long river stretches and not for detailed observations within the considered river stretch. Therefore, at this point in time, the proxies can only be adjusted qualitatively, since generally valid field monitoring data is not available at present.
Conclusion
In this study we modelled TP retention in floodplains using sediment deposition as the process mainly responsible for removing TP from rivers and thus for improving river water quality. Two different approaches (i) based on proxies (PBA) and (ii) a one-dimensional model (MBA) were applied. For the PBA we showed that hydrologically connected floodplains can be indirectly identified with the parameters ‘status of floodplains’ and ‘TP concentration in rivers’. The MBA is able to identify the actual flooded area and the incoming load by using the hydraulic load. We were able to show that hydrologically connected floodplains are able to retain remarkable amounts of TP along large rivers. However, we found that the greatest difficulty in making substantial progress in quantifying these ecosystem functions is a lack of spatial detail in the data. Therefore, a robust validation of these approaches is required, but not possible in the absence of long-term field monitoring data for floodplains. Thus, the calculation of TP retention in floodplains remains a major challenge, and the simplicity of the PBA and the MBA presented here do not solve these problems, even if they do offer two extendable approaches to model TP retention in floodplains on the landscape scale. In 2021, twenty one years after the WFD of the EU was formed, its targets have still not been achieved and therefore such approaches can tremendously increase the importance of floodplains for improving river water quality. Nevertheless, it must be emphasized that water quality must be achieved primarily by reducing point and diffuse nutrient emissions in river systems, and retention in floodplains must only be considered as an emergency solution.
Availability of data and material
Available on request.
Code availability Not applicable.
Change history
26 August 2021
A Correction to this paper has been published: https://doi.org/10.1007/s13157-021-01481-y
References
Amoros C, Bornette G (2002) Connectivity and biocomplexity in waterbodies of riverine floodplains. Freshwater Biology. 47:761–776
Baborowski M, Büttner O, Morgenstern P, Krüger F, Lobe I, Rupp H, v. Tümpling W (2007) Spatial and temporal variability of sediment deposition on artificial-lawn traps in a floodplain of the river Elbe. Environmental Pollution 148(3):770–778. https://doi.org/10.1016/j.envpol.2007.01.032
Behrendt H (1996) Inventories of point and diffuse sources and estimated nutrient loads - a comparison for different river basins in Central Europe. Water Science Technology 33(4–5):99–107
Behrendt H, Opitz D (2000) Retention of nutrients in river systems: Dependence on specific runoff and hydraulic load. Hydrobiologia 410(1985):111–122. https://doi.org/10.1023/A:1003735225869
BfG (The German Federal Institute of Hydrology) (2017) FLYS – Flusshydrologischer Webdienst. http://www.bafg.de/DE/08_Ref/M2/03_Fliessgewmod/01_FLYS/flys_node.html
Billen G, Garnier J (2007) River basin nutrient delivery to the coastal sea: assessing its potential to sustain new production of non-siliceous algae. Marine Chemistry 106:148–160. https://doi.org/10.1016/j.marchem.2006.12.017
Bouwman AF, Bierkens MFP, Griffioen J, Hefting MM, Middelburg JJ, Middelkoop H, Slomp CP (2013) Nutrient dynamics, transfer and retention along the aquatic continuum from land to ocean: towards integration of ecological and biogeochemical models. Biogeosciences 10:1–22
Brunotte E, Dister E, Guenther-Diringer D, Koenzen U, Mehl D (2009) Flussauen in Deutschland - Erfassung und Bewertung des Auenzustandes (Riparian floodplains in Germany - survey and evaluation of floodplain conditions). Naturschutz und Biologische Vielfalt 87. Bonn-Bad Godesberg
Burkhard B, Kroll F, Müller F, Windhorst W (2009) Landscapes’ capacities to provide ecosystem services - a concept for land-cover based assessments. Landscape Online 15(1):1–22. https://doi.org/10.3097/LO.200915
CORINE Land Cover 2006 (CLC2006) Federal Environment Agency, DLR-DFD 2009. URL: http://www.corine.dfd.dlr.de/datadescription_2006_en.html; day of access: 06/09/12de Groot RS, Alkemade R, Braat L, Hein L, Willemen L (2010) Challenges in integrating the concept of ecosystem services and values in landscape planning, management and decision making. Ecological Complexity 7(3): 260–272. https://doi.org/10.1016/j.ecocom.2009.10.006
Culhane F, Teixeira H, Nogueira AJA, Borgwardt F, Trauner D, Lillebø A, Piet G, Kuemmerlen M, McDonald H, O’Higgins T, Barbosa AL, van der Wal JT, Iglesias-Campos A, Arevalo-Torres J, Barbière J, Robinson LA (2019) Risk to the supply of ecosystem services across aquatic ecosystems. Sci. Total Environ. 660:611–621. https://doi.org/10.1016/j.scitotenv.2018.12.346
EEA (2020). Why should we care about floodplains? https://www.eea.europa.eu/themes/water/european-waters/why-should-we-care-about-floodplains
EEA (2018, pre-print) Floodplains: valuable ecosystems and mitigators of flood risk
EEA (2016) Flood risks and environmental vulnerability: exploring the synergies between floodplain restoration, water policies and thematic policies. EEA Report 1/2016. Office for Official Publications of the European Communities, Luxembourg, 78 pp.
Fuchs S, Scherer U, Wander R, Behrendt H, Venohr M, Opitz D, Hillenbrand T, Marscheider-Weidemann F, Götz T (2010) Calculation of emissions into Rivers in Germany using the MONERIS model nutrients, heavy metals and polycyclic aromatic hydrocarbons. In: |Texte| 46/2010. Umweltbundesamt, Dessau-Roßlau, p 236
Fuchs E, Schleuter M, Rosenzweig S (2012) Integrated floodplain response model (INFORM) as a tool to predict effects of human impact on habitats of plants and animals along waterways. River Systems 20(1–2):41–53. https://doi.org/10.1127/1868-5749/2012/0031
Gelbrecht J, Lengsfeld H, Pöthig R, Opitz D (2005) Temporal and spatial variation of phosphorus input, retention and loss in a small catchment of NE Germany. Journal of Hydrology 304(1–4):151–165. https://doi.org/10.1016/j.jhydrol.2004.07.028
GeoBasis-DE/BKG. (2009, 2009–2012). http://www.bkg.bund.de
Gericke A, Nguyen HH, Fischer P, Kail J, Venohr M (2020) Deriving a Bayesian network to assess the retention efficacy of riparian buffer zones. Water 12:617. https://doi.org/10.3390/w12030617
Gonzalez-Sanchis M, Murillo J, Cabezas A, Vermaat JE, Comin FA, Garcia-Navarro P (2015) Modelling sediment deposition and phosphorus retention in a river floodplain. Hydrological Processes 29(3):384–394. https://doi.org/10.1002/hyp.10152
Gordon BA, Dorothy O, Lenhart CF (2020) Nutrient retention in ecologically functional floodplains: a review. Water 12:2762. https://doi.org/10.3390/w12102762
Grizzetti B, Vigiak O, Udias A, Aloe A, Zanni M, Bouraoui F, Pistocchi A, Dorati C, Friedland R, De Roo A, Benitez Sanz C, Leip A., Bielza M (2021, pre-print) How EU policies could reduce nutrient pollution in European inland and coastal waters?
Grizzetti B, Lanzanova D, Liquete C, Reynaud A, Cardoso AC (2016) Assessing water ecosystem services for water resource management. Environmental Science & Policy 61:194–203. https://doi.org/10.1016/j.envsci.2016.04.008
Haines-Young R, Potschin M, Kienast F (2012) Indicators of ecosystem service potential at European scales: mapping marginal changes and trade-offs. Ecological Indicators 21:39–53. https://doi.org/10.1016/j.ecolind.2011.09.004
Hein T, Schwarz U, Habersack H, Nichersu J, Preiner S, Willby N, Weigelhofer G (2016) Current status and restoration options for floodplains along the Danube River. Science of the Total Environment. 543:778–790
Hoffmann CC, Kjaergaard C, Uusi-Kämppä J, Hansen HCB, Kronvang B (2009) Phosphorus retention in riparian buffers: review of their efficiency. Journal of Environmental Quality 38:1942–1955. https://doi.org/10.2134/jeq2008.0087
Horchler PJ, Scholz M, Fuchs E (2015) Was würde es kosten, die Sohlerosion am Niederrhein nicht zu bekämpfen? – Versuch einer Bilanzierung der Veränderung der Auenvegetation. In: Bundesanstalt für Gewässerkunde (eds): Ökosystemleistungen – Herausforderungen und Chancen im Management von Fließgewässern. Veranstaltungen 3/2015, Koblenz, pp 100
Kiedrzynska E, Kiedrzynski M, Zalewski M (2008) Flood sediment deposition and phosphorus retention in a lowland river floodplain: impact on water quality of a reservoir, Sulejów, Poland. Ecohydrology & Hydrobiology 8(2–4):281–289. https://doi.org/10.2478/v10104-009-0022-z
Kienast F, Bolliger J, Potschin M, De Groot RS, Verburg PH, Heller I, Wascher D, Haines-Young R (2009) Assessing landscape functions with broad-scale environmental data: insights gained from a prototype development for Europe. Environmental Management 44(6):1099–1120. https://doi.org/10.1007/s00267-009-9384-7
Kretz L, Seele C, van der Plas F, Weigelt A, Wirth C (2020) Leaf area and pubescence drive sedimentation on leaf surfaces during flooding. Oecologia 193:535–545
Kronvang B, Hezlar J, Boers P, Jensen JP, Behrendt H, Anderson BA, Venohr M, Hofmann CC, Nielsen CB (2004a) Nutrient retention handbook. Water Management
Kronvang B, Hezlar J, Boers P, Jensen JP, Behrendt H, Anderson T, Arheimer B, Venohr M, Hoffmann CC (2004b) Nutrient retention handbook. Software manual for EUROHARP-NUTRET and scientific review on nutrient retention, EUROHARP report 9/2004, NIVA report SNO 4874/2004. Oslo, Norway, p 103
Kronvang B, Hoffmann CC, Dröge R (2009) Sediment deposition and net phosphorus retention in a hydraulically restored lowland river floodplain in Denmark: combining field and laboratory experiments. Marine and Freshwater Research 60(7):638–646
Krüger F (2015) Hochwassergebundener Sediment- und Schadstoffeintrag in die Auen der Mittelelbe, Dissertation. Leuphana University Lüneburg, Germany
Liquete C, Piroddi C, Macías D, Druon JN, Zulian G (2016) Ecosystem services sustainability in the Mediterranean Sea: assessment of status and trends using multiple modelling approaches. Scientific Reports 6. https://doi.org/10.1038/srep34162
Maes J, Egoh B, Willemen L, Liquete C, Vihervaara P, Schägner JP, Grizetti B, Drakou EG, LaNotte A, Zulian G, Bouraoui F, Paracchini ML, Braat L, Bidoglio G (2012) Mapping ecosystem services for policy support and decision making in the European Union. Ecosystem Services 1(1):31–39. https://doi.org/10.1016/j.ecoser.2012.06.004
Mander U, Mauring T (1994) Nitrogen and phosphorus retention in natural ecosystems. In: Ryszkowski L, Balazy S (Eds.) Functional Appraisal of Agricultural Landscape in Europe Ecological Modelling 167 (2003): 33–46
Mehl D, Steinhäuser A, Kasperidus HD, Scholz M (2012) Hochwasserretention. In: Scholz M, Mehl D, Schulz-Zunkel C, Kasperidus HD, Born W, Henle K (eds) Ökosystemfunktionen von Flussauen - Analyse und Bewertung von Hochwasserretention, Nährstoffrückhalt, Kohlenstoffvorrat, Treibhausgasemissionen und Habitatfunktion. Naturschutz und Biologische Vielfalt 124: 48–72. Bonn-Bad Godesberg
Naiman R, D’ecamps H (1997) The ecology of interfaces: riparian zones. Annual Review of Ecology and Systematics 28(102): 621–658
Natho S, Venohr M (2012) Nutrient retention in riparian floodplains on landscape scale, the necessity for a monthly retention approach. Water Science and Technology 66:2800–2807
Natho S, Venohr M (2014) Active versus potential floodplains–the effect of small flood events on nutrient retention along the river Elbe corridor (Germany). Aquatic Sciences 76:633–642
Natho S, Venohr M, Henle K, Schulz-Zunkel C (2013) Modelling nitrogen retention in floodplains with different degrees of degradation for three large rivers in Germany. Journal of Environmental Management 122:47–55. https://doi.org/10.1016/j.jenvman.2013.02.049
Natho S, Tschikof M, Bondar-Kunze E, Hein T (2020) Modelling the effect of enhanced lateral connectivity on nutrient retention capacity in large river floodplains: how much connected floodplain do we need? Frontiers in Environmental Science 8:74. https://doi.org/10.3389/fenvs.2020.00074
Noe GB, Hupp CR (2005) Carbon, nitrogen, and phosphorous accumulation in floodplains of Atlantic coastal plain rivers, USA. Ecological Applications 15(4):1178–1190
Oeurng C, Sauvage S, Sanchez-Perez JM (2010) Temporal variability of nitrate transport through hydrological response during flood events within a large agricultural catchment in south-West France. Science of the Total Environment 409(1):140–149. https://doi.org/10.1016/j.scitotenv.2010.09.006
Piroddi C, Coll M, Liquete C, Macias D, Greer K, Buszowski J, Steenbeek J, Danovaro R, Christensen V (2017) Historical changes of the Mediterranean Sea ecosystem: modelling the role and impact of primary productivity and fisheries changes over time. Scientific Reports 7. https://doi.org/10.1038/srep44491
Podschun, S.A., Albert, C., Costea, G., Damm, C., Dehnhardt, A., Fischer, C., Fischer, H., Foeckler, F., Gelhaus, M., Gerstner, L., Hartje, V., Hoffmann, T. G., Hornung, L., Iwanowski, J., Kasperidus, H., Linnemann, K., Mehl, D., Rayanov, M., Ritz, S., Rumm, A., Sander, A., Schmidt, M., Scholz, M., Schulz-Zunkel, C., Stammel, B., Thiele, J., Venohr, M., von Haaren, C., Wildner, M., Pusch, M. (2018). RESI – Anwendungshandbuch: Ökosystemleistungen von Flüssen und Auen erfassen und bewerten. IGB-Berichte Heft 31/2018, 187 S. + XIII
Renard D, Rhemtulla JM, Bennett EM (2015) Historical dynamics in ecosystem service bundles. Proceedings of the National Academy of Sciences of the United States of America 112(43):13411–13416. https://doi.org/10.1073/pnas.1502565112
Rupp, H., Krüger, F., Büttner, O., Kunert, M., Meissner, R., Muhs, K., & Witter, B. (2000). Wirkung von Hochwasserereignissen auf die Schadstoffbelastung von Auen und kulturwirtschaftlich genutzten Böden im Überschwemmungsbereich von Oka und Elbe. BMBF-Abschlussbericht
Rusjan S, Brilly M, Mikoš M (2008) Flushing of nitrate from a forested watershed: an insight into hydrological nitrate mobilization mechanisms through seasonal high-frequency stream nitrate dynamics. Journal of Hydrology 354(1–4):187–202. https://doi.org/10.1016/j.jhydrol.2008.03.009
Schindler S, O’Neill FH, Biró M, Damm C, Gasso V, Kanka R, van der Sluis T, Krug A, Lauwaars SG, Sebesvari Z, Pusch M, Baranovsky B, Ehlert T, Neukirchen B, Martin JR, Euller K, Mauerhofer V, Wrbka T (2016) Multifunctional floodplain management and biodiversity effects: a knowledge synthesis for six European countries. Biodiversity and Conservation 25(7):1349–1382
Schulz-Zunkel C, Scholz M, Kasperidus HD, Krüger F, Natho S, Venohr M (2012) Nährstoffretention. In: Scholz M, Mehl D, Schulz-Zunkel C, Kasperidus HD, Born W, Henle K (eds) Ökosystemfunktionen von Flussauen - Analyse und Bewertung von Hochwasserretention, Nährstoffrückhalt, Kohlenstoffvorrat, Treibhausgasemissionen und Habitatfunktion. Naturschutz und Biologische Vielfalt, vol 124, pp 48–72 Bonn-Bad Godesberg
Seppelt R, Dormann CF, Eppink FV, Lautenbach S, Schmidt S (2011) A quantitative review of ecosystem service studies: approaches, shortcomings and the road ahead. Journal of Applied Ecology 48(3):630–636. https://doi.org/10.1111/j.1365-2664.2010.01952.x
Steiger J, Gurnell AM (2002) Spatial hydrogeomorphological influences on sediment and nutrient deposition in riparian zones: Obervations from the Garonne River, France. Geomorphology 49:1–23
Symmank L, Natho S, Scholz M, Schröder U, Raupach K, Schulz-Zunkel C (2020) The impact of bioengineering techniques for riverbank protection on ecosystem services of riparian zones. Ecological Engineering 158. Art. 106040. https://doi.org/10.1016/j.ecoleng.2020.106040
Tockner K, Stanford J (2002) Riverine flood plains: present state and future trends. Environmental Conservation 29(3):308–330. https://doi.org/10.1017/S037689290200022X
Trepel M (2009) Nährstoffrückhalt und Gewässerrenaturierung. Korrespondenz Wasserwirtschaft 2:211–215. https://doi.org/10.3243/kwe2009.04.002
van der Lee GEM, Venterink HO, Asselman NEM (2004) Nutrient retention in floodplains of the Rhine distributaries in the Netherlands. River Research and Applications 20(3):315–325. https://doi.org/10.1002/rra.780
Venterink HO, Vermaat J, Pronk M, Wiegman F, van der Lee GEM, van den Hoorn M, Higler LWG, Verhoeven JTA (2006) Importance of sediment deposition and denitrification for nutrient retention in floodplain wetlands. Applied Vegetation Science 9(2):163–174. https://doi.org/10.1111/j.1654-109X.2006.tb00665.x
Vihervaara P, Kumpula T, Tanskanen A, Burkhard B (2010) Ecosystem services-a tool for sustainable management of human-environment systems. Case study Finnish Forest Lapland. Ecological Complexity 7(3):410–420. https://doi.org/10.1016/j.ecocom.2009.12.002
Wagenschein, D. (2006): Einfluss der Gewässermorphologie auf die Nährstoffretention – Modellstudie am Beispiel der mittleren Weißen Elster (Dissertation Brandenburgische Technische Universität Cottbus). – UFZ-Dissertation 12/2006, 110 S
Wijnhoven S, Thonon I, van der Velde G, Leuven R, Zorn M, Eijsackers H, Smits T (2006) The impact of bioturbation by small mammals on heavy metal redistribution in an embanked floodplain of the river Rhine. Water, Air, and Soil Pollution 177:183–210
Acknowledgements
The proxy-based approach (PBA) is the result of the study “Ecosystem Functions of Floodplains”, funded by the Federal Agency for Nature Conservation (BfN), Germany. The further development of this approach was carried out within the framework of the project RESI (River Ecosystem Service Index, Funding label: 033W024A-K). Further analysis with the MBA are part of the DFG funded project ‘Defining floodplain boundaries considering hydraulic and ecologic aspects as basis for the development of an integrated approach to quantify ecosystem services of floodplains on the landscape scale’, Funding label: 390612937. The FLYS team at the Federal Institute of Hydrology (BfG), namely Jörg Graf, Matthias Hammer, Marcus Hatz, Norbert Busch and Dennis Meißner not only provided the software but were also of great help during the calculations for generating the model-based approach. We thank Stephanie Ritz (BfN) for her very useful comments and Sarah Gwillym-Margianto for the first and second proof of the manuscript.
Funding
Open Access funding enabled and organized by Projekt DEAL. The proxy-based approach (PBA) is the result of the study “Ecosystem Functions of Floodplains”, funded by the Federal Agency for Nature Conservation (BfN), Germany. The further development of this approach was carried out within the framework of the project RESI (River Ecosystem Service Index, Funding label: 033W024A-K). Further analysis with the MBA are part of the DFG funded project ‘Defining floodplain boundaries considering hydraulic and ecologic aspects as basis for the development of an integrated approach to quantify ecosystem services of floodplains on the landscape scale’, Funding label: 390612937.
Author information
Authors and Affiliations
Contributions
CSZ: Conceptualization, Methodology, Investigation, Analysis, Writing - Original Draft.
MB: Collection and Analysis of field data, Writing -reviewing & editing.
TE: Writing -reviewing & editing.
HDK: Resources, Writing -reviewing & editing.
FK: Collection and Analysis of field data, Writing -reviewing & editing.
PH: Resources, Writing -reviewing & editing.
BN: Writing -reviewing & editing.
HR: Resources, Writing -reviewing & editing.
MS: Methodology, Writing -reviewing & editing.
LS: Resources, Writing -reviewing & editing.
SN: Conceptualization, Methodology, Investigation, Analysis, Writing - Original Draft.
Corresponding author
Ethics declarations
Conflicts of interest/Competing interests
Not applicable.
Ethics approval
Not applicable.
Consent to participate.
Not applicable.
Consent for publication.
Not applicable
Additional information
Publisher’s Note
Springer Nature remains neutral with regard to jurisdictional claims in published maps and institutional affiliations.
Supplementary Information
ESM 1
(DOCX 43 kb)
Rights and permissions
Open Access This article is licensed under a Creative Commons Attribution 4.0 International License, which permits use, sharing, adaptation, distribution and reproduction in any medium or format, as long as you give appropriate credit to the original author(s) and the source, provide a link to the Creative Commons licence, and indicate if changes were made. The images or other third party material in this article are included in the article's Creative Commons licence, unless indicated otherwise in a credit line to the material. If material is not included in the article's Creative Commons licence and your intended use is not permitted by statutory regulation or exceeds the permitted use, you will need to obtain permission directly from the copyright holder. To view a copy of this licence, visit http://creativecommons.org/licenses/by/4.0/.
About this article

Cite this article
Schulz-Zunkel, C., Baborowski, M., Ehlert, T. et al. Simple modelling for a large-scale assessment of total phosphorus retention in the floodplains of large rivers. Wetlands 41, 68 (2021). https://doi.org/10.1007/s13157-021-01458-x
Received:
Accepted:
Published:
DOI: https://doi.org/10.1007/s13157-021-01458-x