
Abstract
Feature recognition and manufacturability analysis from computer-aided design (CAD) models are indispensable technologies for better decision making in manufacturing processes. It is important to transform the knowledge embedded within a CAD model to manufacturing instructions for companies to remain competitive as experienced baby-boomer experts are going to retire. Automatic feature recognition and computer-aided process planning have a long history in research, and recent developments regarding algorithms and computing power are bringing machine learning (ML) capability within reach of manufacturers. Feature recognition using ML has emerged as an alternative to conventional methods. This study reviews ML techniques to recognize objects, features, and construct process plans. It describes the potential for ML in object or feature recognition and offers insight into its implementation in various smart manufacturing applications. The study describes ML methods frequently used in manufacturing, with a brief introduction of underlying principles. After a review of conventional object recognition methods, the study discusses recent studies and outlooks on feature recognition and manufacturability analysis using ML.
1 Introduction
Cyber manufacturing is a new strategy for future manufacturing systems, which draws upon such recent technologies as cloud computing, low-cost sensors, wireless communication, cyber-physical systems, machine learning (ML), and mechanistic simulation and modeling [1,2,3]. The concept of cyber manufacturing enables us to share information rapidly among a manufacturer, suppliers, customers, and governments. Given this importance, several nations and companies have globally developed new manufacturing concepts such as “Industry 4.0” by Germany, “Monozukuri” by Japan, “Factories of the Future” by Europe, and “Industrial Internet” by General Electric [4].
Due to the improved capability of big data in cyber manufacturing, finding meaningful information from the data (data mining) has drawn attention recently [5,6,7]. Accordingly, applications of ML combined with big data have generated more profit in many industries [8, 9]. Thus, many case-studies about ML applications in manufacturing fields have emerged [10, 11]. For example, the tool wear prediction model can be established by ML containing relationships of complex parameters, which is difficult via model- or physics-based predictive models [12]. Such predictive maintenance in ML improves machine intelligence. Moreover, the capability of ML can be extended to automate conventional decision-making procedures through artificial intelligence, subject to the acceptance of manufacturers. Notably, a candidate is planning a manufacturing process based on a designer’s computer-aided design (CAD) model.
The typical iterative process for production planning is as follows. Designers ascertain the mechanical drawings to meet the engineering specifications of the products. Manufacturers then verify the manufacturability of the product design. Process planners draw flowcharts and enlist required machines to minimize costs and maximize productivity and quality while satisfying the specifications. If the plan is not satisfactory, the design or specifications is altered. Iterations of the feedback flow are time-consuming, and the costs are high [13]. Furthermore, the experience or skill of manufacturing personnel, especially those from the “baby boomer” generation, has been indispensable regarding making manufacturing-related decisions. However, such individuals will be retiring over the next several decades, and their knowledge, know-how, and experience will be lost from the workforce [4]. Thus, strategies are required to replace this knowledge in the cyber manufacturing framework. In cyber manufacturing, cloud-based databases and big data may be accessed by companies from across the design and manufacturing supply chain [14]. When the designer develops a new product concept, cyber manufacturing may be used to determine manufacturing strategies, production and process plans [15], and logistics chains [16].
Among the mentioned steps, estimating manufacturability from the drawings relies on human experience and know-how. Several decades have gone into automating the process of automated feature recognition (AFR). However, there are numerous ways to recognize features and assign suitable manufacturing processes. Moreover, model complexity by interacting features hinders accurate estimation of manufacturability. Other than AFR, several tools have been proposed to reduce the losses. Technical data package (TDP) [17] is a technical description providing information from the design to the production. However, dimensions, tolerances, and product quality of a new conceptual design remain subject to substantial uncertainty [18]. Alternatively, design for manufacturing (DFM) predicts the manufacturability before accepting the production plans of the newly designed products. 80% of the avoidable costs in traditional production are generated during the initial design stages DFM is a useful tool to achieve lower costs for manufacturing new designs. Design for additive manufacturing (DfAM) provide the guide-line for product design for the additive manufacturing process [19]. Furthermore, simulation method is introduced to predict the surface accuracy of the manufacturing process [20]. Another considering factor, the tolerance are a a significant factor in deciding product quality, and that is influenced by manufacturing process. Therefore, the knowing and tolerance information of manufacturing process is import [21]. Therefore, designer still require manufacturing knowledge considering which manufacturing process will be used in their design. At the same time, AFR for manufacturing becomes challenging as the model becomes complex according to diversified demands from customers.
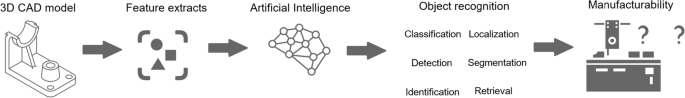
Thus, this study reviews the object recognition techniques for the manufacturing of a CAD model via the utilization of ML techniques. It covers the steps of feature recognition techniques from the CAD model and estimating manufacturability before computer-aided process planning (CAPP). Section 2 briefly describes the theoretical background of ML. Section 3 shows the research opportunities for manufacturability analysis against the backdrop of ML techniques. Section 4 mentions traditional feature extraction techniques from CAD data for manufacturability. Section 5 describes feature extraction methods from the CAD model that have the high potential to be applied in manufacturability recognition via ML techniques. Section 6 shows recent case studies. Figure 1 shows the research scope and brief history of the feature extraction process for manufacturability.
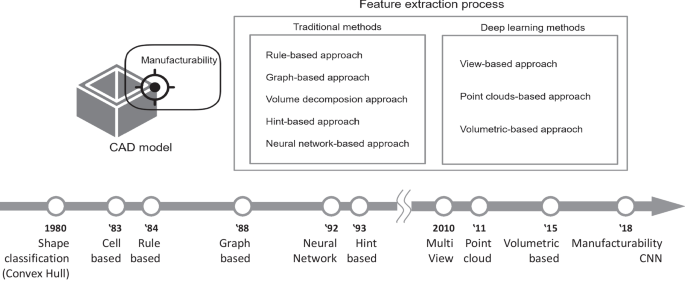
The research scope for manufacturability recognition
2 A Brief Theoretical Background of Machine Learning Techniques
2.1 Introduction to Machine Learning
ML has a characteristic of self-improving performance through learning progress. ML techniques have been applied in manufacturing fields and various interdisciplinary fields such as human pose estimation, object classification, multiple object detection, and model segmentation and reconstruction.
The representative techniques of ML are supervised ML, unsupervised-ML, and reinforcement ML. The supervised neural-net defines the classification for each data [22]. For instance, weight factors and thresholds are updated through the neural-net when the pre-classified or labeled images are fed to the neural network (NN). The trained NN then classifies the new undefined images. Unsupervised ML is the model where input data are fed without corresponding output labels. The goal of the unsupervised ML is to find meaningful relationships and hidden structures among the data [22]. Some of the unsupervised learning techniques are self-organizing maps, singular value decomposition, nearest-neighbor mapping, and k-mean clustering. The reinforcement model is a learning algorithm that obtains experiences through action and reward. The representative reinforcement learnings are Q-learning and Deep-Q-Network (DQN) [10]. The following section describes core ML techniques used in object recognition for manufacturing.
2.2 Support-Vector Machine (SVM)
A support-vector machine (SVM) is a traditional and widely-used algorithm. SVM provides answers for distinguishing different status of interests by dividing a feature space with decision boundaries. Vapnik first proposed the linear classifier algorithm in 1963. Boser et al. [23] improved the classifier for driving the decision boundaries (known as the hyperplane) using the kernel trick, which enables non-linear classification. Figure 2 and Eq. (1) describes a training dataset \({\varvec{X}}\) with \(n\) points in bilinear classification problems with two classes as \(A\) and \(B\).
where \(x_{k}\) is kth input and \(y_{k}\) is the label. Equation (2) describes the decision function \({\varvec{D}}({\varvec{x}})\) [24].
where \({\boldsymbol{\varphi}}({\varvec{x}})\) is the predefined function of \({\varvec{x}}\), \({\varvec{w}}\) is a vector orthogonal to the hyperplane, and \(b\) is a visa of the decision function. From Eq. (1), the distance between the hyperplane and the kth data point \({\varvec{x}}_{k}\) is given Eq. (3) for margin \(M\).
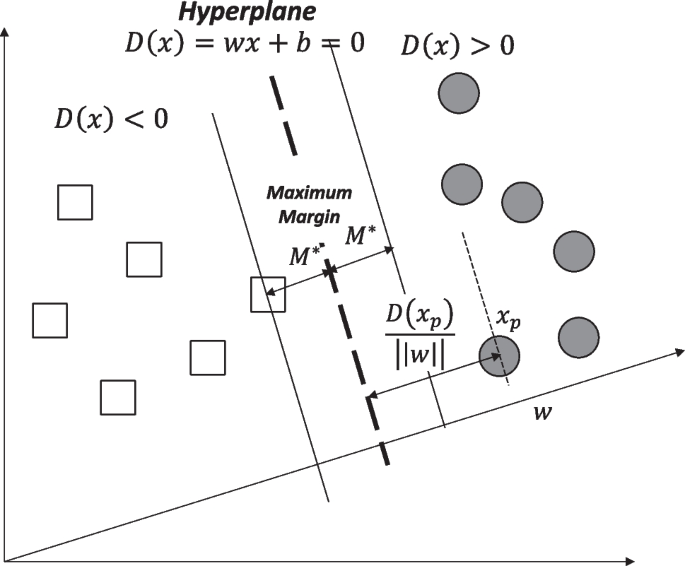
Hyperplane, samples, and a margin in 2D space within the linear case
Therefore, the maximizing margin \(M\) yields the corresponding finding sector \(\left\| {\varvec{w}} \right\|\). Further, this statement results in the minimax problem, which is equivalent to a quadratic problem [23]. Equation (4) is constrained with \(y_{k} D\left( {{\varvec{x}}_{k} } \right) \ge 1\).
Lagrangian induced the optimal solution without a local-minimum problem [25]. As mentioned above, SVM was initially designed for the linear classification problem. However, mapping input data into a higher-dimensional space can be applied to non-linear classifications using a kernel trick, as shown in Fig. 3.
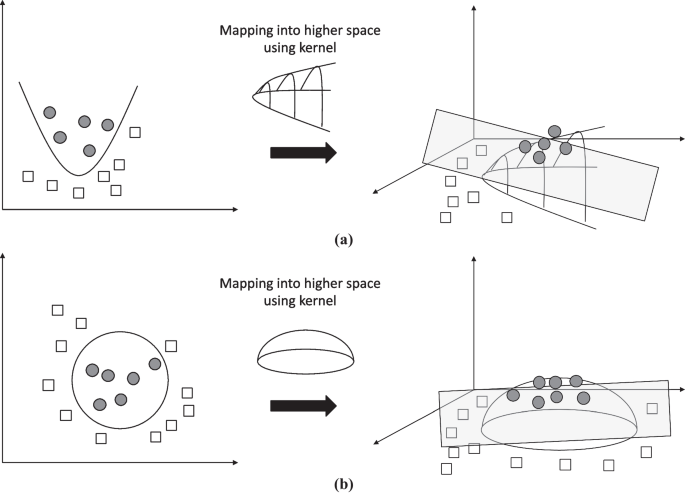
A schematics of kernel trick for a polynomial classifier and b circular classifier
2.3 Decision Tree
A decision tree is the concatenation of multiple classifiers known as leaves and internal nodes. [26, 27] defined the leaves, terminal nodes, or decision nodes without any descendants. Each node divides feature space into multiple subspaces by certain conditions in the decision tree algorithm. Figure 4 shows an example of the decision tree classifier and partitioned 2D space [27].
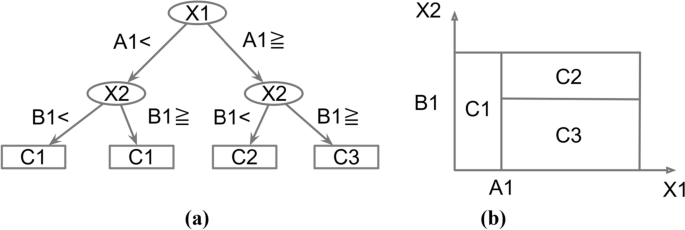
A schematic of the decision tree; a The decision tree process; b The partitioned feature space
Furthermore, it is crucial to specify structural parameters to improve the performance of the decision tree. The depth of the tree, the order of features, or the number of nodes dominate the calculation load and accuracy of the classification. Several researchers proposed the optimization of the decision tree with variant parameters. The main target of those optimizations is the structure of a tree. The iterative dichotomiser 3 (ID3) algorithm was emerged with this concept, thus implementing optimization by changing structural attributes (e.g., depth of the tree and number of nodes). This optimization that changes the inner structure of the tree is also called “greedy algorithm.” To enhance the performance of the greedy algorithm, Olaru and Wehenkel [28] developed the soft decision tree (SDT) method using fuzzy logic. The fuzzy logic-based method shows higher accuracy than the ID3-based algorithm due to adaptively assigned fuzziness. However, the greedy algorithm suffers from overfitting and updating. Thus, to update the decision tree based on the greedy algorithm with unexperienced data, the tree needs to be optimized regarding structural parameters from the beginning. However, it costs a load that is as heavy as the first-time construction. Hence, Bennet [29] improved the single-decision optimization method using global tree optimization (GTO). It is a non-greedy algorithm that considers overall decisions simultaneously. Basically, GTO starts with an existing decision tree, and it minimizes the error rate only by changing decisions, not the structural parameters of the tree. In this aspect of leaving the structure of tree unchanged, the benefit of GTO against the greedy algorithm is easy to update when it faces unprecedented information. As another approach of the non-greedy algorithm, Guo and Gelfand [30] introduced an NN-based decision tree optimization. They replaced the leaves with a multi-layer perceptron having the structure of NN. The NN-based method showed better performances with the decision tree by reducing the total number of nodes, which termed as called pruning.
2.4 Artificial Neural Network (ANN)
An artificial neural network (ANN) works like a human brain. Moreover, it has been applied to feature recognition since the 1990s. ANN is a large-scale interconnected network of neurons, which have simple elements such as an input layer, interconnected-neuron layers, and an output layer (Fig. 5a). The input layer obtains signals from external sources. These external signals are passed through the connected links between neurons; they then flow to other neuron branches through the output layer (Fig. 5b). Each node is obtained from arithmetic operations, which determine weights factors and numerical calculations during the signals flow [31]. The ANN model updates them via training from a dataset, and the model (after training) predicts the output from the test inputs reasonably. Logical rules are not used; only simple calculations are employed. Therefore, it is faster than other NN methods. The mathematical function among the neuron networks can be expressed as Eq. (5).
where \(y\) is the result through the neuron network, \(N\) is the number of inputs, \(w_{i}\) is the weight factor attributed from ith input, \(x_{i}\) is the input information, \(\theta\) is the ANN’s parameters, and \(b\) is the bias.
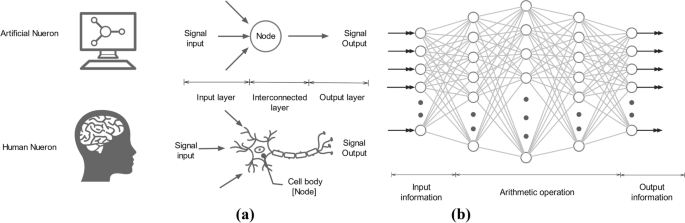
A schematic of ANN; a The neuron representation in computation comparing to a human brain; b The conceptual configuration of artificial neuron networks (ANN)
2.5 Convolutional Neural Network (CNN)
In 1998, LeCun et al. [32] proposed the CNN, which is called LeNet-5. A modern CNN has progressed through two steps called feature extraction and classification. Figure 6 shows a schematic of CNN. Feature extraction layers recognize the features from input images and generate “Feature map” in convolution layers and pooling layers. A convolution layer (or kernel) is like an image filter that extracts features from the imported input matrix. Arrays of the 2D images are imported to CNN, and it is convolved by filters to generate features maps. Equation (6) [33] represents the convolution below.
where \({\varvec{I}}\) is an imported two-dimensional array, \({\varvec{K}}\) is a two-dimensional kernel array, and \({\varvec{S}}\) is a feature map through convolutions.
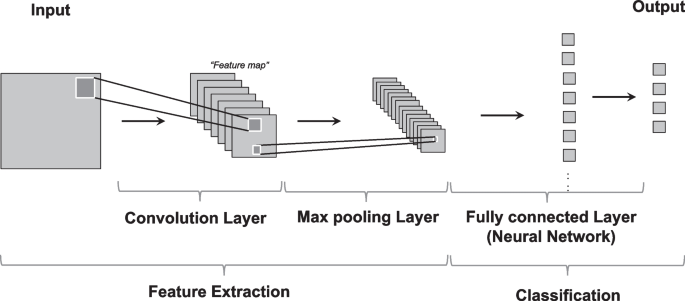
The architectures of CNN
According to the literature [34, 35], the use of convolution has three main advantages. First, the feature map shares the weight to reduce the variables. Second, the kernel extracts correlations between the localized features. Third, the sigmoid function as the activation function achieves scale invariance. From the advantages, CNN is faster and more accurate than other fully connected NN models [34, 36, 37].
The following is a pooling layer which reduces the dimensions of feature maps. The pooling layer transforms images invariantly and compresses the information. Max pooling consists of the grid or pyramid pooling structure with smoothing operation. The pooling layers provide several estimates of the sample groups at the detail levels. The max pooling method is widely used in CNN to improve performance [38]. Max pooling is given in Eq. (7) as follows.
where \({\varvec{\upsilon}}\) is the vector in the pooling dimensions, and \(f\) is a pooling operation which translates a rectangular array to a single scalar \(f(\upsilon )\). The pooling process obtains the maximum values in the rectangular dimension. For example, the max pooling layer compresses 16 × 16 features maps to 8 × 8 dimensional arrays with strides of two.
The following approaches are well-known pooling layers: stochastic, spatial pyramid, and Def. Stochastic pooling layer arbitrarily selects the activations within each pool of neurons by a multinomial distribution [39]. Max pooling is susceptible to overfitting of the training data. However, it approves the slight local deformation to avoid the overfitting issue. Spatial pyramid pooling [40] excerpts the information with restrained-lengths from the images or regions. It enables a flexible performance regardless of various scales, sizes, and ratios of input data. Therefore, the spatial pyramid pooling layer is applied to most CNN frames for better operations. Ouyang et al. [41] proposed the Def-pooling method, which is useful in handling deformation problems, such as the object recognition task or learning the deformed geometric model. The common methods (i.e., max pooling or average pooling) cannot learn object deformation patterns. Thus, the pooling layers should be purposefully selected for object learning and better performance of CNN.
The structure of fully connected layers is similar to the structure of conventional NNs that transform the 2D structure to a vector layer. The adjusted information through a fully connected layer is fed into a SoftMax function, which is placed at the end of CNN. SoftMax is the activation function that consists of real numbers between 0 and 1. Equation (8) [42] expresses SoftMax function as follows.
where \(y_{k}\) is the kth outcome, \(n\) is the number of neurons in the output layer and \({\varvec{a}}\) is a vector of the inputs.
Moreover, the loss functions evaluate the predicted values of the trained models. For the loss functions, there are two representative functions, the minimum square error (MSE) and the cross-entropy. Stochastic gradient descent (SGD) is usually used to update the weight parameters for minimizing loss functions. In summary, CNN has serial structures, such as the convolution layer, pooling layer, and fully connected layer, to provide a model of classification with high performance.
3 Research Challenges for Manufacturability Using Machine Learning
The storage capacity of computers has been increased enough to store big data for engineering. Among the types of digital data, those regarding manufacturing engineering are categorized into structured and unstructured data. Structured data stores their information as rows and columns. CSV files, enterprise resource planning (ERP), and computer logs correspond to the structured data. In contrast, unconstructed data has no restrictions from certain structures. They include videos, pictures, 3D scans, reports, and CAD models that contain the information of geometries without any descriptions [43]. Artificial intelligence (AI) can handle such unstructured data. Moreover, it is successful in its applications in manufacturing industries such as operation monitoring [44,45,46], optimization [47], inspection [48,49,50,51,52], maintenance [53, 54], scheduling [55,56,57], logistic [58], and decision support [59, 60]. In Table 1, the listed papers are explained in detail which datasets and ML methods are utilized. Table 2 recategorizes the studies in Table 1 with extra case studies and explains which input, output, and feature extraction methods are used. More examples of ML in the industries can also be found in [61], which are categorized as products (vehicle, battery, robotics, and renewable energy) and processes (steel and semiconductor) showing how classification or regression techniques with sensory input data are used to improve manufacturing. Especially, human–robot collaboration requires environmental perception and object localization in various applications [62] in which ML plays a vital role.
Several researchers have studied the design for manufacturability (DFM) techniques combined with ML to improve productivity. Ding et al. [65] proposed the detection process of critical features, such as a bounded rectangle, T-shape, and L-shape, in the hot spot point of the lithography process. The hot-spot influences contour precision in the process. Moreover, 5-dimensional vectors are width (W), length (L), coordinates in the upper-left corner (X, Y), and direction (D). The information defines the bounded rectangular features. The gray-shaded zones encircling the bounded rectangular features are represented as T-shape (T-f) and L-shape (L-f) features. Critical features are then derived in the form of (W, L, X, Y, D, T-f, L-f) at each selected target metal area. The ANN was implemented to detect hotspots resulting in over 90% of the prediction accuracy. Yu et al. [66] proposed an ML-based hotspot detection framework by combining topological classification with critical feature extractions. They formulated topological patterns by a string- and density-based method. It classified hotspot features with over 98.2% accuracy. Raviwongse and Allada [67] introduced a complexity index of the injection molding process using ANN. They defined 14 features for each molding design and searched the features in the model, which resulted in a complexity index from 1 to 10. Jeong et al. [68] used SVM to decide optimal lengths of pipes in an air-conditioner with the constraints of vibration fatigue life, natural frequency, and maximum stress. The studies mentioned above show that ML can be applied to various DFM problems beyond machinability.
Designers draw the mechanical drawings of products in various industry fields thinking which CAD design increases productivity and quality. CAD is indispensable to portrait detailed mechanical or other engineering information. However, when designers are not familiar with the knowledge of manufacturing, information can be misunderstood or missing from the perspective of expert engineers. Therefore, the “feature extraction process” has been used to analyze machinability, which finds suitable manufacturing processes from the CAD model. The expert can decide which manufacturing process is required for each feature in the CAD model. This process is difficult for a computer to perform automatically without expert-designed rules. As an alternative to full and complex implementation of the rules, ML techniques show the potential to apply the distinction of manufacturability from the CAD model. The hierarchical learning function in the deep learning technique, convolutional neural network (CNN) model, for example, enables the recognition of machinable features from several steps of using convolution kernels that are made of interesting units of basic features. In this case, it is necessary to design convolution kernels, pooling layers, and classifiers that can enhance the performance of feature extraction from CAD models. However, it is less complex than rule-based techniques.
Searching for patterns in engineering data is challenging as indicated by its long history [69]. The pattern recognition method automatically obtains the regularities of data by computer algorithms, which, in turn, accompanies classification or categorization. Dekhtiar et al. [43] mention that the five tasks of “Object Recognition” are object classification, object localization, object detection or segmentation, object identification, and shape retrieval. Pre-processing of the information or optimization of the procedures improves the speed and accuracy of “Object Recognition”. Further, ML-based feature recognition can solve the problems of “Object Recognition” without strict rules. In this context, the ML-based approaches have the potential to recognize features of DFM and manufacturability due to their simplicity, scalability, and adjustability. Figure 7 shows a summary of the research opportunities.
Research challenges for manufacturability in the CAD model
4 Conventional Feature Recognition Techniques for Manufacturability
Research about automatic feature recognition (AFR) for CAPP has been conducted for a few decades [70]. In this chapter, a brief history and ideas of previous research are introduced. The most recent studies are then reviewed. Feature recognition methods are divided into rule-based, graph-based, volume-decomposition, hint-based, hybrid, and NN methods.
4.1 Rule-Based Approach
Rule-based approaches compare model representations with patterns in the knowledge base, which consist of if–then rules. The rule-based approaches are the earliest forms of feature recognition processes. However, they lack unified criteria, leaving different interpretations for a single CAD model in addition to the concern of the processing time [71].
Henderson and Anderson [72] proposed a procedure to recognize features, as in Fig. 8a. The method is extracted from the features from a B-rep model using predefined rules between entities and features (e.g., swept and non-swept features as in Fig. 8b). Chan and Case [73] proposed a process planning tool for 2.5D machined parts by defining rules for each feature. The rules can be extended from learning shapes and their machining information. Xu and Hinduja [74] found cut-volumes from concave and convex entities in the finished model, and a feature taxonomy recognized the volumes. Sadaiah et al. [75] also developed process planning of prismatic components. Owodunni and Hinduja [76, 77] developed a method to detect six types of features according to its presence of cavity, single or multiple loop, concavity, and visibility. Abouel Nasr and Kamrani et al. [78] established a rule-based model to find features from the B-rep model, which is an object-oriented structure from different types of CAD files.
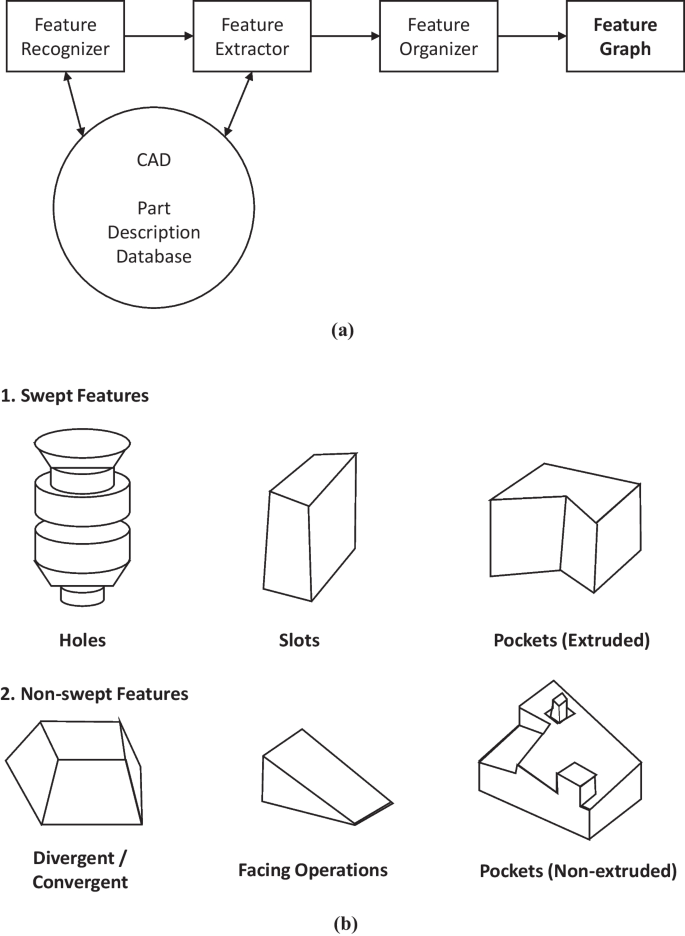
a feature extraction procedures, b categorizations of swept and non-swept features in the rule-based approach (Adapted from [72] with permission)
In addition to boundary representation (B-rep) model uses, Sheen and You [79] generated a machining tool path from slicing models. Ismail et al. [80] defined rules to find cylindrical and conical features from boundary edges. Furthermore, the rule-based approaches have analyzed features from sheet metal parts. Gupta and Gurumoorthy [81] found freeform surfaces such as protrusion and saddle from B-rep CAD models. In a further study, they developed a method to find features such as components, dents, beads, and flanges. Sunil and Pande [82] proposed a rule-based AFR system for sheet metal parts.
Recently, Zehtaban and Roller [83] developed an Opitz code, a rule to discern features from a STEP file. The predefined rule assigned a code for each component/feature are recognized via the codes. Moreover, Wang and Yu [84] proposed ontology-based AFR, as shown in Fig. 9. The model compared B-rep data from the STEP file with a predefined ontology model, which is a hierarchical structure with entities and their relations to recognize features.

An example of the subclass features using ontology (Adapted from [84] with permission)
4.2 Graph-Based Approach
B-Rep information determines model shapes by faces surrounded by line entities. Graphs of B-Rep is one of the model description methods that can represent it by multiple details with its level, which enables inexact matching by checking similarity. Moreover, regarding B-Rep, graphs represent other information such as height, curvature, geodesic distances, and the skeleton of 2D or 3D models [85]. However, this study focuses on graph-based methods regarding manufacturability.
Joshi and Chang [86] firstly introduced a graph-based approach with the attributed adjacency graph (AAG) of B-Rep polyhedral parts. A graph G = (N, A, T) (N, the set of nodes; A, set of arcs; T, set of attributes to arcs in A) defines the relationship between lines, arcs, and boundary faces. Figure 10 illustrates the example of the AAG representation. The method successfully expresses the meaningful information to recognize the features from set arcs or nodes of solid parts. However, researchers [87, 88] highlighted problems in the graph-based representations, which are characterized by the difficulty in recognizing intersections, not considering tool access, and increased data size for model complexity. For its completeness, the algorithm should define every sub-graph pattern; otherwise, it leaves ambiguous representation. The approaches are an easy way to obtain boundary information but are not suitable for volumetric representation [89].
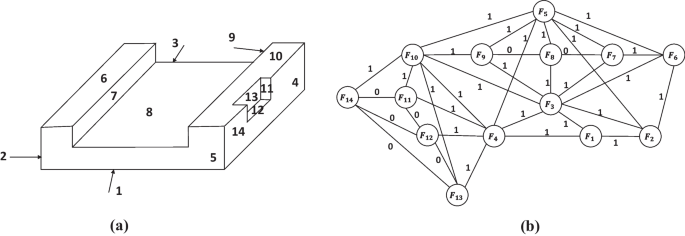
An example of AAG representation a A 3D CAD model; b The model’s AAG (Adapted from [86] with permission)
Previous research has endeavored to solve the highlighted problems. Trika and Kashyap [90] proved that if differences between a stock and a final part are not recognized by a union of all volumetric features from the algorithm, it cannot be machined. Moreover, they developed an algorithm to generate virtual links for cavity features such as steps, slots, holes, and pockets in CAD models to be recognized. Gavankar and Henderson [91] developed a method to separate protruded or depressed parts from a solid model as biconnected components in the edge. Marefat and Kashyap [92, 93] added virtual links to solve interacting features and compared the subgraphs with predefined machining features. Thus, a manufacturing plan was established automatically. Qamhiyah et al. [94] proposed a concept of “Form Features,” which are basic sets of changes from the initial shape. The Form Features are classified from the graph-based representation of boundaries. Yuen et al. [95, 96] introduced a similar concept called the primitive features (PTF) and variation of PTFs as VPTFs representing information of boundary interacting types. Ibrhim and McCormack [97] defined a new taxonomy for vertical milling processes such as depression and profusion to reduce attempts to find sub-graphs. Huang and Yip-Hoi [98] used the feature relation graph (FRG) to extract high-level features such as stepped holes for gas injector head from low-level features. Figure 11 illustrates the procedure. Verma and Rajotia [99] introduced “Feature Vector” to represent parts containing curved faces. It represents subgraphs of AAG into a single vector, which is advantageous to reduce computational time in graph-based methods. Stefano et al. [100] introduced the “Semanteme,” which are features that have engineering importance such as concave parts, axial symmetric parts, and linear sweep parts. The graph can represent those Semantemes with neighbor attributes such as parallelism, coaxially, and perpendicularity.
An example of a high-level feature recognition (Adapted from [98], open access)
In a recent study, Zhu et al. [101] found machining features from a graph-based method to optimize machining processes in a multitasking machine such as a turn-mill. After establishing AAG of the model from a STEP file, the method searched machinable volumes such as slots, bosses, and blind holes by comparing the analyzed subgraphs with predefined ones. The model categorized interacting features into four features—isolation, division, inner loop connecting, and outer loop connection. In the machining cost optimizing step, rules of process priority and turning proceeds before milling, for example, are set to reduce computational loads.
4.3 Volume Decomposition Approach
The volume decomposition approach decomposes a volume into small-scaled volumes and analyzes them to extract meaningful features. It is more advantageous to interpret intersecting features than previous methods with fewer scalability issues. However, the result may diverge due to different representations [102]. The approach consists of cell decomposition and the convex hull method.
The cell decomposition method decomposes volumes into small cells, and a combination of the cells is classified as one of the machinable features. Sakurai and Dave [103] introduced a concept of the maximal volume, which consists of minimal cells with concave edges from an object with a planar or curved surface. Shah et al. [104] also used the cell decomposition method. However, they classified volumes to possible swept volumes from a 3-axis machining center. Tseng and Joshi [105] extracted machining volumes from B-Rep data. They then divided the volumes to smaller ones and reconnected them to obtain features. Figure 12 illustrates the principle that a face and two slots are recognized as features after combining sub-volumes.
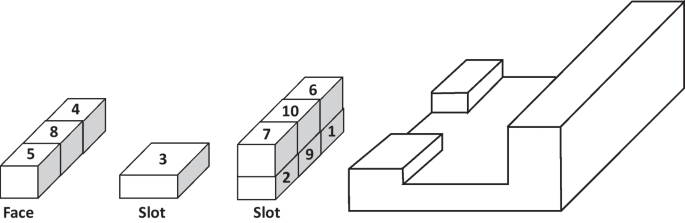
An example of the cell decomposition method (Adapted from [105] with permission)
Recently, Wu et al. [106] decomposed cutting volumes of milling and turning into cells to optimize the processes. For the turning volume, edges on 2-D cross-section divided the volume into cells with variable sizes, and the edges similarly divided milling volumes but as 3-D segmentations. These cells were optimized to reduce machining time showing better results than the hint-based or the convex hull decomposition method.
The convex hull method finds the maximum convex volumes and subtracts them from the original model, and its difference is iteratively analyzed until there is no convex volume. Researchers have developed the method since 1980 to apply it to manufacturing process plans [107,108,109,110]. Woo and Sakurai [111] proposed the concept of the maximal feature, the maximum size of the volume that is machinable with a single tool. With recursive decomposition, the maximal feature enabled the improvement of calculation time and reduced multiple feature interpretation problems.
As one of the recent studies, Bok and Mansor [112] developed algorithms to recognize regular and freeform surfaces. The method divided material removal volume (MRR) for roughing and finishing into sub-volumes such as the overall delta volume (ODV) to be machined, sub-delta volume for roughing (SDVR), and finishing (SDVF). Figure 13 illustrates the classification of the CAD model to each sub-volume. In the following research, Kataraki and Mansor [113] calculated ODV without any material removal volume discontinuity or overlaps. Thus, to achieve the goal, the ODV was classified into SDVR, SDVF, arbitrary volume to be filled (SDVF filled region) to preserve the continuity of SDVF, and volumetric features (SDV-VF) to obtain the net shape. The method divided the sub-volumes stepwise using contours and vectors. The study validated the method by comparing the calculated ODV to the manual one, and the difference was within 0.003%. Similarly, Zubair and Mansor [114] used the method for AFR of symmetrical and non-symmetrical cylinder parts for turning and milling operations. External features are analyzed from faces and edges to derive roughing and finishing volumes for turning operations. Asymmetric but turntable internal features are also detected by comparing the center of the axis. Algorithms for detecting gaps, fillets, and conical shapes are also established. The validation shows a 0.01% error level of the ODV difference.

The 3D geometric model in a Isometric top view of CAD and b isometric bottom view of CAD model (Adapted from [112] with permission)
4.4 Hint-Based Approach
The hint-based approach utilizes information in the CAD model. For example, a tab hole should have a base drill operation. The algorithm then finds a cylinder volume for the drilling. Researchers have studied the method since Vandenbrande and Requicha’s research [115]. Regli et al. [116, 117] established the concept of “trace,” a hint to find manufacturing features. For example, a trace of a cylindrical volume is an indication of the drill hole. Kang et al. [118] proposed a framework to use tolerance information such as geometry, dimension, and surface roughness to generate machining features from the STEP file format. As in Fig. 14, Han and Requicha [119] used hint ranks for the analysis to be much desirable. Meeran et al. [120] extracted manufacturing features from hints in 2D CAD drawings without hidden lines. Verma and Rajotia [121] established a complete algorithm for 3-axis vertical milling stages by finding hints from interacting features and repeatedly testing manufacturability and repairing them.
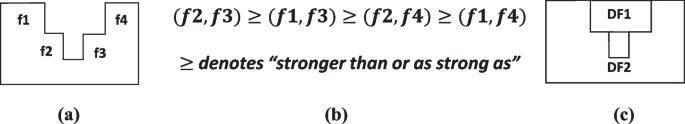
An illustration of the hint ranks; a A 2D geometry with four slot hints (f1–f4); b The calculation of ranks among the hints; c The obtained design features (DF). (Adapted from [119] with permission)
Hints are dependent on specific manufacturing features such as drill holes, slots, and channels. Thus, it is hard to find manufacturing features with new tools or new designs. However, once rules to treat hints are established, the calculation is less exhaustive than rule- and graph-based approaches [121].
4.5 Hybrid Approach
Real CAD models are complex with Boolean operations, thus leaving interactive parts. Therefore, time for feature recognition is also increased as well [122]. Several studies develop hybrid methods to find the most optimal representation of features with less time consumption. They used the NN with other methods to avoid complexity in calculating interacting features. This section illustrates the combinations of methods mentioned above. The next section describes the hybrid methods using the NNs.
First, the hint-based method can clarify interacting features as a graph representation. Gao and Shah [123] extracted isolated features from AAG but used the hint-based approach for interacting features. The hints are defined by the extended AAG with virtual links. Rahmani and Arezoo [124] combined the graph- and hint-based method. For milling parts, they analyzed milling traces by hints and represented them as graphs; thus, whole graphs consisted of known sub-graphs. Ye et al. [125] developed an extended graph of AAG to discern undercut parts from its subset, while face properties and parting lines are used as hints to find undercut features. Sunil et al. [126] used hint-based graph representation for multiple-sided features without virtual links. As shown in Fig. 15, faces sharing the same axis are bundled with their adjacencies, thus helping to find multiple sided interacting features.
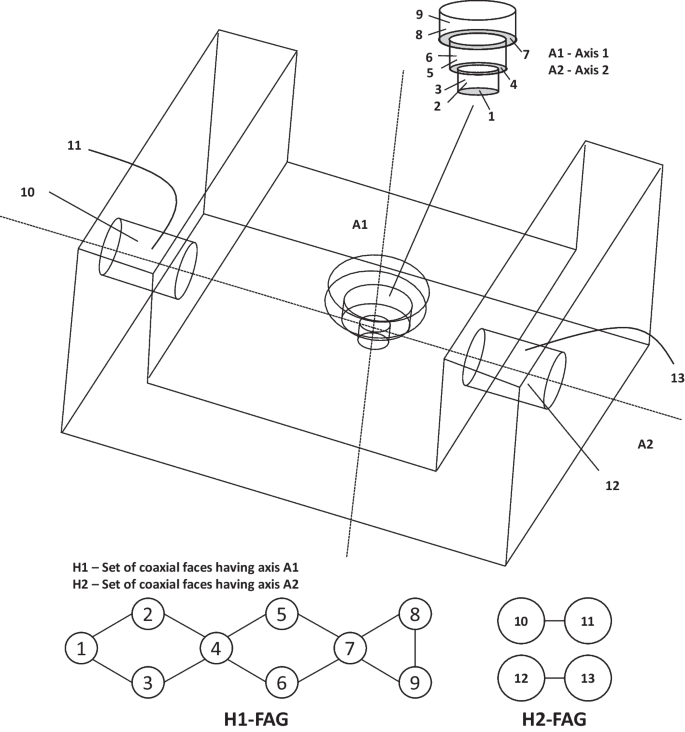
An illustration of the hints for circular holes combined with the face adjacency graph (FAG) method (Adapted from [126] with permission)
Moreover, researchers combined the volume decomposition method with other methods. Kim and Wang [127] used both the face pattern-based feature recognition and volume decomposition. Thus, to calculate stock volumes for cast-then-machined parts, the method initially searched for face patterns from predefined atomic features such pockets, holes, slots, and steps. Subrahmanyam [128] developed “heuristic slicing,” volume decomposition, and recompositing using the type of lumps. Woo et al. [129] merged graph, cell-based, and convex hull decomposition. The graph-based method filters out non-interconnecting features like holes. Maximal volume decomposition also filters out conical, spherical, and toroidal parts. Negative feature decomposition then changed negative removal volumes to machining features generating hierarchical structure of the features.
4.6 Conventional Neural Network (NN)-Based Approach
NN has the advantage of learning from examples. NN is an excellent tool for pattern recognition if there are enough datasets [130]. Prabhakar and Handerson [131] showed the potential of NN-based techniques in feature recognition. They developed an input format of the neural-net, which is a combination of the face description and face to face relationship of the 3D solid model. However, it is necessary to prepare the input strictly with the rules to construct the adjacency matrix. Nezis and Vosniakos [132] demonstrated the feature recognition of topological information such as planar and straightforward curve faces. This information was in the form of an attributed adjacency graph (AAG) that was fed to NN. The neural-net recognized the pocket, hole, passage, slot, step, protrusion, blind slot, and corner pocket, showing faster speed than the rule-based recognizer. Kumara et al. [133] proposed the super relation graph (SRG) method to identify machined features from solid models. SRG defines super-concavity and face-to-face relationships, which became the input data of the NN.
Hwang [134] described the feature recognition method from a B-rep solid model by using the “perceptron neural net.” The method used eight-element face score vectors as input data in the neural-net that enabled the recognition of partial features. The descriptor recognized simple features such as slots, pockets, blind holes, through holes, and steps. Lankalapalli et al. [135] proposed a self-organizing NN, which was based on the adaptive resonance theory (ART). The theory was applied to feature recognition from B-rep solid models. The continuous-valued vector measured the face complexity score based on convexity or concavity and assessed nine classified features. ART-NN was the unsupervised recognition methods. Moreover, it consumes less memory space. Onwubolu [136] employed a backpropagation neural network (BPN). The face complexity codes described the topological relationships. BPN recognized the nine features such as tabs, slots, protrusions, pockets, through-holes, bosses, steps, cross-slots, and blind-holes. Sunil and Pande [137] used the multi-layer feed-forward back-propagation network (BPNN). The research showed that the 12-node vector scheme could represent features such as pockets, passages, blind slots, through slots, blind steps, and through steps. Öztürk and Öztürk [138] extracted the face-score values of the complex relationships from B-rep geometries. The NN was trained from the constructed face-scores and recognized non-standard complex shapes.
Zulkifli and Meeran [139] developed a cross-sectional layer technique to search feature volumes from the solid model. This method defined the feature patterns for edges and vertices. The detected features were used as the input to the NN model, which recognized both interacting and non-interacting features. Chen and Lee [140] described the feature recognition of a sheet metal part by using an NN. The NN model classified the model into six features, including rectangles, slots, trapezoids, parallelograms, V-slots, and triangles.
Figure 16 shows the feature recognition procedures of the NN. The solid models are converted into topological information, such as graphs. They are then used to train the NN. The input model recognizes the machined features. NN-based feature recognition for machinability has been improved, and the calculation is faster than graph- or rule-based methods. However, NN needs to preprocess the input data as adjacency graphs, matrices, codes, and vectors, which describe the relationship among entities of a model.
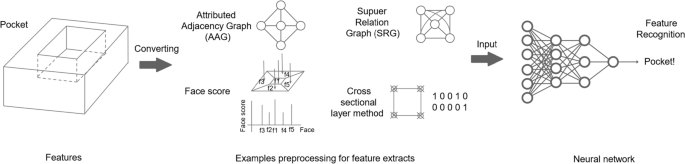
The feature recognition procedure of the NN-based approach
5 Deep Learning-Based Feature Recognition Techniques
As previously mentioned, ML techniques can be applied to various manufacturing fields. For example, NN based methods can identify features from a complex CAD design. B-rep expresses 3D CAD models as boundary entities such as faces and lines, processes data as graphs or matrix, and trains the NN model. However, when the model becomes complex, the amount of input data is increased, and solving them to several manufacturable features also becomes more difficult. Therefore, researchers have proposed several feature recognition techniques other than using the B-rep entities highlighted thus far. This section introduces the methods based on deep-learning techniques that have the potential to enhance the decision making of manufacturability in complex 3D CAD models.
5.1 View-Based Method
In the computer vision research field, researchers have studied the utilization of 2D images from the 3D CAD models for feature recognition. In recent years, it has been studied as the view-based method combined with CNN. Su et al. [141] proposed a multi-view image method for 3D shape recognition. Multi-view convolution neural network (MVCNN) extracted the features from 2D images of 12 different views. The CNN results in the images are pooled and passed to a unified CNN model. It then produces a single compact descriptor for the 3D shape. Thus, MVCNN achieved better accuracy than the standard CNN for the classification of 3D shapes. Xie et al. [142] also studied the feature learnings with multi-view depth images from the 3D model. Figure 17 shows how to obtain depth images from the projected views. Cao et al. [143] developed the spherical projected view method, which used captured images from 12-vertical stripe projection. It is similar to the multi-view method. There were two sub-captures methods, the depth-based projection, and the image-based projection. The depth-based projection determined the depth values, the distances calculated between the 3D model located in the center, and each point on the sphere. The image-based projection captured the image set on 36 spherical viewpoints, which is then used to train the CNN. The spherical representation can classify 3D models, and it showed similar performance compared to other methods. Papadakis et al. [144] proposed PANORAMA to handle large-scale 3D shape models. They obtained a set of panoramic projection images from the 3D model. Then, 2D discrete wavelet transformation and 2D discrete Fourier transformation converted the projection images to the feature images. PANORAMA provided a significant reduction of memory storage and calculation time. Shi et al. [145] introduced deep panoramic representations (DeepPano) for 3D shape recognition. Panoramic views, as a cylinder projection, detected 2D images from 3D geometry datasets. The technique showed higher accuracy than 3D ShapesNets [144], spherical harmonic (SPH) [146], and light field descriptor (LFD) [147].

The projection plane of the 3D model and captured depth images (Adapted from [142] with permission)
Johns et al. [148] suggested the pairwise decomposition method with depth images, greyscale images, or both arrangements. The image-sets were captured over unconstrained camera trajectories. This method has the advantage of training for any trajectories. It decomposed a sequence of images into a set of view pairs. Feng et al. [149] proposed a hierarchical view-group-shape architecture for content-based discrimination. The architecture is called a group-view convolutional neural network (GVCNN). Initially, an expanded CNN extracted the descriptor in a view level of the 3D shape. The proposed group module then described the content discrimination of each view. The module distinguished the view images as different groups. The architecture merged each group level descriptor with the shape level descriptor and the subsequent discriminative weight. GVCNN achieved higher accuracy for the 3D shape classification compared to SPH [146], LFD [147], MVCNN [141].
The view-based ML is acceptable in recognizing features from the 3D model using the CNN architecture. Moreover, 2D images can be retrieved from the projections of the 3D model with unstrained directions. The method can reduce the size of data while preserving the full information of the 3D model.
5.2 oud-Based methodPoint cl
The point cloud was introduced in 2011 [150]; it can represent the information of 3D shapes, effectively. A point cloud contains a set of 3D points \(\left\{ {P_{i} \left| {i = 1, \ldots ,n} \right.} \right\}\), where the vector set at the ith point (\(x,y,z\)) is each point \(P_{i}\) [131]. Figure 18a shows an example of the point cloud containing coordinates information. Qi et al. [151] designed a deep learning architecture called PointNet. They only used the three axial-coordinate information from a point cloud. PointNet has two networks, the classification network, and the segmentation network, which provides the capability of classifying 3D shapes and part segmentation. Their NN model demonstrated the high performance of 3D recognition. Fan et al. [152] showed that the point cloud is adequate for transforming and reforming 3D features. Their training data sets were formed by recovering the point cloud of a 3D structure, which is obtained from the rendering of 2D views of CAD models. Their NN model has a strong performance in reconstructing various 3D point clouds. Additionally, a mathematical method has been introduced for recovering a 3D point cloud models from 2D webcam images [153].
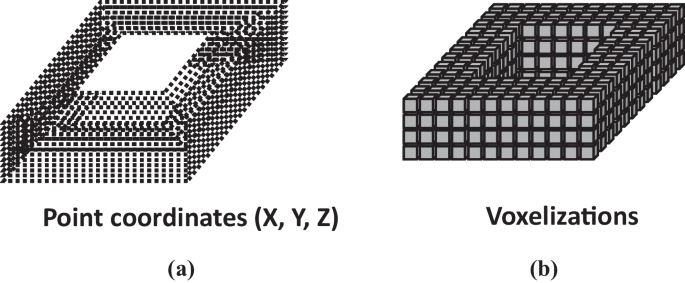
Examples of a point clouds and b voxelizations for 3D CAD models
Klokov and Lempitsky [154] proposed a deep learning architecture (Kd-Net) to recognize 3D point cloud data. They used the kd-tree, which has good performance for training–testing times to classify and segment parts. Wang et al. [155] suggested an NN model called EdgeConv. Each point contains coordinates with additional information such as color and surface normal. The κ-nearest neighbor (κ-NN) graph defined the edge features. The CNN-based model has two EdgeConv layers, implemented by pooling layers and three fully-connected layers for classification and segmentation using point clouds. It achieved a high prediction accuracy compared to PointNet or Kd-Net.
Point datasets usually consist of unconstructed information with additional noises. The expression of surfaces is mostly arbitrary with sharp geometry due to the noise. There is no representation of statistical distribution for the patterns of point cloud data. However, the approach has a less complex structure than B-rep and constructive solid geometry (CSG). Therefore, it is suitable to be applied to ML algorithms.
5.3 Volumetric-Based Methods
3D ShapeNets [156] represented 3D shapes by a probability distribution of binary variables.
Figure 18b shows an example of voxelized 3D shapes. When binary values are 1 and 0, the voxel is inside and outside of the mesh surface, respectively. The 3D shape is sliced as 30 × 30 × 30 voxels. Each voxel indicates free space, surface, or occluded in the depth map. Free space and surface voxels represented 3D objects. Further, the occluded voxels indicated the missing data of the object. This representation technique is beneficial for learning large-scale 3D CAD models. Maturana and Scherer [157] developed VoxNet to recognize a real-time object by a 3D convolutional neural network algorithm. VoxNet represented 3D shapes by using occupancy grids corresponding to each voxel. It scales to fit 30 × 30 × 30 voxelization of the 3D CAD dataset. VoxNet provided the high accuracy for the real-time feature recognition, thereby classifying hundreds of instances per second.
Qi et al. [158] developed a 3D CAD recognition technique using the combinations of voxelization and multi-view images. Multi-orientation volumetric CNN (MO-VCNN) used the captured images of the voxelated model in the various orientations, and CNN architecture extracted the features from them. However, low the resolution of as much as 30 × 30 × 30 confined the performance due to the raised bottleneck. Hegde and Zadeh [159] proposed FusionNet by combining volumetric representation with pixel representation. The 3D object representations of FusionNet are similar to MO-VCNN [158]. There are three different networks: V-CNN I, V-CNN II, and MV-CNN. The neural models were merged at the score layers to classify the 3D CAD model. The combination of representations shows a better performance in comparison to individual representation. Sedaghat et al. [160] proposed the orientation-boosted voxel nets, which is comparable to MO-VCNN. The voxel grid transformed the 3D CAD model to the volumetric voxel. CNN had two separate output layers for N-th class labels and N-th class orientations. Moreover, it attained better classification accuracy. Riegler et al. [161] proposed OctNet, where the convolutional network partitions the space of the 3D CAD model. It is a concept of the unbalanced octree, which is flexible according to the density of 3D structure. Therefore, OctNet allocates the smaller storage to represent the 3D model, which, in turn, improves the calculation speed than the octree.
Moreover, meshes represent the volumes of 3D CAD models. The meshes have advantages where they can describe deformations or transformed shapes for finite element analysis [162,163,164,165]. Kalogerakis et al. [166] studied the segmentation and labeling problem of 3D mesh data. The pairwise feature algorithm segments the mesh data of 3D models. The mesh representation outperformed the segmentation of the 3D CAD. Moreover, Tan et al. [167] developed the extraction algorithm for localized deformation. They used the mesh-based autoencoders and predicted large-scale deformations of the 3D models, such as the human pose.
6 Machine Learning-Based Feature Recognition Techniques for Manufacturability
6.1 A Large-Set of Complex Feature Recognition
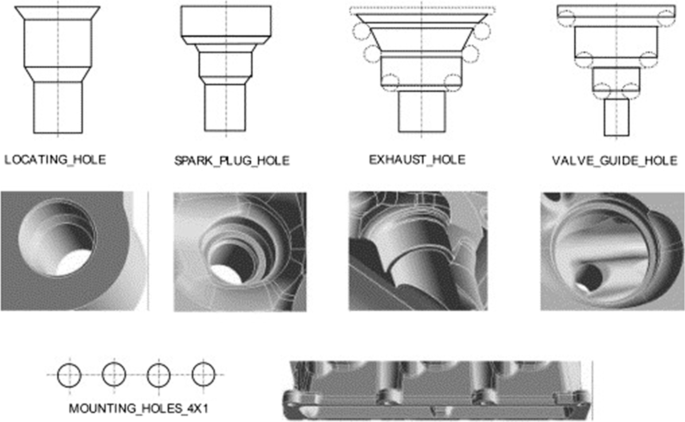
Only a limited number of studies have explored deep learning-based techniques for manufacturability. Zhang et al. [168] proposed a deep-learning-based feature recognition method, called as FeatureNet, for a large set of complex feature recognition. A set of 24 machining features (common geometries used in the industry) was selected. Figure 19 shows a set of the selected machining features. A thousand CAD models were created from 24 features using CAD software. Whole CAD models have cubic blocks with 10 cm lengths. The volume was removed from the blocks, then specific machining features were generated. The random values of feature parameters within specific ranges determined the models. Furthermore, total datasets had 144,000 models due to placing features on six faces of each block. The models were voxelized with 64 × 64 × 64 grids to feed them into the CNN network.

A set of 24 machining features of FeatureNet (Adapted from [168] with permission)
FeatureNet consists of eight layers as follows: an input layer, four convolution layers, a max-polling layer, a fully connected layer, and a classification output layer. Figure 20 depicts the CNN architecture of FeatureNet. Each convolution layer had convolutional calculations with filters to generate feature maps. Simultaneously, ReLU, as an activation function, normalized the feature maps after the convolution layers. In the subsequent fourth-convolution layer, the max-pooling layer produced down-sized feature maps. A fully connected layer classified 24 features using a Softmax activation function. FeatureNet used three optimizers, such as the stochastic gradient descent (SGD) algorithm, stochastic gradient descent with learning rate decay (SGDLR) algorithm, and Adam algorithm. The cross-entropy as an objective function was used to minimize differences between predictions and supervised levels. The total dataset of 144,000 CAD models was separated into a training set (70%), validation set (15%), and testing set (15%), respectively. The batch size and initial learning rate were 40 sets and 0.001 during the training, respectively.

The proposed architecture of the CNN network trained to recognize machining features on 3D CAD models (Adapted from [168] with permission)
The FeatureNet selected the Adam optimizer due to its faster convergence than SGD and SGD with learning rate decay (SDGLR). The test accuracy of the Adam optimizer was 96.70%. The 16 × 16 × 16 voxel resolution had a training time of 7.5 min while the 64 × 64 × 64 voxel resolution took 390 min. However, the classification accuracy of 64 × 64 × 64 voxel resolution was 97.4%, which was higher than others due to increased discretization. Moreover, FeatureNet recognized multiple machining features in the CAD models. Practical industry components have high complexity due to a combination of 24 features, as shown in Fig. 21. FeatureNet used the watershed segmentation algorithm to subdivide into single features. Figure 21 shows the prediction results for the high complexity examples. This CNN architecture classified 179 of 190 features and showed 94.21% of prediction accuracy.

Feature recognition results of the FeatureNet (Adapted from [168] with permission)
6.2 The Recognition of Manufacturable Drilled Hole
Conventional feature recognition methods in Sect. 4 are being examined for the full recognition of complex shapes in multiple manufacturing processes. FeatureNet can recognize machining features. However, it does not estimate manufacturability. Alternatively, Ghadai et al. [169] proposed the deep learning-based tool for the identification of difficult-to-manufacture drilled holes. Deep learning-based design for manufacturing (DLDFM) framework decided the manufacturable drilled holes with DFM rules: (1) depth-to-diameter ratio, (2) through-holes, (3) holes close to the edges, and (4) thin sections in the direction of the holes. Figure 22 depicts the rules. The first rule describes the manufacturability of drilled holes, where the depth-to-diameter ratio is fewer than 5. The second rule is the manufacturability, where the ratio for a “through-hole” is less than 10. The third rule is that the drilling process is not manufacturable while the hole is adjacent to the wall of the stock material. The last rule describes the situation where flexible materials should have greater dimensions than hole diameters.

Different DFM rules-based hole examples in classifying manufacturable and non-manufacturable geometries (Adapted from [169] with permission)
They prepared solid models for manufacturable or non-manufacturable drilled holes according to the DFM rule. The solid model had a single drilled hole in a block with 5.0 inches. The diameters, depths, and positions of the drill holes were randomly determined on six faces of the block. This case study used the voxel-based occupancy grid to train 3D CNN with the solid model. According to Sect. 5, the voxelized geometry is an efficient method to represent a solid model. However, boundary information of the 3D model is missing in the voxel-based representation. Therefore, the surface normal using the intersection with each axis-aligned bounding box (AABB) and B-Rep model were used to prevent missing data. The voxelization with the surface normal showed excellent performance for the classification of the manufacturable drilled holes. Moreover, they considered multiple holes, L-shaped blocks with drill holes, and cylinders with the drilled holes.
The CNN architecture in DLDFM consists of convolution layers, max pooling layers, and fully connected layers. ReLU activation and sigmoid activation works in the convolution layer and fully connected layer, respectively. 3D CNN learned 75% of the generated 9531 CAD models. The DLDFM then validated 3D CNN with 25% of the CAD models. Drawing the class-specific feature maps can help them to interpret the predictions. Thus, they used a gradient weighted class activation map (3D-GradCAM) for 3D object recognition to consider the feature localization map for the manufacturability. For the least validation loss, it is necessary to fine-tune the hyperparameters. The selected hyperparameters were as follows: 64 batch size, Adadelta optimizer, and cross-entropy loss function. These parameters guarantee optimized learning of the CNN architecture.
Figure 23 shows examples of both manufacturable and non-manufacturable models. 3D-GradCAM predicted manufacturability and showed it with color codes. Figure 23a–d show blocks with various types of drilled holes. For instance, manufacturable drill holes are indicated as blue color code, as shown in Fig. 23a. Furthermore, Fig. 23e–h show the 3D-GradCAM for L-shapes with a single hole, cylinder shape with a single hole, and multi drilled holes, respectively. After that, the DLDFM method was compared with a hole-ratio based feature detection system. The system had a training accuracy of 0.7504–0.8136. However, the DLDFM method had a training accuracy of 0.9310–0.9340. The DLDFM method outperformed a hole-ratio based feature detection system for recognizing manufacturable geometries. Thus, this case study shows the potential of deep-learning techniques to improve communication between designers and manufacturers.

Illustrative examples of manufacturability prediction and interpretation using the DLDFM framework (Adapted from [169] with permission)
7 Research Outlook
Ongoing studies of feature recognition and manufacturability analysis will mainly focus on one of key issues: how to overcome complexity, calculation burden, and ambiguity. Recognizing features and the following machinability started from the analysis of B-rep or CSG while recent deep learning techniques converts model to points, voxels, and planes. It could handle complex models by reducing the size of a model, however, the conversion also degrades the resolution of the original model by sacrificing the details. As one of the solution, Yeo et al. [170] emphasized tight integration of 3D CAD model into NN by introducing a feature descriptor. The method recognized 17 types from 75 test models. Panda et al. [171] considered volumetric error at layer-by-layer calculation during transition from CAD model to additive manufacturing. Furthermore, to access manufacturability of 3D mesh or point clouds, converting the datasets into CAD model as reverse engineering is also possible. This is about an issue how to find detailed information from rough measurement data. The dimension of data is compressed as space vector and decoded into input to match between reference CAD models. Kim et al. [172] found piping contents from 3D point cloud model of a plant using MVCNN. Including such recent efforts, future studies will improve the accuracy and flexibility of the feature recognition by introducing novel machine learning and information processing techniques.
In the future, feature recognition can be extended to the study of assembly planning as another field of manufacturability analysis. As one of the studies, a liaison graph was used to filter out impossible sequences from the assembly of reference CAD models [173]. Recently, reinforced learning was used to plan assembly automatically from the feasibility analysis of module connection [174]. In addition, to handle the complexity of assembly with various parts, a machine learning model provided optimized decision making which is built from previous knowledge [175]. It is expected that integrating machine learning techniques into feature recognition will provide assessment of assembly directly from complex CAD assembly models or measured 3D point clouds. The assembly planning is also expected to be further improved by converting human skills to building artificial intelligence. Surface fitting of 3D measurements to CAD models [153] will recognize subassembly parts and assist the smart assembly planning.
Technologies such as cyber-physical systems (CPS) and cloud networks are key technologies of smart manufacturing [176]. Due to the advantages of ML models and big datasets, the feature recognition and manufacturability analysis will be advanced with the current technological development. The smart manufacturing framework of the design and manufacturing chain combined with developed object recognition models gives further scope for future research. Moreover, developing related applications of the machine learning techniques such as finding a suitable machine shop for the customer’s CAD model is anticipated as a future research topic, which is related to smart logistics and distributed manufacturing.
8 Conclusions
This study reviews ML-based object recognition for analyzing manufacturability. Here is a list of conclusions.
-
1.
In Sects. 2 and 3, frequently used ML techniques are briefly explained and applications for manufacturability using ML are introduced. From the list of examples, the scope is narrowed down to feature recognition and manufacturability assessment from part models.
-
2.
In Sect. 4, conventional studies of feature recognition from CAD model are reviewed. Over a few decades, researchers in the field mainly dealt with information regarding B-rep or CSG. The section reviewed research elements such as graphs, volume decomposition, NN, hints, and hybrid methods for feature recognition. The rule-based approach was improved by introducing an ontology-based technique. Since AAG was proposed, many works used a graph-based approach in its modification, given its clear data representation and scalability. The volume decomposition method discretized the 3D CAD model into sub-cells or maximal features for enhanced scalability and less calculation; however, issues of multiple representations remain. Although the hint-based approach was specific to certain manufacturing processes, it utilized intuitive information to find machinable volumes, thus resulting in less calculation load. NN methods using the CAD data was proposed for less model complexity. A combination of these approaches, hybrid methods, was studied to enhance the feature recognition algorithms.
-
3.
In Sects. 5 and 6, recent feature recognition using machine learning and the examples on manufacturability applications are introduced. Deep learning-based methods tried to overcome such complexity and ambiguity of the model information. Recently, the use of ML in feature recognition and manufacturability analysis becomes promising due to the less complex structure, less pre-processing of input data, reinforcement by self-learning, improved accuracy, and enlarged hardware capacity. Although a huge amount of data is required to improve accuracy for the wide range of CAD models, ML is worth applying in the manufacturing field due to its advantages.
-
4.
In Sect. 7, current issues and future studies are described. Several recent studies introduced in Sects. 5 and 6 envisions the potential of new methods of object recognition. However, enhancing accuracy, reducing calculation load, and removing noise from discretization provide new scopes for future studies of deep learning-based techniques. It is also possible that feature recognition can be extended to the applications of optimization of assembly planning or decision making for distributed manufacturing. Furthermore, the methods of combining subjective knowledge from manufacturing personnel will also be preserved and implemented to manufacturability analysis.
References
Ren, L., Zhang, L., Tao, F., Zhao, C., Chai, X., & Zhao, X. (2015). Cloud manufacturing: From concept to practice. Enterprise Information Systems, 9(2), 186–209. https://doi.org/10.1080/17517575.2013.839055
Wu, M., Song, Z., & Moon, Y. B. (2017). Detecting cyber-physical attacks in CyberManufacturing systems with machine learning methods. Journal of Intelligent Manufacturing. https://doi.org/10.1007/s10845-017-1315-5
Sabkhi, N., Moufki, A., Nouari, M., & Ginting, A. (2020). A thermomechanical modeling and experimental validation of the gear finish hobbing process. International Journal of Precision Engineering and Manufacturing, 21(3), 347–362. https://doi.org/10.1007/s12541-019-00258-y
Lee, J., Bagheri, B., & Jin, C. (2016). Introduction to cyber manufacturing. Manufacturing Letters, 8, 11–15. https://doi.org/10.1016/j.mfglet.2016.05.002
Park, K. T., Kang, Y. T., Yang, S. G., Zhao, W. B., Kang, Y.-S., Im, S. J., Kim, D. H., Choi, S. Y., & Do Noh, S. (2020). Cyber physical energy system for saving energy of the dyeing process with industrial internet of things and manufacturing big data. International Journal of Precision Engineering and Manufacturing-Green Technology, 7(1), 219–238. https://doi.org/10.1007/s40684-019-00084-7
Schmetz, A., Lee, T. H., Hoeren, M., Berger, M., Ehret, S., Zontar, D., Min, S. H., Ahn, S. H., & Brecher, C. (2020). Evaluation of industry 4.0 data formats for digital twin of optical components. International Journal of Precision Engineering and Manufacturing-Green Technology, 7(3), 573–584. https://doi.org/10.1007/s40684-020-00196-5
Park, K. T., Lee, D., & Noh, S. D. (2020). Operation procedures of a work-center-level digital twin for sustainable and smart manufacturing. International Journal of Precision Engineering and Manufacturing-Green Technology, 7(3), 791–814. https://doi.org/10.1007/s40684-020-00227-1
Syam, N., & Sharma, A. (2018). Waiting for a sales renaissance in the fourth industrial revolution: Machine learning and artificial intelligence in sales research and practice. Industrial Marketing Management, 69, 135–146. https://doi.org/10.1016/j.indmarman.2017.12.019
Loyer, J.-L., Henriques, E., Fontul, M., & Wiseall, S. (2016). Comparison of Machine Learning methods applied to the estimation of manufacturing cost of jet engine components. International Journal of Production Economics, 178, 109–119. https://doi.org/10.1016/j.ijpe.2016.05.006
Pham, D., & Afify, A. (2005). Machine-learning techniques and their applications in manufacturing. Proceedings of the Institution of Mechanical Engineers, Part B: Journal of Engineering Manufacture, 219(5), 395–412. https://doi.org/10.1243/095440505X32274
Wuest, T., Weimer, D., Irgens, C., & Thoben, K.-D. (2016). Machine learning in manufacturing: Advantages, challenges, and applications. Production & Manufacturing Research, 4(1), 23–45. https://doi.org/10.1080/21693277.2016.1192517
Wu, D., Jennings, C., Terpenny, J., Gao, R. X., & Kumara, S. (2017). A comparative study on machine learning algorithms for smart manufacturing: Tool wear prediction using random forests. Journal of Manufacturing Science and Engineering, 139(7), 071018–071018-9. https://doi.org/10.1115/1.4036350
Zeng, Y., & Horváth, I. (2012). Fundamentals of next generation CAD/E systems. Computer-Aided Design, 44(10), 875–878. https://doi.org/10.1016/j.cad.2012.05.005
Ren, S., Zhang, Y., Sakao, T., Liu, Y., & Cai, R. (2022). An advanced operation mode with product-service system using lifecycle big data and deep learning. International Journal of Precision Engineering and Manufacturing-Green Technology, 9(1), 287–303. https://doi.org/10.1007/s40684-021-00354-3
Aicha, M., Belhadj, I., Hammadi, M., & Aifaoui, N. (2022). A coupled method for disassembly plans evaluation based on operating time and quality indexes computing. International Journal of Precision Engineering and Manufacturing-Green Technology, 9(6), 1493–1510. https://doi.org/10.1007/s40684-021-00393-w
Leiden, A., Thiede, S., & Herrmann, C. (2022). Synergetic modelling of energy and resource efficiency as well as occupational safety and health risks of plating process chains. International Journal of Precision Engineering and Manufacturing-Green Technology, 9(3), 795–815. https://doi.org/10.1007/s40684-021-00402-y
Lubell, J., Chen, K., Horst, J., Frechette, S., & Huang, P. (2012). Model based enterprise/technical data package summit report. NIST Technical Note.https://doi.org/10.6028/NIST.TN.1753
Hoefer, M. J. D. (2017). Automated design for manufacturing and supply chain using geometric data mining and machine learning (M.S.). Iowa State University. Retrieved from https://search.proquest.com/docview/1917741269/abstract/E0D662C30654480PQ/1
Renjith, S. C., Park, K., & Okudan Kremer, G. E. (2020). A design framework for additive manufacturing: Integration of additive manufacturing capabilities in the early design process. International Journal of Precision Engineering and Manufacturing, 21(2), 329–345. https://doi.org/10.1007/s12541-019-00253-3
Groch, D., & Poniatowska, M. (2020). Simulation tests of the accuracy of fitting two freeform surfaces. International Journal of Precision Engineering and Manufacturing, 21(1), 23–30. https://doi.org/10.1007/s12541-019-00252-4
Shi, X., Tian, X., & Wang, G. (2020). Screening product tolerances considering semantic variation propagation and fusion for assembly precision analysis. International Journal of Precision Engineering and Manufacturing, 21(7), 1259–1278. https://doi.org/10.1007/s12541-020-00331-x
Kashyap, P. (2017). Let’s integrate with machine learning. In P. Kashyap (Ed.), Machine learning for decision makers: Cognitive computing fundamentals for better decision making (pp. 1–34). Apress. https://doi.org/10.1007/978-1-4842-2988-0_1
Boser, B. E., Guyon, I. M., & Vapnik, V. N. (1992). A training algorithm for optimal margin classifiers. Presented at the Proceedings of the fifth annual workshop on Computational learning theory, ACM (pp. 144–152).
Rosenblatt, F. (1961). Principles of neurodynamics: Perceptrons and the theory of brain mechanisms. Cornell Aeronautical Lab Inc.
Luenberger, D. G., & Ye, Y. (1984). Linear and nonlinear programming (Vol. 2). Springer.
Safavian, S. R., & Landgrebe, D. (1991). A survey of decision tree classifier methodology. IEEE Transactions on Systems, Man, and Cybernetics, 21(3), 660–674. https://doi.org/10.1109/21.97458
Rokach, L., & Maimon, O. (2005). Top-down induction of decision trees classifiers-a survey. IEEE Transactions on Systems, Man, and Cybernetics, Part C (Applications and Reviews), 35(4), 476–487. https://doi.org/10.1109/TSMCC.2004.843247
Olaru, C., & Wehenkel, L. (2003). A complete fuzzy decision tree technique. Fuzzy Sets and Systems, 138(2), 221–254. https://doi.org/10.1016/S0165-0114(03)00089-7
Bennett, K. P. (1994). Global tree optimization: A non-greedy decision tree algorithm. Computing Science and Statistics, 26, 156–156.
Guo, H., & Gelfand, S. B. (1992). Classification trees with neural network feature extraction. IEEE Transactions on Neural Networks, 3(6), 923–933. https://doi.org/10.1109/CVPR.1992.223275
Henderson, M. R., Srinath, G., Stage, R., Walker, K., & Regli, W. (1994). Boundary representation-based feature identification. In Manufacturing research and technology (Vol. 20, pp. 15–38). Elsevier.
LeCun, Y., Bottou, L., Bengio, Y., & Haffner, P. (1998). Gradient-based learning applied to document recognition. Proceedings of the IEEE, 86(11), 2278–2324. https://doi.org/10.1109/5.726791
Goodfellow, I., Bengio, Y., & Courville, A. (2016). Deep learning (Vol. 1). MIT Press.
Guo, Y., Liu, Y., Oerlemans, A., Lao, S., Wu, S., & Lew, M. S. (2016). Deep learning for visual understanding: A review. Neurocomputing, 187, 27–48. https://doi.org/10.1016/j.neucom.2015.09.116
Zeiler, M. D. (2013). Hierarchical convolutional deep learning in computer vision. New York University.
Szegedy, C., Liu, W., Jia, Y., Sermanet, P., Reed, S., Anguelov, D., Erhan, D., Vanhoucke, V., Rabinovich, A. (2015). Going deeper with convolutions. Presented at the Proceedings of the IEEE conference on computer vision and pattern recognition (pp. 1–9).
Oquab, M., Bottou, L., Laptev, I., & Sivic, J. (2015). Is object localization for free? Weakly-supervised learning with convolutional neural networks. Presented at the Proceedings of the IEEE conference on computer vision and pattern recognition (pp. 685–694).
Boureau, Y.-L., Ponce, J., & LeCun, Y. (2010). A theoretical analysis of feature pooling in visual recognition. Presented at the Proceedings of the 27th international conference on machine learning (ICML-10) (pp. 111–118).
Zeiler, M. D., & Fergus, R. (2013). Stochastic pooling for regularization of deep convolutional neural networks. arXiv preprint. https://arxiv.org/abs/1301.3557. https://doi.org/10.48550/arXiv.1301.3557
He, K., Zhang, X., Ren, S., & Sun, J. (2014). Spatial pyramid pooling in deep convolutional networks for visual recognition. Presented at the European conference on computer vision. Springer (pp. 346–361). https://doi.org/10.1109/TPAMI.2015.2389824
Ouyang, W., Luo, P., Zeng, X., Qiu, S., Tian, Y., Li, H., Yang, S., Wang, Z., Xiong, Y., Qian, C., & Zhu, Z. (2014). Deepid-net: Multi-stage and deformable deep convolutional neural networks for object detection. arXiv preprint. https://arxiv.org/abs/1409.3505. https://doi.org/10.48550/arXiv.1409.3505
Mikolov, T., Kombrink, S., Burget, L., Černocký, J., & Khudanpur, S. (2011). Extensions of recurrent neural network language model. Presented at the IEEE international conference on acoustics, speech and signal processing (ICASSP) (pp. 5528–5531). IEEE. https://doi.org/10.1109/ICASSP.2011.5947611
Dekhtiar, J., Durupt, A., Bricogne, M., Eynard, B., Rowson, H., & Kiritsis, D. (2018). Deep learning for big data applications in CAD and PLM—Research review, opportunities and case study. Computers in Industry, 100, 227–243. https://doi.org/10.1016/j.compind.2018.04.005
Aghazadeh, F., Tahan, A., & Thomas, M. (2018). Tool condition monitoring using spectral subtraction algorithm and artificial intelligence methods in milling process. International Journal of Mechanical Engineering and Robotics Research, 7(1), 30–34. https://doi.org/10.18178/ijmerr.7.1.30-34
Khorasani, A., & Yazdi, M. R. S. (2017). Development of a dynamic surface roughness monitoring system based on artificial neural networks (ANN) in milling operation. The International Journal of Advanced Manufacturing Technology, 93(1), 141–151. https://doi.org/10.1007/s00170-015-7922-4
Nam, J. S., & Kwon, W. T. (2022). A study on tool breakage detection during milling process using LSTM-autoencoder and gaussian mixture model. International Journal of Precision Engineering and Manufacturing, 23(6), 667–675. https://doi.org/10.1007/s12541-022-00647-w
Ball, A. K., Roy, S. S., Kisku, D. R., & Murmu, N. C. (2020). A new approach to quantify the uniformity grade of the electrohydrodynamic inkjet printed features and optimization of process parameters using nature-inspired algorithms. International Journal of Precision Engineering and Manufacturing, 21(3), 387–402. https://doi.org/10.1007/s12541-019-00213-x
Yazdchi, A. G. Mahyari, & A. Nazeri. (2008). Detection and classification of surface defects of cold rolling mill steel using morphology and neural network. In International conference on computational intelligence for modelling control & automation (pp. 1071–1076). Presented at the 2008 International conference on computational intelligence for modelling control & automation. https://doi.org/10.1109/CIMCA.2008.130
Librantz, A. F., de Araújo, S. A., Alves, W. A., Belan, P. A., Mesquita, R. A., & Selvatici, A. H. (2017). Artificial intelligence based system to improve the inspection of plastic mould surfaces. Journal of Intelligent Manufacturing, 28(1), 181–190. https://doi.org/10.1007/s10845-014-0969-5
Jia, H., Murphey, Y. L., Shi, J., & Chang, T.-S. (2004). An intelligent real-time vision system for surface defect detection. Presented at the Proceedings of the 17th international conference on pattern recognition, ICPR 2004 (Vol. 3, pp. 239–242). IEEE. https://doi.org/10.1109/ICPR.2004.1334512
Yuan, Z.-C., Zhang, Z.-T., Su, H., Zhang, L., Shen, F., & Zhang, F. (2018). Vision-based defect detection for mobile phone cover glass using deep neural networks. International Journal of Precision Engineering and Manufacturing, 19(6), 801–810. https://doi.org/10.1007/s12541-018-0096-x
Choi, E., & Kim, J. (2020). Deep learning based defect inspection using the intersection over minimum between search and abnormal regions. International Journal of Precision Engineering and Manufacturing, 21(4), 747–758. https://doi.org/10.1007/s12541-019-00269-9
Susto, G. A., Schirru, A., Pampuri, S., McLoone, S., & Beghi, A. (2015). Machine learning for predictive maintenance: A multiple classifier approach. IEEE Transactions on Industrial Informatics, 11(3), 812–820. https://doi.org/10.1109/TII.2014.2349359
Lee, Y. E., Kim, B.-K., Bae, J.-H., & Kim, K. C. (2021). Misalignment detection of a rotating machine shaft using a support vector machine learning algorithm. International Journal of Precision Engineering and Manufacturing, 22(3), 409–416. https://doi.org/10.1007/s12541-020-00462-1
Lei, D. (2012). Co-evolutionary genetic algorithm for fuzzy flexible job shop scheduling. Applied Soft Computing, 12(8), 2237–2245. https://doi.org/10.1016/j.asoc.2012.03.025
Chen, J. C., Wu, C.-C., Chen, C.-W., & Chen, K.-H. (2012). Flexible job shop scheduling with parallel machines using genetic algorithm and grouping genetic algorithm. Expert Systems with Applications, 39(11), 10016–10021. https://doi.org/10.1016/j.eswa.2012.01.211
Lee, S.-C., Tseng, H.-E., Chang, C.-C., & Huang, Y.-M. (2020). Applying interactive genetic algorithms to disassembly sequence planning. International Journal of Precision Engineering and Manufacturing, 21(4), 663–679. https://doi.org/10.1007/s12541-019-00276-w
Shankar, B. L., Basavarajappa, S., Kadadevaramath, R. S., & Chen, J. C. (2013). A bi-objective optimization of supply chain design and distribution operations using non-dominated sorting algorithm: A case study. Expert Systems with Applications, 40(14), 5730–5739. https://doi.org/10.1016/j.eswa.2013.03.047
Kłosowski, G., & Gola, A. (2016). Risk-based estimation of manufacturing order costs with artificial intelligence. In Federated conference on computer science and information systems (FedCSIS). Presented at the 2016 Federated conference on computer science and information systems (FedCSIS) (pp. 729–732). https://doi.org/10.15439/2016F323
Filipič, B., & Junkar, M. (2000). Using inductive machine learning to support decision making in machining processes. Computers in Industry, 43(1), 31–41. https://doi.org/10.1016/S0166-3615(00)00056-7
Kim, S. W., Kong, J. H., Lee, S. W., & Lee, S. (2022). Recent advances of artificial intelligence in manufacturing industrial sectors: A review. International Journal of Precision Engineering and Manufacturing, 23(1), 111–129. https://doi.org/10.1007/s12541-021-00600-3
Inkulu, A. K., Bahubalendruni, M. V. A. R., Dara, A., & SankaranarayanaSamy, K. (2021). Challenges and opportunities in human robot collaboration context of Industry 4.0—A state of the art review. Industrial Robot: The International Journal of Robotics Research and Application, 49(2), 226–239. https://doi.org/10.1108/IR-04-2021-0077
Lerra, F., Candido, A., Liverani, E., & Fortunato, A. (2022). Prediction of micro-scale forces in dry grinding process through a FEM—ML hybrid approach. International Journal of Precision Engineering and Manufacturing, 23(1), 15–29. https://doi.org/10.1007/s12541-021-00601-2
Byun, Y., & Baek, J.-G. (2021). Pattern classification for small-sized defects using multi-head CNN in semiconductor manufacturing. International Journal of Precision Engineering and Manufacturing, 22(10), 1681–1691. https://doi.org/10.1007/s12541-021-00566-2
Ding, D., Wu, X., Ghosh, J., & Pan, D. Z. (2009). Machine learning based lithographic hotspot detection with critical-feature extraction and classification. Presented at the IEEE international conference on IC design and technology, ICICDT’09. IEEE (pp. 219–222). https://doi.org/10.1109/ICICDT.2009.5166300
Yu, Y.-T., Lin, G.-H., Jiang, I. H.-R., & Chiang, C. (2013). Machine-learning-based hotspot detection using topological classification and critical feature extraction. Presented at the Proceedings of the 50th annual design automation conference (p. 67). ACM. https://doi.org/10.1145/2463209.2488816
Raviwongse, R., & Allada, V. (1997). Artificial neural network based model for computation of injection mould complexity. The International Journal of Advanced Manufacturing Technology, 13(8), 577–586. https://doi.org/10.1007/BF01176302
Jeong, S.-H., Choi, D.-H., & Jeong, M. (2012). Feasibility classification of new design points using support vector machine trained by reduced dataset. International Journal of Precision Engineering and Manufacturing, 13(5), 739–746. https://doi.org/10.1007/s12541-012-0096-1
Bishop, C. M. (2006). Pattern recognition and machine learning (information science and statistics). Springer.
Xu, X., Wang, L., & Newman, S. T. (2011). Computer-aided process planning—A critical review of recent developments and future trends. International Journal of Computer Integrated Manufacturing, 24(1), 1–31. https://doi.org/10.1080/0951192X.2010.518632
Babic, B., Nesic, N., & Miljkovic, Z. (2008). A review of automated feature recognition with rule-based pattern recognition. Computers in Industry, 59(4), 321–337. https://doi.org/10.1016/j.compind.2007.09.001
Henderson, M. R., & Anderson, D. C. (1984). Computer recognition and extraction of form features: A CAD/CAM link. Computers in Industry, 5(4), 329–339. https://doi.org/10.1016/0166-3615(84)90056-3
Chan, A., & Case, K. (1994). Process planning by recognizing and learning machining features. International Journal of Computer Integrated Manufacturing, 7(2), 77–99. https://doi.org/10.1080/09511929408944597
Xu, X., & Hinduja, S. (1998). Recognition of rough machining features in 212D components. Computer-Aided Design, 30(7), 503–516. https://doi.org/10.1016/S0010-4485(97)00090-0
Sadaiah, M., Yadav, D. R., Mohanram, P. V., & Radhakrishnan, P. (2002). A generative computer-aided process planning system for prismatic components. The International Journal of Advanced Manufacturing Technology, 20(10), 709–719. https://doi.org/10.1007/s001700200228
Owodunni, O., & Hinduja, S. (2002). Evaluation of existing and new feature recognition algorithms: Part 1: Theory and implementation. Proceedings of the Institution of Mechanical Engineers, Part B: Journal of Engineering Manufacture, 216(6), 839–851. https://doi.org/10.1243/095440502320192978
Owodunni, O., & Hinduja, S. (2005). Systematic development and evaluation of composite methods for recognition of three-dimensional subtractive features. Proceedings of the Institution of Mechanical Engineers, Part B: Journal of Engineering Manufacture, 219(12), 871–890. https://doi.org/10.1243/095440505X32878
Abouel Nasr, E. S., & Kamrani, A. K. (2006). A new methodology for extracting manufacturing features from CAD system. Computers & Industrial Engineering, 51(3), 389–415. https://doi.org/10.1016/j.cie.2006.08.004
Sheen, B.-T., & You, C.-F. (2006). Machining feature recognition and tool-path generation for 3-axis CNC milling. Computer-Aided Design, 38(6), 553–562. https://doi.org/10.1016/j.cad.2005.05.003
Ismail, N., Abu Bakar, N., & Juri, A. H. (2005). Recognition of cylindrical and conical features using edge boundary classification. International Journal of Machine Tools and Manufacture, 45(6), 649–655. https://doi.org/10.1016/j.ijmachtools.2004.10.008
Gupta, R. K., & Gurumoorthy, B. (2012). Automatic extraction of free-form surface features (FFSFs). Computer-Aided Design, 44(2), 99–112. https://doi.org/10.1016/j.cad.2011.09.012
Sunil, V. B., & Pande, S. S. (2008). Automatic recognition of features from freeform surface CAD models. Computer-Aided Design, 40(4), 502–517. https://doi.org/10.1016/j.cad.2008.01.006
Zehtaban, L., & Roller, D. (2016). Automated rule-based system for opitz feature recognition and code generation from STEP. Computer-Aided Design and Applications, 13(3), 309–319. https://doi.org/10.1080/16864360.2015.1114388
Wang, Q., & Yu, X. (2014). Ontology based automatic feature recognition framework. Computers in Industry, 65(7), 1041–1052. https://doi.org/10.1016/j.compind.2014.04.004
Iyer, N., Jayanti, S., Lou, K., Kalyanaraman, Y., & Ramani, K. (2005). Three-dimensional shape searching: State-of-the-art review and future trends. Computer-Aided Design, 37(5), 509–530. https://doi.org/10.1016/j.cad.2004.07.002
Joshi, S., & Chang, T. C. (1988). Graph-based heuristics for recognition of machined features from a 3D solid model. Computer-Aided Design, 20(2), 58–66. https://doi.org/10.1016/0010-4485(88)90050-4
Han, J., Pratt, M., & Regli, W. C. (2000). Manufacturing feature recognition from solid models: A status report. IEEE Transactions on Robotics and Automation, 16(6), 782–796. https://doi.org/10.1109/70.897789
Wan, N., Du, K., Zhao, H., & Zhang, S. (2015). Research on the knowledge recognition and modeling of machining feature geometric evolution. The International Journal of Advanced Manufacturing Technology, 79(1–4), 491–501. https://doi.org/10.1007/s00170-015-6814-y
Rahmani, K., & Arezoo, B. (2007). A hybrid hint-based and graph-based framework for recognition of interacting milling features. Computers in Industry, 58(4), 304–312. https://doi.org/10.1016/j.compind.2006.07.001
Trika, S. N., & Kashyap, R. L. (1994). Geometric reasoning for extraction of manufacturing features in iso-oriented polyhedrons. IEEE Transactions on Pattern Analysis and Machine Intelligence, 16(11), 1087–1100. https://doi.org/10.1109/34.334388
Gavankar, P., & Henderson, M. R. (1990). Graph-based extraction of protrusions and depressions from boundary representations. Computer-Aided Design, 22(7), 442–450. https://doi.org/10.1016/0010-4485(90)90109-P
Marefat, M., & Kashyap, R. L. (1992). Automatic construction of process plans from solid model representations. IEEE Transactions on Systems, Man, and Cybernetics, 22(5), 1097–1115. https://doi.org/10.1109/21.179847
Marefat, M., & Kashyap, R. L. (1990). Geometric reasoning for recognition of three-dimensional object features. IEEE Transactions on Pattern Analysis and Machine Intelligence, 12(10), 949–965. https://doi.org/10.1109/34.58868
Qamhiyah, A. Z., Venter, R. D., & Benhabib, B. (1996). Geometric reasoning for the extraction of form features. Computer-Aided Design, 28(11), 887–903. https://doi.org/10.1016/0010-4485(96)00015-2
Yuen, C. F., & Venuvinod, P. (1999). Geometric feature recognition: Coping with the complexity and infinite variety of features. International Journal of Computer Integrated Manufacturing, 12(5), 439–452. https://doi.org/10.1080/095119299130173
Yuen, C. F., Wong, S. Y., & Venuvinod, P. K. (2003). Development of a generic computer-aided process planning support system. Journal of Materials Processing Technology, 139(1), 394–401. https://doi.org/10.1016/S0924-0136(03)00507-7
Ibrhim, R. N., & McCormack, A. D. (2002). Process planning using adjacency-based feature extraction. The International Journal of Advanced Manufacturing Technology, 20(11), 817–823. https://doi.org/10.1007/s001700200222
Huang, Z., & Yip-Hoi, D. (2002). High-level feature recognition using feature relationship graphs. Computer-Aided Design, 34(8), 561–582. https://doi.org/10.1016/S0010-4485(01)00128-2
Verma, A. K., & Rajotia, S. (2004). Feature vector: A graph-based feature recognition methodology. International Journal of Production Research, 42(16), 3219–3234. https://doi.org/10.1080/00207540410001699408
Di Stefano, P., Bianconi, F., & Di Angelo, L. (2004). An approach for feature semantics recognition in geometric models. Computer-Aided Design, 36(10), 993–1009. https://doi.org/10.1016/j.cad.2003.10.004
Zhu, J., Kato, M., Tanaka, T., Yoshioka, H., & Saito, Y. (2015). Graph based automatic process planning system for multi-tasking machine. Journal of Advanced Mechanical Design, Systems, and Manufacturing, 9(3), JAMDSM0034–JAMDSM0034. https://doi.org/10.1299/jamdsm.2015jamdsm0034
Li, H., Huang, Y., Sun, Y., & Chen, L. (2015). Hint-based generic shape feature recognition from three-dimensional B-rep models. Advances in Mechanical Engineering, 7(4), 1687814015582082. https://doi.org/10.1177/1687814015582082
Sakurai, H., & Dave, P. (1996). Volume decomposition and feature recognition, part II: Curved objects. Computer-Aided Design, 28(6), 519–537. https://doi.org/10.1016/0010-4485(95)00067-4
Shah, J. J., Shen, Y., & Shirur, A. (1994). Determination of machining volumes from extensible sets of design features. Manufacturing Research and Technology, 20, 129–157. https://doi.org/10.1016/B978-0-444-81600-9.50012-2
Tseng, Y.-J., & Joshi, S. B. (1994). Recognizing multiple interpretations of interacting machining features. Computer-Aided Design, 26(9), 667–688. https://doi.org/10.1016/0010-4485(94)90018-3
Wu, W., Huang, Z., Liu, Q., & Liu, L. (2018). A combinatorial optimisation approach for recognising interacting machining features in mill-turn parts. International Journal of Production Research, 56(11), 1–24. https://doi.org/10.1080/00207543.2018.1425016
Kyprianou, L. K. (1980). Shape classification in computer-aided design. Ph.D. Thesis. University of Cambridge.
Waco, D. L., & Kim, Y. S. (1993). Considerations in positive to negative conversion for machining features using convex decomposition. Computers in Engineering, 97645, 35–35. https://doi.org/10.1115/CIE1993-0006
Kim, Y. S. (1990). Convex decomposition and solid geometric modeling. Ph.D. Thesis. Stanford University.
Kim, Y. S. (1992). Recognition of form features using convex decomposition. Computer-Aided Design, 24(9), 461–476. https://doi.org/10.1016/0010-4485(92)90027-8
Woo, Y., & Sakurai, H. (2002). Recognition of maximal features by volume decomposition. Computer-Aided Design, 34(3), 195–207. https://doi.org/10.1016/S0010-4485(01)00080-X
Bok, A. Y., & Mansor, M. S. A. (2013). Generative regular-freeform surface recognition for generating material removal volume from stock model. Computers & Industrial Engineering, 64(1), 162–178. https://doi.org/10.1016/j.cie.2012.08.013
Kataraki, P. S., & Mansor, M. S. A. (2017). Auto-recognition and generation of material removal volume for regular form surface and its volumetric features using volume decomposition method. The International Journal of Advanced Manufacturing Technology, 90(5–8), 1479–1506. https://doi.org/10.1007/s00170-016-9394-6
Zubair, A. F., & Mansor, M. S. A. (2018). Automatic feature recognition of regular features for symmetrical and non-symmetrical cylinder part using volume decomposition method. Engineering with Computers, 15, 1269–1285. https://doi.org/10.1007/s00366-018-0576-8
Vandenbrande, J. H., & Requicha, A. A. G. (1993). Spatial reasoning for the automatic recognition of machinable features in solid models. IEEE Transactions on Pattern Analysis and Machine Intelligence, 15(12), 1269–1285. https://doi.org/10.1109/34.250845
Regli, W. C., Gupta, S. K., & Nau, D. S. (1995). Extracting alternative machining features: An algorithmic approach. Research in Engineering Design, 7(3), 173–192. https://doi.org/10.1007/BF01638098
Regli, W. C., Gupta, S. K., & Nau, D. S. (1997). Towards multiprocessor feature recognition. Computer Aided Design, 29(1), 37–51. https://doi.org/10.1016/S0010-4485(96)00047-4
Kang, M., Han, J., & Moon, J. G. (2003). An approach for interlinking design and process planning. Journal of Materials Processing Technology, 139(1), 589–595. https://doi.org/10.1016/S0924-0136(03)00516-8
Han, J., & Requicha, A. A. (1997). Integration of feature based design and feature recognition. Computer-Aided Design, 29(5), 393–403. https://doi.org/10.1016/S0010-4485(96)00079-6
Meeran, S., Taib, J. M., & Afzal, M. T. (2003). Recognizing features from engineering drawings without using hidden lines: A framework to link feature recognition and inspection systems. International Journal of Production Research, 41(3), 465–495. https://doi.org/10.1080/00207540210148871
Verma, A. K., & Rajotia, S. (2008). A hint-based machining feature recognition system for 2.5D parts. International Journal of Production Research, 46(6), 1515–1537. https://doi.org/10.1080/00207540600919373
Li, W. D., Ong, S. K., & Nee, A. Y. C. (2003). A hybrid method for recognizing interacting machining features. International Journal of Production Research, 41(9), 1887–1908. https://doi.org/10.1080/0020754031000123868
Gao, S., & Shah, J. J. (1998). Automatic recognition of interacting machining features based on minimal condition subgraph. Computer-Aided Design, 30(9), 727–739. https://doi.org/10.1016/S0010-4485(98)00033-5
Rahmani, K., & Arezoo, B. (2006). Boundary analysis and geometric completion for recognition of interacting machining features. Computer-Aided Design, 38(8), 845–856. https://doi.org/10.1016/j.cad.2006.04.015
Ye, X. G., Fuh, J. Y. H., & Lee, K. S. (2001). A hybrid method for recognition of undercut features from moulded parts. Computer-Aided Design, 33(14), 1023–1034. https://doi.org/10.1016/S0010-4485(00)00138-X
Sunil, V. B., Agarwal, R., & Pande, S. S. (2010). An approach to recognize interacting features from B-Rep CAD models of prismatic machined parts using a hybrid (graph and rule based) technique. Computers in Industry, 61(7), 686–701. https://doi.org/10.1016/j.compind.2010.03.011
Kim, Y. S., & Wang, E. (2002). Recognition of machining features for cast then machined parts. Computer-Aided Design, 34(1), 71–87. https://doi.org/10.1016/S0010-4485(01)00058-6
Subrahmanyam, S. R. (2002). A method for generation of machining and fixturing features from design features. Computers in Industry, 47(3), 269–287. https://doi.org/10.1016/S0166-3615(01)00154-3
Woo, Y., Wang, E., Kim, Y. S., & Rho, H. M. (2005). A hybrid feature recognizer for machining process planning systems. CIRP Annals-Manufacturing Technology, 54(1), 397–400. https://doi.org/10.1016/S0007-8506(07)60131-0
Verma, A. K., & Rajotia, S. (2010). A review of machining feature recognition methodologies. International Journal of Computer Integrated Manufacturing, 23(4), 353–368. https://doi.org/10.1080/09511921003642121
Prabhakar, S., & Henderson, M. R. (1992). Automatic form-feature recognition using neural-network-based techniques on boundary representations of solid models. Computer-Aided Design, 24(7), 381–393. https://doi.org/10.1016/0010-4485(92)90064-H
Nezis, K., & Vosniakos, G. (1997). Recognizing 212D shape features using a neural network and heuristics. Computer-Aided Design, 29(7), 523–539. https://doi.org/10.1016/S0010-4485(97)00003-1
Kumara, S. R. T., Kao, C.-Y., Gallagher, M. G., & Kasturi, R. (1994). 3-D interacting manufacturing feature recognition. CIRP Annals, 43(1), 133–136. https://doi.org/10.1016/S0007-8506(07)62181-7
Hwang, J.-L. (1991). Applying the perceptron to three-dimensional feature recognition. Arizona State University.
Lankalapalli, K., Chatterjee, S., & Chang, T. (1997). Feature recognition using ART2: A self-organizing neural network. Journal of Intelligent Manufacturing, 8(3), 203–214. https://doi.org/10.1023/A:1018521207901
Onwubolu, G. C. (1999). Manufacturing features recognition using backpropagation neural networks. Journal of Intelligent manufacturing, 10(3–4), 289–299. https://doi.org/10.1023/A:1008904109029
Sunil, V. B., & Pande, S. S. (2009). Automatic recognition of machining features using artificial neural networks. The International Journal of Advanced Manufacturing Technology, 41(9–10), 932–947. https://doi.org/10.1007/s00170-008-1536-z
Öztürk, N., & Öztürk, F. (2001). Neural network based non-standard feature recognition to integrate CAD and CAM. Computers in Industry, 45(2), 123–135. https://doi.org/10.1016/S0166-3615(01)00090-2
Zulkifli, A., & Meeran, S. (1999). Feature patterns in recognizing non-interacting and interacting primitive, circular and slanting features using a neural network. International Journal of Production Research, 37(13), 3063–3100. https://doi.org/10.1080/002075499190428
Chen, Y., & Lee, H. (1998). A neural network system feature recognition for two-dimensional. International Journal of Computer Integrated Manufacturing, 11(2), 111–117. https://doi.org/10.1080/095119298130859
Su, H., Maji, S., Kalogerakis, E., & Learned-Miller, E. (2015). Multi-view convolutional neural networks for 3d shape recognition. Presented at the Proceedings of the IEEE international conference on computer vision (pp. 945–953).
Xie, Z., Xu, K., Shan, W., Liu, L., Xiong, Y., & Huang, H. (2015). Projective feature learning for 3D shapes with multi‐view depth images. Presented at the Computer graphics forum, Wiley Online Library (Vol. 34, pp. 1–11). https://doi.org/10.1111/cgf.12740
Cao, Z., Huang, Q., & Karthik, R. (2017). 3d object classification via spherical projections. Presented at the International conference on 3D vision (3DV) (pp. 566–574). IEEE. https://doi.org/10.1109/3DV.2017.00070
Papadakis, P., Pratikakis, I., Theoharis, T., & Perantonis, S. (2010). PANORAMA: A 3D shape descriptor based on panoramic views for unsupervised 3D object retrieval. International Journal of Computer Vision, 89(2–3), 177–192. https://doi.org/10.1007/s11263-009-0281-6
Shi, B., Bai, S., Zhou, Z., & Bai, X. (2015). DeepPano: Deep panoramic representation for 3-D shape recognition. IEEE Signal Processing Letters, 22(12), 2339–2343. Presented at the IEEE signal processing letters. https://doi.org/10.1109/LSP.2015.2480802
Kazhdan, M., Funkhouser, T., & Rusinkiewicz, S. (2003). Rotation invariant spherical harmonic representation of 3D shape descriptors. Presented at the Symposium on geometry processing (Vol. 6, pp. 156–164).
Chen, D., Tian, X., Shen, Y., & Ouhyoung, M. (2003). On visual similarity based 3D model retrieval. Presented at the Computer graphics forum, Wiley Online Library (Vol. 22, pp. 223–232). https://doi.org/10.1111/1467-8659.00669
Johns, E., Leutenegger, S., & Davison, A. J. (2016). Pairwise decomposition of image sequences for active multi-view recognition. Presented at the Proceedings of the IEEE conference on computer vision and pattern recognition (pp. 3813–3822).
Feng, Y., Zhang, Z., Zhao, X., Ji, R., & Gao, Y. (2018). GVCNN: Group-view convolutional neural networks for 3D shape recognition. Presented at the Proceedings of the IEEE conference on computer vision and pattern recognition (pp. 264–272).
Rusu, R. B., & Cousins, S. (2011). 3D is here: Point Cloud Library (PCL). In IEEE international conference on robotics and automation (pp. 1–4). Presented at the IEEE international conference on robotics and automation. https://doi.org/10.1109/ICRA.2011.5980567
Qi, C. R., Su, H., Mo, K., & Guibas, L. J. (2017). Pointnet: Deep learning on point sets for 3d classification and segmentation. Proceedings of Computer Vision and Pattern Recognition (CVPR), 1(2), 4.
Fan, H., Su, H., & Guibas, L. (2017). A point set generation network for 3d object reconstruction from a single image. Presented at the Conference on computer vision and pattern recognition (CVPR) (Vol. 38, p. 1).
Abdulqawi, N. I. A., & Abu Mansor, M. S. (2020). Preliminary study on development of 3D free-form surface reconstruction system using a webcam imaging technique. International Journal of Precision Engineering and Manufacturing, 21(3), 437–464. https://doi.org/10.1007/s12541-019-00220-y
Klokov, R., & Lempitsky, V. (2017). Escape from cells: Deep kd-networks for the recognition of 3d point cloud models. Presented at the IEEE international conference on computer vision (ICCV) (pp. 863–872). IEEE.
Wang, Y., Sun, Y., Liu, Z., Sarma, S. E., Bronstein, M. M., & Solomon, J. M. (2019). Dynamic graph CNN for learning on point clouds. ACM Transactions on Graphics (ToG), 38(5), 1–12. https://doi.org/10.1145/3326362
Wu, Z., Song, S., Khosla, A., Yu, F., Zhang, L., Tang, X., & Xiao, J. (2015). 3d shapenets: A deep representation for volumetric shapes. Presented at the Proceedings of the IEEE conference on computer vision and pattern recognition (pp. 1912–1920).
Maturana, D., & Scherer, S. (2015). Voxnet: A 3d convolutional neural network for real-time object recognition. Presented at the IEEE/RSJ international conference on intelligent robots and systems (IROS) (pp. 922–928). IEEE. https://doi.org/10.1109/IROS.2015.7353481
Qi, C. R., Su, H., Niessner, M., Dai, A., Yan, M., & Guibas, L. J. (2016). Volumetric and multi-view CNNs for object classification on 3D data. Presented at the Proceedings of the IEEE conference on computer vision and pattern recognition (pp. 5648–5656).
Hegde, V., & Zadeh, R. (2016). FusionNet: 3D object classification using multiple data representations. https://doi.org/10.48550/arXiv.1607.05695
Sedaghat, N., Zolfaghari, M., Amiri, E., & Brox, T. (2017). Orientation-boosted voxel nets for 3D object recognition. arXiv. https://doi.org/10.48550/arXiv.1604.03351
Riegler, G., Ulusoy, A. O., & Geiger, A. (2017). Octnet: Learning deep 3d representations at high resolutions. Presented at the Proceedings of the IEEE conference on computer vision and pattern recognition (Vol. 3).
Yi, J., Deng, Z., Zhou, W., & Li, S. (2020). Numerical modeling of transient temperature and stress in WC–10Co4Cr coating during high-speed grinding. International Journal of Precision Engineering and Manufacturing, 21(4), 585–598. https://doi.org/10.1007/s12541-019-00285-9
Ahmad, A. S., Wu, Y., Gong, H., & Liu, L. (2020). Numerical simulation of thermal and residual stress field induced by three-pass TIG welding of Al 2219 considering the effect of interpass cooling. International Journal of Precision Engineering and Manufacturing, 21(8), 1501–1518. https://doi.org/10.1007/s12541-020-00357-1
Thipprakmas, S., & Sontamino, A. (2021). A novel modified shaving die design for fabrication with nearly zero die roll formations. International Journal of Precision Engineering and Manufacturing, 22(6), 991–1005. https://doi.org/10.1007/s12541-021-00509-x
Ahmed, F., Ko, T. J., Jongmin, L., Kwak, Y., Yoon, I. J., & Kumaran, S. T. (2021). Tool geometry optimization of a ball end mill based on finite element simulation of machining the tool steel-AISI H13 using grey relational method. International Journal of Precision Engineering and Manufacturing, 22(7), 1191–1203. https://doi.org/10.1007/s12541-021-00530-0
Kalogerakis, E., Hertzmann, A., & Singh, K. (2010). Learning 3D mesh segmentation and labeling. ACM Transactions on Graphics (ToG), 29(4), 102. https://doi.org/10.1145/1833349.1778839
Tan, Q., Gao, L., Lai, Y.-K., Yang, J., & Xia, S. (2018). Mesh-based autoencoders for localized deformation component analysis. Presented at the Proceedings of the AAAI conference on artificial intelligence (Vol. 32). https://doi.org/10.1609/aaai.v32i1.11870
Zhang, Z., Jaiswal, P., & Rai, R. (2018). FeatureNet: Machining feature recognition based on 3D convolution neural network. Computer-Aided Design, 101, 12–22. https://doi.org/10.1016/j.cad.2018.03.006
Ghadai, S., Balu, A., Sarkar, S., & Krishnamurthy, A. (2018). Learning localized features in 3D CAD models for manufacturability analysis of drilled holes. Computer Aided Geometric Design, 62, 263–275. https://doi.org/10.1016/j.cagd.2018.03.024
Yeo, C., Kim, B. C., Cheon, S., Lee, J., & Mun, D. (2021). Machining feature recognition based on deep neural networks to support tight integration with 3D CAD systems. Scientific Reports, 11(1), 22147. https://doi.org/10.1038/s41598-021-01313-3
Panda, B. N., Bahubalendruni, R. M., Biswal, B. B., & Leite, M. (2017). A CAD-based approach for measuring volumetric error in layered manufacturing. Proceedings of the Institution of Mechanical Engineers, Part C: Journal of Mechanical Engineering Science, 231(13), 2398–2406. https://doi.org/10.1177/0954406216634746
Kim, H., Yeo, C., Lee, I. D., & Mun, D. (2020). Deep-learning-based retrieval of piping component catalogs for plant 3D CAD model reconstruction. Computers in Industry, 123, 103320. https://doi.org/10.1016/j.compind.2020.103320
Bahubalendruni, M. V. A. R., & Biswal, B. B. (2014). Computer aid for automatic liaisons extraction from cad based robotic assembly. In IEEE 8th International conference on intelligent systems and control (ISCO). Presented at the IEEE 8th international conference on intelligent systems and control (ISCO) (pp. 42–45). https://doi.org/10.1109/ISCO.2014.7103915
Zhang, H., Peng, Q., Zhang, J., & Gu, P. (2021). Planning for automatic product assembly using reinforcement learning. Computers in Industry, 130, 103471. https://doi.org/10.1016/j.compind.2021.103471
Zhang, S.-W., Wang, Z., Cheng, D.-J., & Fang, X.-F. (2022). An intelligent decision-making system for assembly process planning based on machine learning considering the variety of assembly unit and assembly process. The International Journal of Advanced Manufacturing Technology, 121(1), 805–825. https://doi.org/10.1007/s00170-022-09350-6
Jung, W.-K., Kim, D.-R., Lee, H., Lee, T.-H., Yang, I., Youn, B. D., Zontar, D., Brockmann, M., Brecher, C., & Ahn, S.-H. (2021). Appropriate smart factory for SMEs: Concept, application and perspective. International Journal of Precision Engineering and Manufacturing, 22(1), 201–215. https://doi.org/10.1007/s12541-020-00445-2
Acknowledgements
This research was supported by the development of holonic manufacturing system for future industrial environment funded by the Korea Institute of Industrial Technology (KITECH EO220001) and this work has supported by the National Research Foundation of Korea (NRF) Grant funded by the Korea government (MSIT) (No. 2020R1C1C1008113).
Author information
Authors and Affiliations
Contributions
Huitaek Yun contributed to the literature review and the writing of the paper. Eunseob Kim contributed to literature review. Hyung Wook Park contributed to the advising. Dong Min Kim contributed to the literature review, proof reading and supervised the work. Martin Byung-Guk Jun provided supervised the work. All authors read and approved the fnal manuscript.
Corresponding authors
Ethics declarations
Competing interest
We wish to confirm that there are no known conflicts of interest associated with this publication and there has been no significant financial support for this work that could have influenced its outcome.
Additional information
Publisher's Note
Springer Nature remains neutral with regard to jurisdictional claims in published maps and institutional affiliations.
Rights and permissions
Open Access This article is licensed under a Creative Commons Attribution 4.0 International License, which permits use, sharing, adaptation, distribution and reproduction in any medium or format, as long as you give appropriate credit to the original author(s) and the source, provide a link to the Creative Commons licence, and indicate if changes were made. The images or other third party material in this article are included in the article's Creative Commons licence, unless indicated otherwise in a credit line to the material. If material is not included in the article's Creative Commons licence and your intended use is not permitted by statutory regulation or exceeds the permitted use, you will need to obtain permission directly from the copyright holder. To view a copy of this licence, visit http://creativecommons.org/licenses/by/4.0/.
About this article

Cite this article
Yun, H., Kim, E., Kim, D.M. et al. Machine Learning for Object Recognition in Manufacturing Applications. Int. J. Precis. Eng. Manuf. 24, 683–712 (2023). https://doi.org/10.1007/s12541-022-00764-6
Received:
Revised:
Accepted:
Published:
Issue Date:
DOI: https://doi.org/10.1007/s12541-022-00764-6