
Abstract
Quick response in emergency situations is crucial, because any delay can result in dramatic consequences and potentially human losses. Therefore, many institutions/authorities are relying on development of strategies for emergency management, specially to have a quick response process using modern technologies like unmanned aerial vehicles. A key factor affecting this process is to have a quick geo-situation report of the emergency in real time, which reflects the current emergency situation and supports in right decision-making. Providing such geo-reports is still not an easy task because—in most cases—a priori known spatial data like map data (raster/vector) or geodatabases are outdated, and anyway would not provide an overview on the current situation. Therefore, this paper introduces a management methodology of spatial data focusing on enabling a free access and viewing the data of interest in real time and in situ to support emergency managers. The results of this work are twofold: on the one hand, an automated mechanism for spatial data synchronization and streaming was developed and on the other hand, a spatial data sharing concept was realized using web map tile service. For results assessment, an experimental framework through the joint research project ANKommEn (English acronym: Automated Navigation and Communication for Exploration) was implemented. The assessment procedure was achieved based on specific evaluation criteria like time consumption and performance and showed that the developed methodology can help in overcoming some of existing challenges and addressing the practically relevant questions concerning on the complexity in spatial data sharing and retrieval.
Introduction
In every moment during disasters and emergencies, the situation can rapidly change and therefore, it is to expect that a large amount of spatial datasets containing a large number of files and object information can be obtained, stored and analyzed, especially if multi-sensors like RGB, thermal cameras and LiDAR, as well as different platforms like UAV (unmanned aerial vehicle) and a ground-based UGV (unmanned ground vehicle) are used. In such situations and due to the complexity and heterogeneity of the datasets, it is still not an easy task to automatically transfer the datasets from in situ to specific geospatial databases. Furthermore, the design and implementation of spatial databases including proper data access by end users is a critical stage affecting the effectiveness and proficiency of databases in terms of data transferring and retrieval.
Another challenge is the process of deployment and publication of available spatial data, especially when this process has to be achieved in an automated way to provide for instance geometrical coordinates of objects of interest, and also non-geometrical information like object attributes such as object names, types and functions. These considerations set the frame for this proposed research in developing a management methodology of spatial data that enables on the one hand an automated synchronization for data transferring from a ground station as data storage in situ to Postgres/PostGIS-based databases; and on the other hand making the data available for clients and viewing the data in real time to support managers and operators in managing emergency cases. First, we concentrated on the design of spatial databases with respect to pertaining technical functionalities. The main priority was to design a proficient spatial database concept based on the needs and responsibilities of the resource specialists and managers working in the emergency sector; definition and characterization of these responsibilities have been addressed by another contribution introduced by Alamouri and Gerke (2019).
Once having a complete spatial database and synchronization process of the data transmission, it was essential to provide the spatial data to end users in a simple way like a web-based application without having to learn a lot of skills or technical details. For this purpose, a framework for spatial data deployment and publishing using web server capabilities has been developed. In addition, an effective and client-friendly interface for data provision and view in 2D and 3D has been built. Here, one challenge was the creation of a cohesive linkage between the spatial data deployment framework and the client interface functionalities and options, where it was essential that the client interface should be an innovative solution for managing the information in real time, and for the intuitive interaction through internet browsers and via smartphone platforms without special requirements.
All experimentations and investigations achieved in this work have been applied on the spatial data captured from the joint research project ANKommEn (Batzdorfer et al. 2018; Alamouri et al. 2019). In this contribution, the joint project ANKommEn and its potential in spatial data capturing and processing are briefly introduced with focus on spatial database management, design, implementation and evaluation.
Concerning ANKommEn study case, the datasets included mainly images, point clouds and the derived raster data like orthophotos and Digital Surface Models DSMs (Bobbe et al. 2017). From a logical point of view, datasets were classified based on some criteria such as data type, capturing date and time, for example RGB/thermal images, orthophotos, DSMs and UAV/UGV-based LiDAR. Each type was stored in a specific folder labelled with a specific ID. A client interface was designed in a simple way that enabled data searching and viewing based on three options: date, data type and finally flight list-based option.
State of the art
Information and data play a key role in emergency response, especially when dealing with spatial data like maps, orthophotos and DSMs. Fleischhauer et al. (2017) discussed some theoretical considerations that pointed out the evaluation of the benefits of spatial data in emergency management and disaster scenarios as well as the requirements for the provision of geoinformation products and systems in this field of application. Here, the usage of spatial data is indispensable, because it is definitively involved in many phases and scenarios of emergency management processes from prevention to immediate reaction.
Currently, the techniques for spatial data collection are being rapidly developed, for instance: UAV-based data recording with high-resolution cameras, laser scanner techniques, etc. (Cledat and Skaloud 2020; Goudarzi et al. 2019; Ren et al. 2019; Colomina and Molina 2014). At the same time, tools for spatial data management have been also developed over the last years. For example, Geographical Information System (GIS) can be useful in supporting an operational or situational picture in emergency situations (Hanssen 2018). Spatial data and GIS deliver a valuable spatial framework for reasoning about many problems that can arise in the context of emergency management.
Today, a large number of EU-wide standardization efforts are focusing on spatial data and being increasingly online accessible (Wittmann 2017). Nevertheless, fast spatial data retrieval is still embryonic due to various reasons such as spatial data complexity, storage, management, verification and data sharing in real time. Going from this point of view, in the commercial sector a lot of institutions, societies and companies are increasingly relying on the installation of data management systems that enable a best access to a complete easy-to-use and timely information. For instance, the company PreciselyFootnote 1 has developed a mapping solution for geographic information system (GIS) called “Precisely MapInfo-ProFootnote 2”, which manages and publishes location-based data, and therefore, places and areas of interest can be quickly identified. Another important example is EsriFootnote 3 and its ArcGIS suite. Esri developed the ArcGIS GeoEvent Server—as a software component of ArcGIS Enterprise—for real-time mapping and analytics. It enables integrating real-time event-based data streams as data sources in user’s enterprise GIS. The potential of this software component is that event data can be filtered, processed and sent to multiple targets with the possibility to create connections to any type of streaming data and automatically alert personnel when specified changes or conditions occur (Esri 2019).
From another point of view, in emergency situations, the data retrieval and provision to a range of stakeholders are the most complex phases in the entire cycle because it requires cooperation between various actors relating to emergency sectors. Here, it can be referred to two recent research projects: RECONASSFootnote 4 and INACHUS.Footnote 5 Both projects focused on UAV-based structural damage assessment, also a range of different end users participated, and their evaluation of damage mapping procedures has been respected in the development of mapping frameworks (Kerle et al. 2020). In such kind of projects and in most of emergency scenarios, large amounts of spatial data are collected and often distributed and heterogeneous; therefore, integration with other data and online access for end users is still a complex issue; despite some efforts have been carried out to realize the mentioned data integration. For instance, Esri developed the desktop app “ArcGIS Drone2Map” that helps turning raw still images captured from drones into valuable data and information that could be integrated to ArcGIS products and used for further analysis and applications (Esri 2017). Having such data integration is definitively meaningful, but the challenge here might be to define proper data integration and exchange strategy, which should allow working with heterogeneous data sources and platforms in interoperable ways (Chaturvedi and Kolbe 2019). In the same context, data integration and harmonization are the main focus of INSPIRE Directive – the Infrastructure for Spatial Information in the European. INSPIRE aims to improve the sharing of harmonized spatial data to provide a reasonable platform for data exchange and services between public authorities. Nevertheless, spatial data sharing faces a set of high-level barriers such as (1) data is scattered and locked within their respective sector and hard- and software environments; (2) data are not updated and maintained regularly; (3) finding available data is relatively difficult (Gelagay 2017, 2018). Such barriers led to a key problem in embedding the datasets into data management algorithms or systems automatically and then to retrieve the data of interest in a reasonable way. In response, in this contribution we addressed the development of a geodatabase concept and establishing a sound spatial data sharing mechanism that can help in overcoming some of existing barriers related to automated transferring and sharing of spatial data with focusing on making datasets available for clients in an open way.
ANKommEn—system design
The joint research project ANKommEn (German acronym: Automatische Navigation und Kommunikation zur Exploration; in English: Automated Navigation and Communication for Exploration) was a research project funded by the Federal Ministry of Economic Affairs and Energy (www.bmwi.de). The main result of the project was a development of an automated exploration system. The system was implemented for the management of emergency incidents to capture and provide up-to-date information of an emergency situation, namely spatial data such as georeferenced orthophotos and point clouds. The overall system for data recording consisted of UAVs, UGVs (Fig. 1) and a central ground and control station (Fig. 2). The ground station served as a central human–machine interface to monitor and manage cooperative operation of the UAVs/UGVs by an operator.

source: Batzdorfer et al. (2018)
ANKommEn data capturing system including UAVs (type: AR200) and UGVs (type: Summit XL Robotnik),

source: Batzdorfer, et al. (2018)
ANKommEn—ground control station,
For a fast and reliable data exchange, an intelligent communication structure between system components (agents) has been developed. The system’s structure is illustrated in Fig. 3. Agents within range to each other were able to communicate directly using WIFI, which offered high throughput (e.g. the UGV and UAV on the bottom right of Fig. 3). In case of long-distance communication, it was even possible to communicate without a direct link, utilizing data hopping over arbitrary agents, e.g. the ground station communicated with the UAV, utilizing the UGV as a range extender (bottom of Fig. 3).

source: Batzdorfer et al. (2018)
Flexible communication structure between arbitrary agents using decentral networking and internet,
All agents were equipped with WIFI and 3G/4G modems that enabled communication via internet. Communication via internet was encrypted and secured using a central Virtual Private Network (VPN) server. An exploration process of an area of interest was defined and assigned to the UAVs/UGVs based on initial spatial data available on prior known maps, for instance: placing the working area on google maps, specifying flight waypoints, etc. Exploration areas and tasks were updated with current information of the visual sensors integrated such as RGB camera, thermal camera and LiDAR sensor while performing a mission. This was done by a data streaming process to the ground station via data link functionalities. Within the streaming procedure, an online 2D-georeferenced photo stitching and gathered LiDAR point clouds were transmitted. Path planning was then automatically conducted and transmitted via data links to the unmanned machines. The functionalities applied into ground station were capable to integrate multiple real-time sensor streams of all UAVs/UGVs to get a comprehensive overview of the scenario that to be investigated (Batzdorfer et al. 2018).
Data mapping
Mapping of the desired area is done with two different methods having complementary strengths: Simultaneous Localization and Mapping SLAM and photogrammetry-based approaches. A SLAM-based approach is used to provide a real-time ortho-map of the scene to the operators even during the flight while conventional photogrammetry is used to generate a high-quality ortho-map of the area after the mission is finished. In the following, first, the SLAM-based solution is described. The algorithm aims at generating a high-quality orthophoto and textured 3D meshes in real time. The proposed solution is published as an open-source library called OpenREALM (Kern 2018) on GitHub. The basic flow of the library works as follows:
-
Geotagged images are first passed to a pose estimation stage. There, an interface class allows integrating state-of-the-art visual SLAM frameworks for motion recovery (currently only ORB_SLAM2 (Mur-Artal et al. 2015) is used but can be extended easily with other methods).
-
Extracted camera poses and the sparse cloud in the local coordinate system are subsequently transformed into a Cartesian frame using a best-fit Umeyama algorithm (Umeyama 1991).
-
Densification of the tie points is applied next. External 3D reconstruction frameworks can be integrated into the mapping process to provide high-quality, dense surface information, i.e. Plane Sweep Library (Haene et al. 2014).
-
Afterwards, the rectification of the image data is carried out. By using the linear pinhole model, the prior extracted elevation grid map is re-projected into the camera so the relief displacement induced by the terrain and perspective model is corrected.
-
In the last stage, all incremental images are finally integrated into a global mosaic and blended to correct for any roughness.
The described SLAM-based solution relies on constant features which might not be present in some scenarios (i.e. water, sand, snow). Therefore, a fallback solution using only GNSS location and heading information was also implemented. This allows the system to generate a map even if there are not enough features. Even though the consistency and accuracy of the map obtained with the fallback solution is affected badly, it still provides a reasonable view of the mapped area. More can be seen in Fig. 4, where the various options from this solution and the conventional photogrammetry are compared. Depending on the resources available on the onboard PC, i.e. CUDA compatible GPU, the OpenREALM can be executed with or without 3D reconstruction.

source: Alamouri et al. 2019
A comparison of results achieved using visual mapping approaches—
The other solution uses an offline photogrammetry pipeline based on Agisoft Photoscan Python API (2019) was implemented to enable high-quality results in variety of formats. The process is automatically triggered after the last image of a survey is saved by the drone. The method first aligns all the available images using the features from the individual image. The GPS information available in the images stored as ExifTags is further used to aid in the alignment process. Once the images are aligned, a dense point cloud is generated. The images are ortho-rectified and an ortho-mosaic is generated. The process exports the results in various different formats including the dense cloud and ortho-map which is later used in the web services to visualize (Fig. 5).

source: Alamouri et al. 2019
The relative integrity of the maps generated from SLAM in reference to the PhotoScan after registration—
Point cloud processing
Point cloud data is collected using sensors integrated into ANKommEn system. On both, ground and aerial vehicles, the data processing is done onboard. First step in data processing pipeline is registration of the actual sensor data within a common frame of reference. In the first step, the actual reading from the sensor is pre-aligned using GNSS/IMU. Since the obtained position and orientation (hereafter a combination of translation and orientation is referred to as pose) may be corrupted due to noise or shading effects, a fine registration step is applied afterwards.
Incoming scans are matched to a local reference map. An earth-fixed reference is obtained using Graph-SLAM approach, which relates a locally constructed pose graph with a global one (Schmiemann et al. 2017). Interconnecting both, mainly based on time information, and minimizing the residual in least mean squares sense, leads to an optimal alignment and eventual a reference pose can be obtained, which transforms the local Pose-Graph into a common frame of reference (e.g. UTM). The mapping approach addressed above works well for single vehicles, but tends to non-consistency, if multiple maps are generated by independent agents. To generate more consistent maps, matching algorithms were developed and implemented. Main challenges in this domain included handling of unorganized point cloud data, the huge amount of points per map, and generation of meaningful features to match with little overlap and huge difference in perspective. To achieve accurate matching performance, semi-supervised learning algorithms were utilized. Feature learning is performed directly on point clouds using PointNet (Qi et al. 2016), which originally was designed for classification tasks. The structure can be subdivided into two components. For each point within the map, a representation is learned, which then is pooled, to derive a global feature for the complete map. Those map-wise features are then fed to a classifier, which can be trained, e.g. to approximate a probability distribution over class affiliation. Figure 6 exemplary shows bird’s eye view of different point clouds which have been merged within a common frame of reference in overlay with satellite imagery.

source: Alamouri et al. 2019
Merge of different point clouds (from all vehicles) overlaid with satellite imagery. Trajectories of agents are drawn in color—
Management of data captured
In this section, we introduce two concepts developed for managing the spatial data captured. The first one deals with an automated mechanism for spatial data storage in terms of a real-time synchronization procedure. Within the storage mechanism (Fig. 7, top), spatial data were transmitted automatically from the data capturing system to the ground station using an advanced WIFI communication platform. Once done, the data were streamed and stored in Postgres/PostGIS-based databases with keeping the consistency and harmonization among the data from the source to the target over time.

Concepts for realization of the management methodology of spatial data; (top) developing an automated mechanism for spatial data storage based on a synchronization procedure, (bottom) designing a concept for spatial data sharing and retrieval
In the second concept, an innovative sharing and retrieval of spatial data approach was developed (Fig. 7, bottom). In this concept, a web server for data deployment and publishing has been implemented. In addition, advanced Web Map Tile Service WMTS and “path-to-dataset”–based linkage to Postgres/PostGIS databases have been used to build a user-friendly client interface. Both concepts will be individually explained in detail by the following (cf. Figure 8):
-
Step 1: Spatial data storage
In this step, a conceptual solution was suggested to enable data storage, selection and retrieval in a short time. To this end, the spatial data obtained from ANKommEn system have been classified based on specific parameters like data type, capturing date and time. The benefit from that is to store and select the data of interest in a way that enabled simplification of data look-up in databases.
Figure 8—step1 shows that spatial data stored in the ground station are classified in two data_classes: images and point clouds. The data_class “Images” is structured in two data_types: “Ortho” for orthophotos and “DSM” for digital surface models. The same also for point clouds; there is a data_class “Point Clouds” including the data_type: point clouds “PC”, within it point cloud datasets are stored. Besides having type, date and time stamps in data classification, an ID referred to the number of flight mission f(i) is automatically assigned to dataset labels. The following example is provided to demonstrate the mentioned labelling scheme of a dataset: Dataset X: “date_time_f(i)_type”. The type refers on the one hand to the abovementioned data_types “ortho”, “dsm” and “point cloud”. On the other hand, it indicates to method, software, sensor or system used to create the datasets, e.g. an orthophoto created using software Photoscan (Agisoft Metashape) should have the type syntax: ortho_photoscan. Using such a convention simplifies a structured search in the data, as shown later.
Traditionally, a spatial data provision is possible using web map methods. Web maps are based on a creation of raster/vector tiles technology. These tiles are basically a set of squared georeferenced sub-images placed to each other with a fixed geographical scale defining the visual accessibility to the area of interest. The benefit from tiles is to increase the web map capabilities in terms of data view, where the user can actually browse where he/she is looking at; and the rest will be delivered when the desired position or zoom level in the map is changed.
In our study case, for both datasets orthophotos and DSMs, the Geospatial Data Abstraction Library (GDAL, www.gdal.org) has been used to generate the abovementioned tiles. In contrast, for point cloud datasets, the scenario differs from images, where GDAL library has been developed for reading and writing raster data and is not specifically applicable to point clouds. Therefore, the open-source Potree Converter software (www.potree.org) has been used to create the tiles of point clouds that can be retrieved and rendered in a form of 3D web layers. Potree-based rendering of point clouds in web browsers is carried out with a hierarchical structure, which is based on an adapted modifiable nested octree structure. This structure allows storing subsamples of the original data at different resolutions. A low resolution is stored in the root node (low-level node) and with each level; the resolution gradually increases (Schuetz 2016).
Again, spatial data storage and retrieval in a short time need not only to store the data with a suitable classification, but also to have a platform for data management, where managing the data stored has a direct impact on data provision in emergency situations. For this reason, Postgres/PostGIS-based databases have been implemented as a platform for data management. The potential is that Postgres enables on the one hand a simple access to the data available and on the other hand it offers compatibility with other software that deals with data processing, retrieval and display like QGIS and Geoserver. Moreover, Postgres comes with a quite liberal licence policy. In contrast, PostGIS is a spatial database extender for the Postgres object-relational database. It adds support for geographic objects allowing location queries to be run in the Structured Query Language (SQL).
In Postgres/PostGIS, a dataset is stored in a spatial database allowing a smart and easy data access. At the same time, storing images as raster layers in a PostGIS database is complex because the current concept of Postgres/PostGIS does not support spatial enumeration formats yet. For this reason, a Python-based algorithm has been developed that allows a table-based storage of image metadata like the geographic location of image centers into Postgres/PostGIS database and linking them to the original images.
-
Step 2: Spatial data deployment
Data provision to end users as a client side requires a sufficient communication between clients and datasets. This communication can be achieved using for instance a web server to create a model called “client-web server”, which handles web requests sent by clients. Such models impose that the datasets, namely the tiles generated, should be stored in databases created in the specified web server. In this work, the suggested web server is Tomcat (http://tomcat.apache.org/), which has been implemented to realize the abovementioned model (client-web server) as a linkage between ANKommEn datasets and clients. The potential is that Tomcat enables on the one hand a simple access to the data available and on the other hand it is compatible with other software, programming languages and libraries that deal with data processing, retrieval and viewing like QGIS, jQuery and Ajax.
Accordingly, ANKommEn dataset tiles, generated in step1, have been transmitted to databases created in Tomcat. For this purpose, an automated data synchronization process has been developed to transfer the data from the ground station as data source to web server, namely to Tomcat and to Postgres/PostGIS databases as data destination (Fig. 9). The process enabled transferring and synchronizing data files from the source to the destination, and in the same time establishing consistency among datasets and continuous harmonization of the data over time.
The sync process has been written in a Python-based script using the remote synchronization (rsync) service that enabled automate moving data between data storage source and destination. The sync process was achieved using the Secure Shell (SSH) protocol that is often used for remote terminal connections.
-
Step 3: Web mapping
Having a complete deployment of spatial datasets allows so-called data publishing in a form of web layers defined through specific URLs. By generation of web layers and their URLs, special attention must be paid on the syntax of dataset labels discussed in step1. These labels have been defined in a specific syntax that can be implemented into data searching and selection. From this point of view, a mechanism has been developed to make dataset labels (namely, dataset names described in step1) as a part of the URLs’ syntax. The following instance shows the mentioned URL mechanism: [host/domain name] [: port]/ [path to dataset source + date_time_f(i)_type].
The advantage is that each dataset deployed can be retrieved just by typing its own label scheme and then viewed in a web layer form. The layers are used for creation of friendly interactive maps using advanced map libraries like leaflet. Leaflet is an open-source JavaScript library that enables creating such interactive maps using HTML standards and CCS.Footnote 6 An empirical effort for a leaflet-based mapping has been achieved and applied to the studied area “Wickede” in Germany (Fig. 10). Within this effort, a current orthophoto of the test area has been generated based on photogrammetric processes that applied to RGB images captured using ANKommEn UAV capturing system. Some characteristics related to the orthophoto generated are summarized in Table 1.
Once done, orthophoto tiles have been created using GDAL tool (described in step1) and projected into OpenStreetMapFootnote 7 (OSM) as a basemap supported by leaflet libraries. The projected tiles were deployed in the web server (Tomcat) and published using a leaflet layer generated and defined by its own URL scheme as following:
Wickede: [ankommen]/ [path to dataset source + 20190520_123421_f(4)_ortho_photoscan]

The concept for the management methodology of spatial data: workflow and steps

Scheme of the remote synchronization process

A leaflet-based web map for orthophoto of the studied area Wickede. The orthophoto tiles were projected into OSM as a basemap, published using WMTS and defined as a layer with its own URL
From the URL, one reads that the orthophoto was generated in the mentioned date and time, through the 4th flight mission and using the photogrammetric software Agisoft Metashape.
The photogrammetric process allowed creating 3D point cloud based on the oriented RGB images. The point cloud was converted directly into web layer format using Potree Converter–based tiles (see step1) and then rendered and retrieved as 3D layers using the corresponding URLs. Figure 11 shows, as instance, the point cloud of the same studied area in 3D rendering view that is defined in this case with the following URL:
Wickede: [ankommen]/[path to resource + 20190520_123421_f(4)_pc_photoscan]

Web layer–based 3D rendering of the point cloud of the studied area Wickede using Potree Converter
Within the 3D rendering, the user can navigate, rotate and zoom in/out in the point cloud. In addition, it is possible to measure distances, areas, 3D point coordinates, etc. However, one can know directly that the point cloud has been created at the same date, time and flight assigned to the orthophoto.
-
Step 4: Client interface
Within this step, we developed a concept for a client interface that makes spatial data accessible to end users through internet browsers and mobile platforms. In general, client interface design depends strongly on the data to be retrieved and its characteristics. In the ANKommEn study case, datasets have specific classifications and data structure, which imposed critical emphases, which were respected in the client interface design in order to support users in terms of data selection, retrieval and viewing, for example how to search the data through the web browsers and which parameters should be defined by user to get the data needed. For this, an algorithm was developed as a core concept applied into ANKommEn client interface. The algorithm mainly implemented three filter parameters as basic options for data search and retrieval: date, date and type and flight list (Fig. 12).
The user can choose a search option and define the parameters needed for his/her option selected. For example, choosing the option “date and type” imposes to define not only the date, but also the data_type: orthophotos, DSMs or point clouds. The benefit of data_type definition is to filter the datasets and therefore minimize the time needed for data searching process. In the last option “flight list”, user can retrieve all datasets available based on the ID of flight missions achieved.
After specifying the data search option, the algorithm will send on the one hand a query to the URLs’ datasets (generated in step3) to obtain the corresponding data layer; and on the other hand it sends also a query to the Postgres/PostGIS databases to retrieve another interested metadata which is associated with the data layers, e.g. image name and geographic location of the image centers. Here, if the option parameters defined by the user are met, the corresponding URLs and metadata will be caught, and the related web layers will be retrieved and viewed in the client interface.

The concept for data searching and retrieval applied into ANKommEn’s client interface to be accessed via internet browsers and mobile platforms
Evaluation and analysis
In the project framework, we had no first responders as test persons or empirical test case; therefore, we address briefly in this section an assessment of results related to UAV/UGV mission campaign achieved and considered a test case simulating somehow emergency scenarios. The campaign was conducted with missions including 8 UAV flights and 8 UGV trajectories in the test field “Edemissen”, which was basically an airfield located in ca. 38 km northwest of the city Brunswick/Germany and covers area of average 0.64 km2. To this end, the assessment procedure has been carried out in the basis of formal evaluation criteria that will be discussed by following:
-
SLAM and photogrammetry-based data mapping
As can be seen from Fig. 4 qualitatively, the ortho-map from the Photoscan is the most consistent in comparison to the SLAM-based solution. This advantage comes at the cost of computational resources required for the data processing. SLAM solution which uses the 3D reconstruction on the other hand is slightly worse but has the advantage that the map is available for the user to see in real time which can be critical in some scenarios. The relative integrity of the SLAM-based solution can be quantified by taking Agisoft ortho-map as the ground truth. The deviations of all the object locations from Fig. 5 are then averaged and calculated for all the methods. The results are presented in Table 2. It is clear that the planar assumption results in the highest error and when the elevation is considered by taking into account the sparse or dense point clouds, the relative integrity is much better.
Table 2 Relative orthophoto integrity errors for all approaches -
Data transmission
The process of data transmission and its time were influenced by the size of data obtained from UAV flights and UGV trajectories. The larger data size, the more time needed for data transmission from the ground station to both: web server (Tomcat) and Postgres/PostGIS databases.
In the following, first, the transmission of data collected from UAV flights is discussed. The flight missions covered the whole test area and delivered the following datasets: (1) orthophotos and DSMs generated using SLAM and photogrammetry-based approaches, and (2) point clouds generated based on the photogrammetric process. Sizes of the mentioned datasets and the time needed for data transmission are depicted in Fig. 13. One can see that the largest data size (ca. 2 GB) was obtained from the last flight F8. The results showed that a complete transmission of the mentioned data size required more than 8 min. It, therefore, indicated that the achievable transmission rate was approx. 4 MB/s, which was smaller than the theoretical peak data rate (10 MB/s) provided by 3G/4G modems integrated into ANKommEn system. This was interpreted due to different factors affecting the transmission process and the time needed for data streaming such as signal strength, location of working area and free space.
Fig. 13 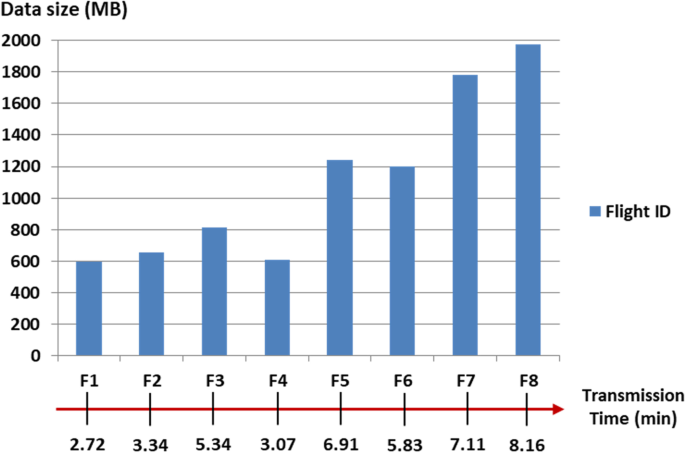
Characteristics of empirical test flights (eight flights: F1 to F8). One can see data sizes obtained from each flight and the time needed for data transferring: on the one hand to the web server and on the other hand to Postgres/PostGIS databases
From another side, Fig. 14 shows data sizes of point clouds generated in each UGV trajectory (TJ) and the transmission time. It is clear that the largest data size (ca. 900 MB) was gained from the 5th UGV trajectory, and it needed more than 6 min for a complete transmission. It indicated that the achievable transmission rate was approx. 2.4 MB/s, which was also smaller than the theoretical peak data rate. In the same manner, we interpreted this due to different factors—mentioned in UAV flights—that affected the whole transmission process and the time needed for data streaming.
Fig. 14 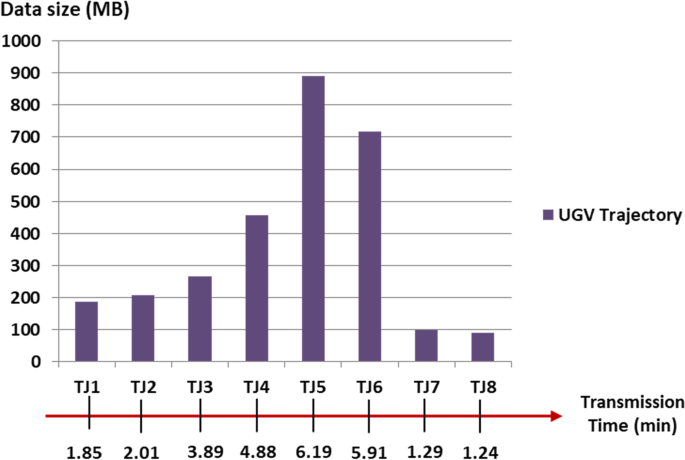
Characteristics of UGV trajectories TJ1 to TJ8 and sizes of datasets (point clouds) obtained from each trajectory as well as the time needed for data transferring: on the one hand to the web server and on the other hand to Postgres/PostGIS databases
Obviously, data reduction might be a key factor affecting the transmission process and it is time consuming, but in emergency scenarios, it is not recommended, because emergency managers need as detailed data and information about the situation as possible. Therefore, we aim—as a future task—to improve the transmission process by focusing on sync performance and its functionalities as well as on the technical limitations like sync cycle and computational power of data sync.
-
Usability of client interface
Usability evaluation is a key issue of the overall client interface design process. It consists of methodologies and criteria for measuring the usability aspects of client interface (Dix et al. 1998; Nielsen 2003, 1993). For our study case, the usability of ANKommEn’s client interface has been evaluated with respect to the following characteristics:
-
Consistency: the initial results showed that the client interface has been well designed with respect to important conceptual and logical standards of web design. It enabled a reasonable mechanism and performance of the relevant organizational and functional tasks. Therefore, users can get familiar with the website commands without spending time to learn new techniques and roles. In addition, implementation of standards for color, positioning, page titles, etc. helps prevent a complication in the navigation on the website.
-
User control: the concept used for the client interface offered control options for the interface. For instance, user can go forward or back pages, go to homepage, cancel the operations, etc.
-
Ease of learning: the interface was designed in a simple form to avoid any complexity in the usage as possible. Therefore, it avoided using complex technical terms, elements or icons that are not familiar to users. Nevertheless, the interface was not for complete laymen. It is to say that after a short introduction to the system and the client interface, firefighters or other first responders can use it. Some items like Ortho, DSM and point cloud are expressed with more information using the functionality of “pop-up box” just by hovering over the item selected.
-
-
Search options and data retrieval
The search process enabled an easy data filtering and selection, because the search mechanism was designed and realized based on specific parameters like data type and date. Such search process connected to the search content has a crucial influence on the client interface for search engines because it allows detecting the kind of information to be retrieved and viewed. Nevertheless, it is essential—in the future work—to improve the concept used for data search options by definition other criteria as additional parameters for data filtering, e.g. searching based on coordinates referred to the area of interest, etc. Finally, and according to the retrieval concept applied, the initial results indicated that the retrieval system provided the data needed sufficiently. It found the data requested and informed the end users on the existence and whereabouts of data related to his/her query.


Conclusion
Retrieving and providing correct and timely spatial data in emergency situations have been a continuous research problem for decades, and for rapid operational disaster response, reliable automated methods continue to be lacking. From this point of view, we came up to the main focus of this paper that was to develop an effective methodology for spatial data management with focusing on enabling access and viewing the data in real time and in situ to support managers and operators in managing emergency cases. For this purpose, a mechanism for spatial data synchronization and streaming has been automatically developed. Furthermore, the management methodology enabled an integrated design of 2D and 3D client interfaces that allowed retrieving spatial data of interest, which were classified and stored in web server as well as in Postgres/PostGIS-based geospatial databases.
Nevertheless, more efforts are needed to improve the proposed methodology in the context of simplification of database design, especially in terms of advanced relationships between geospatial data and database tables created in Postgres/PostGIS.
Change history
06 November 2021
Springer Nature’s version of this paper was updated to reflect the missing Open Access funding note.
Notes
CSS: Cascading Style Sheets language used for describing the presentation of a document written in a mark-up language like HTML.
References
Agisoft Photoscan Python API (2019) Reference 1.5.0, https://www.agisoft.com/pdf/metashape_python_api_1_5_0.pdf. Accessed 8 Dec 2020
Alamouri A, Gerke M (2019) Development of a geodatabase for efficient remote sensing data management in emergency scenarios. ISPRS Ann Photogramm Remote Sens Spatial Inf Sci IV-2/W5:87–93. https://doi.org/10.5194/isprs-annals-IV-2-W5-87-2019
Alamouri A, Gerke M, Batzdorfer S, Becker M, Bestmann U, Bobbe M, Khedar Y, Blume T, Schattenberg J, Schmiemann, J (2019) The joint research project ANKommEn - Exploration using automated UAV and UGV. The International Archives of the Photogrammetry, Remote Sensing and Spatial Information Sciences, Volume XLII-2/W13, ISPRS Geospatial Week 2019, 10–14 June 2019, Enschede, The Netherlands.
Batzdorfer S, Bobbe M, Becker M, Bestmann U (2018) Autonomous multi-sensor survey with teamed ground and air vehicles. GPS World, pp 28–36
Bobbe M, Kern A, Khedar Y, Batzdorfer S, Bestmann U (2017) An automated rapid mapping solution based on ORB SLAM 2 and Agisoft Photoscan API. In: Conference proceeding: IMAV, Toulouse, France
Chaturvedi K, Kolbe T (2019) Towards establishing cross-platform interoperability for sensors in smart cities. Sensors (Basel) 19(3):562. https://doi.org/10.3390/s19030562
Cledat E, Skaloud J (2020) Fusion of photos with airborne Laser scanning. ISPRS Ann Photogramm Remote Sens Spatial Inf Sci V-1-2020:173–180. https://doi.org/10.5194/isprs-annals-V-1-2020-173-2020
Colomina I, Molina P (2014) Unmanned aerial systems for photogrammetry and remote sensing: A review. ISPRS J Photogramm Remote Sens 92:79–97
Dix A, Finlay J, Abowd G, Beale R (1998) Human-computer interaction, 2nd edn. Prentice Hall, Upper Saddle River
Esri (2019) ArcGIS GeoEvent Server quick start guide, URL: https://www.esri.com/content/dam/esrisites/en-us/media/pdf/guides/quickstart-arcgis-geoevent-server.pdf. Accessed 12 Jan 2020
Esri (2017) Drone2Map: An Introduction. Source URL: https://proceedings.esri.com/library/userconf../epug17/papers/epug_33.pdf. Accessed 18 Jan 2020
Fleischhauer S, Behr FJ, Rawiel P (2017) Concept and implementation of an architecture for the immediate provision of geodata in disaster management. In: The International Archives of the Photogrammetry, Remote Sensing and Spatial Information Sciences, Volume XLII-4/W2, FOSS4G-Europe – Academic Track, 18–22 July 2017, Marne La Vallée, France.
Gelagay HS (2017) Geospatial data sharing barriers across organisations and the possible solution for ethiopia. IJSDIR 12:62–84
Gelagay H S (2018) Geospatial data sharing barriers across organizations and the possible solution for ethiopia. In: Proceedings of the 4th international conference on geographical information systems theory, applications and management, pp 269–273. https://doi.org/10.5220/0006778802690273
Goudarzi S, Kama N, Anisi H, Zeadally S, Mumtaz S (2019) Data collection using unmanned aerial vehicles for Internet of Things platforms. Comput Electr Eng 75(2019):1–15
Haene C, Heng L, Lee GH, Sizov A, Pollefey M (2014) Real-time direct dense matching on fisheye images using plane-sweeping stereo. IEEE Computer Society, pp 57–64. https://doi.org/10.1109/3DV.2014.77
Hanssen Ø (2018) Position tracking and GIS in search and rescue operations. Book chapter source available at: https://doi.org/10.5772/intechopen.75371
Kerle N, Nex F, Gerke M, Duarte D, Vetrivel A (2020) UAV-based structural damage mapping: a review. ISPRS Int. J. Geo-Inf. 2020, 9(1), 14; Article source available at: https://doi.org/10.3390/ijgi9010014
Kern, A., 2018. Real-time photogrammetry using monocular SLAM for unmanned aerial vehicles; Master thesis at Institute of Flight Guidance, TU Braunschweig, Source: https://github.com/laxnpander/OpenREALM. Accessed 22 Oct 2020
Mur-Artal R, Montiel JMM, Tardós JD (2015) ORB-SLAM: a versatile and accurate monocular SLAM system. IEEE Trans Rob 31(5):1147–1163
Nielsen J (1993) Usability Engineering. Academic Press, Boston
Nielsen J (2003) Usability 101 introduction to usability. https://www.nngroup.com/articles/usability-101-introduction-to-usability/. Accessed 6 Feb 2021
Qi CR, Su H, Mo K & Guibas LJ (2016) PointNet: deep learning on point sets for 3D classification and segmentation (cite http://arxiv.org/abs/1612.00593). Accessed 4 Jan 2021
Ren H, Zhao Y, Xiao W (2019) Hu Z (2019) A review of UAV monitoring in mining areas: current status and future perspectives. Int J Coal Sci Technol 6:320–333
Schmiemann J, Harms H, Schattenberg J, Becker M, Batzdorfer S, Frerichs L (2017) A distributed online 3D-lidar mapping system. Int Arch Photogramm Remote Sens Spatial Inf Sci XLII-2/W6:339–346. https://doi.org/10.5194/isprs-archives-XLII-2-W6-339-2017
Schuetz M (2016) Potree: rendering large point clouds in web browsers. Diploma Thesis, TU Wien
Wittmann H (2017) Value of spatial information for emergency response organisations. EENA Operations Document, Version 2 (16–01–2017)
Umeyama U (1991) Least-squares estimation of transformation parameters between two point patterns”. In: IEEE Trans. Pattern Anal. Mach. Intell. 13.4 (Apr. 1991), pp. 376–380. issn: 0162–8828. https://doi.org/10.1109/34.88573
Acknowledgements
The presented work was done within the joint research projects ANKommEn and ANKommen2 funded by the German Federal Ministry of Economic Affairs and Energy administrated by the Space Administration of the DLR (ANKommEn—funding code: 50NA1518, ANKommEn2- funding code 50NA1807).
Funding
Open Access funding enabled and organized by Projekt DEAL.
Author information
Authors and Affiliations
Corresponding author
Rights and permissions
Open Access This article is licensed under a Creative Commons Attribution 4.0 International License, which permits use, sharing, adaptation, distribution and reproduction in any medium or format, as long as you give appropriate credit to the original author(s) and the source, provide a link to the Creative Commons licence, and indicate if changes were made. The images or other third party material in this article are included in the article's Creative Commons licence, unless indicated otherwise in a credit line to the material. If material is not included in the article's Creative Commons licence and your intended use is not permitted by statutory regulation or exceeds the permitted use, you will need to obtain permission directly from the copyright holder. To view a copy of this licence, visit http://creativecommons.org/licenses/by/4.0/.
About this article

Cite this article
Alamouri, A., Hassan, M. & Gerke, M. Development of a methodology for real-time retrieving and viewing of spatial data in emergency scenarios. Appl Geomat 13, 747–761 (2021). https://doi.org/10.1007/s12518-021-00389-w
Received:
Accepted:
Published:
Issue Date:
DOI: https://doi.org/10.1007/s12518-021-00389-w