
Abstract
We present an overview of a research platform that provides essential germplasm, genotypic and phenotypic data and analytical tools for dissecting phenotype–genotype associations in rice. These resources include a diversity panel of 400 Oryza sativa and 100 Oryza rufipogon accessions that have been purified by single seed descent, a custom-designed Affymetrix array consisting of 44,100 SNPs, an Illumina GoldenGate assay consisting of 1,536 SNPs, and a suite of low-resolution 384-SNP assays for the Illumina BeadXpress Reader that are designed for applications in breeding, genetics and germplasm management. Our long-term goal is to empower basic research discoveries in rice by linking sequence diversity with physiological, morphological, and agronomic variation. This research platform will also help increase breeding efficiency by providing a database of diversity information that will enable researchers to identify useful DNA polymorphisms in genes and germplasm of interest and convert that information into cost-effective tools for applied plant improvement.
Introduction
Only a small fraction of the naturally occurring genetic diversity available in rice germplasm repositories around the world has been explored to date. This is beginning to change with the advent of affordable, high-throughput genotyping approaches coupled with robust statistical analysis methods that make it possible to examine genome-wide patterns of natural variation and link sequence polymorphism with complex trait variation. Association mapping offers one way of identifying genes and quantitative trait loci (QTL) underlying quantitatively inherited variation in both plants and animals based on the analysis of diverse collections of wild and domesticated strains. This approach is opening the door to new forms of collaboration aimed at discovering the function of the genes and identifying under-utilized alleles and allele combinations that can be used to drive improvements in crop performance (Ersoz et al. 2009; Flint-Garcia et al. 2005; Richards et al. 2009; Zhu et al. 2008). Similar to traditional QTL mapping, genome-wide association mapping relies on the strength of linkage disequilibrium (LD) across a diverse population, and aims to identify relationships between markers and functional polymorphisms that determine traits of agronomic, aesthetic, and evolutionary interest. However, it does so in the context of evolutionary biology and population genetics (Clark et al. 2007; Zhao et al. 2007), providing an open-ended opportunity to mine existing breeding populations and germplasm collections for valuable alleles that have not been previously captured in plant breeding programs (Tanksley and McCouch 1997).
In this paper, we present an overview of the development of a research platform that provides essential germplasm, genotypic and phenotypic data, and analytical tools for dissecting phenotype–genotype associations in rice. These resources include a diversity panel consisting of 400 Oryza sativa and 100 Oryza rufipogon accessions that have been purified by single seed descent, a custom-designed Affymetrix array consisting of 44,100 SNPs, an Illumina GoldenGate assay consisting of 1,536 SNPs (Zhao et al. 2010), and a suite of low-resolution 384-SNP assays designed for the Illumina BeadXpress Reader that are designed for applications in breeding, genetics and germplasm management. We are developing a database to provide access to the SNP diversity data on our panel of germplasm (44,100 SNP genotypes × 500 rice accessions); the data will be available for download from our project web site (www.ricediversity.org) and through the Gramene database (www.gramene.org). The diversity panel has also been phenotyped for a core set of morphological and developmental traits under both controlled and field conditions (Ali et al. 2010a; Kovach et al. 2009; Sweeney et al. 2007; Takano-Kai et al. 2009). In parallel, we have developed novel computational methods for SNP selection, allele calling, and quality control that permit the incorporation of inbreeding information on a per-sample basis, allowing for accurate genotyping of both inbred and heterozygous samples (Wright et al. 2010). We have used our SNP diversity dataset to develop and optimize several 384-SNP genotyping assays for use in applied breeding programs. We are simultaneously developing six interspecific libraries of chromosome segment substitution lines (CSSLs) to complement the arsenal of mapping populations and other genetic resources available for validating QTLs and unraveling the gene networks underlying complex trait variation in wild and cultivated rice.
Our long-term goal is to empower basic research discoveries in rice by linking sequence diversity with physiological, developmental, morphological and agronomic variation. This research platform will help increase breeding efficiency by providing a database of diversity information that will enable researchers to readily identify useful DNA polymorphisms in genes or germplasm samples of interest and convert that information into cost-effective tools for basic biological inquiry and applied plant improvement.
Use of low, medium, and high-resolution SNP assays and re-sequencing strategies
Different types of research require different tool kits to be successful. The rice research community supports a wide spectrum of both basic and applied activities aimed at understanding and utilizing natural variation. These include evolutionary biology and population genetics inquiries, QTL mapping and gene discovery, allele mining and germplasm management, and pre-breeding and variety development, among others. In addition to selecting a platform best suited for one’s research interests, decisions about the genotyping platform may revolve around cost efficiency, turn-around time, throughput, information content and ease of use and analysis.
By developing a set of SNP genotyping platforms that vary in resolution and species/population/specificity, we aim to facilitate different types of research that focuses on the exploration and utilization of natural variation in rice. In addition to SNP-detection platforms, second- and third-generation re-sequencing approaches are rapidly coming down in cost, but are currently ten times more expensive than fixed arrays (such as the Affymetrix SNP-detection arrays based on 44,000-SNPs or 950,000 SNPs), and require significantly higher levels of bioinformatics expertise for data generation and analysis. High-resolution SNP-detection platforms are useful for generating large databases of information about SNP diversity on hundreds or thousands of lines from a germplasm collection or breeding program. Fixed arrays with >40,000 SNPs are sufficient for genome-wide association mapping in rice (see section on LD) and provide insight into population substructure, while chips with 950,000 SNPs support gene discovery and functional genomics research and offer a powerful tool for allele mining in germplasm collections. Data generated using high-resolution SNP chips also provides essential information that enables rapid development and deployment of low-resolution assays that are technically easier and more economical to run.
To be attractive to the breeding and genetics communities, low-resolution SNP-detection assays must be inexpensive, high-throughput, accurate and require little technical investment. Low-resolution assays are generally custom-designed for a particular population, and may be used to rapidly assay hundreds or thousands of individuals within a short time window. Genotyping platforms such as the Illumina BeadXpress Reader provide rapid, low-cost 96 or 384-plex SNP genotyping for a variety of applications, including primary QTL analysis, NIL development and backcross conversion, varietal identification, quality control in the market or as part of germplasm management, to ensure outcrossing or inbreeding in a hybrid rice program, or to fine map a target region in a gene-discovery program. Likewise, the 1,536-SNP GoldenGate assay is ideally suited for genomic selection in a breeding program. At this level of resolution, the assay is likely to detect polymorphism across a range of individuals with varying levels of relatedness. It can be used on a large number of individuals over many years if it is well designed and able to capture the essential components of variation in the breeders’ gene pool.
Development of Illumina and Affymetrix SNP genotyping assays
Both Illumina and Affymetrix genotyping platforms were used to develop genome-wide SNP assays for rice. A 1,536-SNP assay was developed for SNP detection using the Illumina GoldenGate platform, a 44,100-SNP chip was developed for use with the Affymetrix Custom Array platform and several 384-SNP Veracode assays have been developed for the Illumina BeadXpress Reader. The SNPs selected for the GoldenGate and BeadXpress assays were also used in the Affymetrix array to enable us to compare call rates and genotyping accuracy across platforms. In all cases, the success of the SNP assays depends on the availability of high-quality DNA samples as the starting reagent.
-
1.
1536-SNP Illumina GoldenGate Assay: SNPs were selected from a SNP discovery pool generated by re-sequencing 20 diverse landraces of rice using Perlegen re-sequencing technology (www.oryzasnp.org; McNally et al. 2009). The 20 O. sativa accessions that were re-sequenced to form the discovery dataset included seven indica, three aus, five tropical japonica, four temperate japonica, and a single accession each of Group V (aromatic), Aswina and Rayada (McNally et al. 2006); see discussion of O. sativa population structure below). The choice of SNPs from the discovery pool was done in a step-wise manner (Zhao et al. 2010). During the first stage, we obtained a designability score estimate for virtually all available SNPs using the Illumina design tool. For those that were in perfect LD with other SNPs within 500 kb, we prioritized those with high frequency scores in the tropical japonica, temperate japonica, and the indica and/or aus subpopulations. We were able to calculate site frequency spectra and target SNP variation within only these four major subpopulations because re-sequencing information was available for only one accession each of Aswina, Rayada and Group V. Our final selection identified a set of 1,536 well-distributed SNPs (Zhao et al. 2010). A map showing their distribution on the 12 chromosomes of rice is presented in Fig. 1.
Fig. 1 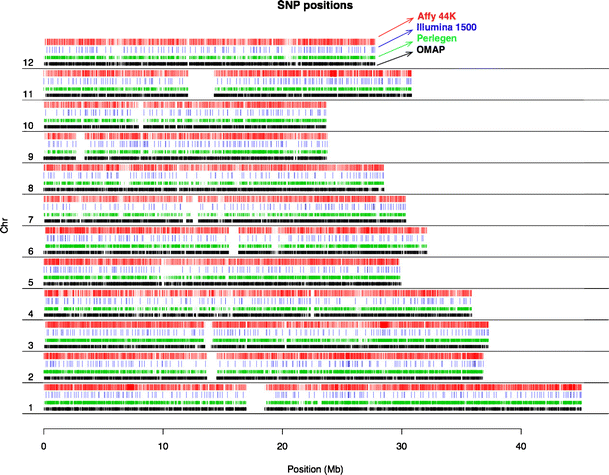
SNP distribution along the 12 chromosomes of rice. Red and blue color-coded bars represent SNP positions deployed on the Illumina 1536 SNP assay and the Affymeterix 44 K array; green and black bars show the original SNP discovery pools generated by the OryzaSNP (Perlegen sequencing; McNally et al. 2009) and the OMAP (http://www.omap.org/) projects.

Based on genotyping of the O. sativa samples in our diversity panel using the 1,536-SNP GoldenGate assay, 1,311 SNPs (85%) were determined to be of high quality based on low error rates computed from posterior probabilities (Wright et al. 2010). We used several standard controls on all plates that were genotyped, including the reference genome line Nipponbare, 93-11, an F1 between Nipponbare and 93-11 (kindly supplied by Guo-liang Wang of Ohio State University) and a “pseudo F1” that was prepared by mixing equal amounts of genomic DNA from Nipponbare and 93-11. For both Nipponbare and 93-11, we expected to know the true allelic state from the published genome sequence and we deduced the genotypic state of the F1 from these sequences. This external validation showed highly accurate calls in both inbred control samples as well as the F1s and pseudo F1s, with overall average pairwise concordance of 99.4% between technical replicates, accuracies of >99% and call rates >95% (Zhao et al. 2010).
-
2.
Development of 44,100-SNP Affymetrix custom array: the 44,100-SNP array was designed to provide genome-wide coverage of the rice genome at ~1 SNP/10 kb, a density that was expected to support association mapping (see section on “Estimates of linkage disequilibrium below for rationale). The 44 K array also allowed us to expand our database of polymorphisms for the 500 accessions in our diversity panel by almost 30-fold.
We again selected SNPs from the OryzaSNP dataset described above (McNally et al. 2009), and supplemented with SNPs discovered from BAC-end sequences of two O. rufipogon accessions generated by the OMAP project (www.omap.org; Ammiraju et al. 2006). The BAC-end sequences had been aligned to the Nipponbare genome (www.gramene.org). Using similar criteria as for the 1536-SNP chip, we identified tag-SNPs using a conservative tagging window size of 50 kb and eliminated SNPs that had more than one hit in the genome and/or more than one mismatches. One thousand two hundred forty-three reliable SNPs from the Illumina SNP chip were included in the Affymetrix array for cross-platform validation. SNPs from the OMAP data were used to fill in gaps >20 Kb between the tag-SNPs. Finally, we added an additional 4,000 SNPs from four highly polymorphic regions (two on chr 1, one on chr 3, and one on chr 11) to provide finer scale evaluation of LD decay in specific regions based on genotyping in our diversity panel (Fig. 1).
Based on genotyping of the ~400 O. sativa samples in our diversity panel, >90% of the 44,100 SNPs on the array passed our QC criteria. These were based on the expected error rates computed from posterior call probabilities (Wright et al. 2010). Of these SNPs, the inbred samples run to date have a median call rate of 95.9%. Control samples, as in the Illumina array, show a high degree of agreement with external validation data of the published Nipponbare and 93-11 genome sequences. Additionally, based on control samples that were run on each plate, pairwise concordances between technical replicates yielded >99% average pairwise concordance and >92% average call rate.
SNP call rates on the 100 O. rufipogon samples are significantly lower than for the O. sativa samples for both the 1536-SNP and the 44,100-SNP assays. This is primarily due to flanking sequence variation in the wild ancestor for which minimal SNP discovery data was available when the assays were developed. There has been a massive outpouring of new sequence information for both wild and both Asian- and African-cultivated rice over the past year, making it possible improve the call rate for arrays targeting wild strains of rice in the future. Our work to date underscores the importance of a high-quality SNP discovery pool for developing reliable, cost-effective SNP-detection assays.
-
3.
Development of 384-SNP assays for applications in genetics and breeding: the availability of re-sequencing data on an increasing number of accessions and SNP diversity data on 400 O. sativa samples provides a database of critical information about the frequency of individual SNPs in different subpopulations or varieties. We have successfully used this information to develop a suite of “breeders chips” in collaboration with colleagues at IRRI and in the USDA-ARS. Each breeder’s chip consists of 96 or 384-SNPs that can be used to economically and rapidly assay large numbers of lines from segregating populations using Illumina’s BeadXpress platform.
The SNP chips we have designed to date provide optimal genome coverage across the 12 chromosomes of rice or targeted coverage across specific regions of the genome. SNPs are selected to target polymorphisms in specific pairs of parents, within or between different subpopulations. For example, 384-SNP chips have been optimized for indica × japonica populations commonly used for QTL mapping, others for indica × aus or tropical × temperate japonica breeding populations and some for indica × O. rufipogon or japonica × O. rufipogon populations.
Our collaboration with USDA-ARS colleagues required that we identify a set of genome-wide SNPs that could differentiate elite US tropical japonica lines as the basis for mapping QTLs from within this narrow gene pool. As part of the RiceCAP project (http://www.ricecap.uark.edu/), nine US tropical japonica genomes were re-sequenced to generate a large SNP discovery pool, providing the base for the selection of a set of well-distributed SNPs that were used to build a 384-SNP chip for US breeders. Colleagues in Japan have undertaken a similar strategy for developing SNP assays that allow rice breeders in Japan to trace the inheritance of genome segments across elite Japanese temperate japonica varieties (Nagasaki et al. 2010; Yamamoto et al. 2010). The rapidly expanding reservoir of SNP-based diversity information provides a critical resource for developing a wide array of useful genotyping tools for applications in genetics, germplasm management, and plant improvement.
The genotypic and phenotypic diversity datasets from the project described in this paper will be publicly available as downloadable PLINK files (Purcell et al. 2007). We are currently designing an application that will automate the SNP selection process so users can build customized 96 or 384-SNPs arrays based on their lines of interest and preferred SNP density across the genome. The SNP selection tool will be available from our project website (www.ricediversity.org) and a SNP query tool is now available in the Gramene Database (www.gramene.org). All the data from this project will also be integrated into the Genetic Diversity Module of the Gramene database where it can be viewed in the context of other diversity and genomic information available in plants (http://www.gramene.org/db/diversity/diversity_view).
Development of the rice diversity panel
A collection of ~400 diverse O. sativa accessions from 79 different countries, including both landraces and elite varieties, along with ~100 accessions of O. rufipogon from 14 different countries in Asia forms the basis for the germplasm diversity panel in this study. These accessions were selected to represent the range of geographic and genetic diversity of the species (Garris et al. 2005; Yan et al. 2007; K. McNally, pers. comm.; J. Jung, pers. comm.) and include 18 varieties used for SNP discovery in the OryzaSNP dataset (McNally et al. 2009), 150 from the study by (Garris et al. 2005), 159 from the USDA-ARS NSGC rice core collection (Yan et al. 2007), and 16 lines previously used as mapping parents in published QTL studies (www.gramene.org). Information about the accessions is available in Ali et al.( 2010a) and at the project website, www.ricediversity.org.
Purification of seed stocks
All accessions were purified for two generations (single seed descent) prior to DNA extraction, and DNA for genotyping was extracted from single plants (Ali et al. 2010a; Fig. 2). Purification was necessary because a majority of the accessions are landraces and seed stocks in the major germplasm repositories are known to be heterogeneous (Olufowote et al. 1997). Photographs of single panicles and seed samples from each purified accession in the diversity panel are available on-line for quality control and plant identification purposes (www.ricediversity.org). All O. sativa accessions in this Diversity Panel will be distributed as genetic stocks from the USDA-ARS Genetic Stocks Oryza Center in Stuttgart, Arkansas where images of the panicles and seeds are available (www.ars.usda.gov/Main/docs.htm?docid=8318) and through the T.T. Chang Genetic Resource Center at IRRI (www.irri.org/GRC/GRChome/Home.htm).

Flow diagram showing seed purification process for rice diversity panel. aGenetic Stocks Oryza (http://www.ars.usda.gov/Main/docs.htm?docid=8318).
Population structure in O. sativa
O. sativa has a highly structured population, with six major subgroups identified using isozymes (Glaszmann 1987) and five subpopulations defined using SSRs (Garris et al. 2005) and/or SNPs (Caicedo et al. 2007; Zhao et al. 2010). Two of the subpopulations, indica and aus, as well as the minor groups, Aswina and Rayada (identified by isozymes), cluster within the Indica varietal group, while tropical japonica, temperate japonica and aromatic (Group V) share a recent Japonica ancestor (Caicedo et al. 2007; Garris et al. 2005; Kovach et al. 2009). Using our 1,536-SNP and 44,100-SNP assays, these subpopulations are genetically well-differentiated from each other (Table 1), with estimates of divergence showing pairwise Fst values ranging from 0.23 to 0.53 (Garris et al. 2005) and 0.36 to 0.57 (Ali et al. 2010) as compared to Fst values of 0.09–0.18 for Oryza glaberrima in Africa (Semon et al. 2005), 0.08–0.09 for heterotic groups in maize (Matsuoka et al. 2002), 0.087–0.290 for US wheat germplasm collection (Chao et al. 2007), 0.37–0.86 for Ethiopian and other barley populations (Saisho and Purugganan 2007) and 0.20–0.88 for Arabidopsis thaliana population (He et al. 2007; Nordborg et al. 2005).
In O. sativa, the deep population structure poses significant challenges for association mapping because functional variation that is highly correlated with subpopulation structure cannot be distinguished from all other (non-causative) subpopulation-correlated genetic variation. Thus, population structure limits the power of association mapping where a trait is highly correlated with the degree of genetic relatedness. Subpopulation structure also sub-divides the primary gene pool of rice into highly differentiated germplasm groups and in some groups there is a paucity of historical recombination that limits mapping resolution (i.e., in the temperate japonica and aromatic subpopulations; Myles et al. 2009; Rakshit et al. 2007). As a result, much larger sample sizes are needed to provide the power required for associating genotype with many traits of interest to the rice community, particularly where the genetic architecture of the trait differs across subpopulations (Sneller et al. 2009).
Population structure in O. rufipogon
The population structure of O. rufipogon is less well-defined than that of O. sativa. O. rufipogon is a species complex, often referred to as Oryza perennis (Vaughan et al. 2008). It consists of both perennial and annual forms which are referred to as O. rufipogon and Oryza nivara, respectively (Morishima et al. 1984). However, a lack of reproductive isolation, coupled with evidence of continuous variation, substantiates the view that these annual and perennial forms are more accurately viewed as distinct ecotypes of O. rufipogon (Barbier et al. 1991; Lu et al. 2002; Oka 1988; Zhu and Ge 2005; Zhu et al. 2007). For most of the twentieth century, O. rufipogon held little interest for rice breeders or producers, except as a weed to be eliminated from their fields, while rice geneticists recognized it as a source of cytoplasmic male sterility, disease and insect resistance (Brar and Khush 1997; Song et al. 1995). More recently, it has also been shown to be an important reservoir of useful genes for enhancing yield (Marri et al. 2005; Cho et al. 2003; Xie et al. 2008; McCouch et al. 2007). Molecular marker-based analysis has also been used to characterize the population structure of O. rufipogon and relate it to geographic and ecological differentiation (Liu et al. 2007; Londo et al. 2006; Vaughan et al. 2008; Wang et al. 2008). However, due to the use of different accessions by different groups, the global subpopulation structure of this wild species remains poorly defined. An international effort to coordinately analyze a geographically and ecologically diverse collection of wild germplasm will be required to fully document the structure of existing O. rufipogon populations.
Estimating the number of SNPs needed for genome-wide association mapping in rice
The number of markers needed to perform genome-wide association mapping is determined by the extent of LD, or allelic association, in the species or population(s) under investigation. LD is defined as the nonrandom association of alleles at different loci in a population (Flint-Garcia et al. 2003). It is measured as the strength of correlation between polymorphisms (i.e., SNPs) caused by their shared history of recombination. Levels of LD are increased when polymorphisms are correlated as a result of linkage, selection, and/or admixture, while recombination and independent assortment decrease levels of LD. Because effective recombination is lower in naturally self-pollinating species, compared to outcrossing species, inbreeding species such as rice tend to have extensive genome-wide LD.
The genomic distance over which LD persists will determine the number and density of markers needed to perform a genome-wide association analysis. If LD decays within a short distance, mapping resolution is expected to be high, but a large number of markers are required. If LD extends over a long distance, then mapping resolution will be low, but a relatively small number of markers are required for genome-wide association studies.
Estimates of linkage disequilibrium
Estimates of LD in O. sativa are ~100 kb in indica and aus, (Garris et al. 2003) and longer in tropical japonica, temperate japonica and Group V (aromatic) (Mather et al. 2007; Garris et al. 2003). LD decays more quickly in O. rufipogon (~30–50 kb; Rakshit et al. 2007) where levels of outcrossing are 20–30%, compared to levels of only ~2–3% in O. sativa. Based on the 44 K SNP data generated on this project, we observe similar rates of LD decay in these different species and subpopulations (K. Zhao, pers. comm.).
Due to the fact that many SNPs occur at high frequency in some, but not all subpopulations, and that some SNPs will be specific to a particular subpopulation, the predicted number of SNPs required to “tag” the majority of haplotype blocks in the rice genome is expected to be on the order of ~20,000–30,000 SNPs. To achieve this density, and assuming a genome size of ~400 Mb, approximately 4,000 informative SNPs would be needed within each of the indica and aus subpopulations (~1 SNP per 100 kb), ~800 SNPs would be needed within the tropical japonica and temperate japonica subpopulations (~1 SNP per 500 kb), and a minimum of ~8–12,000 well-distributed SNPs would be needed within O. rufipogon. Using the combined OryzaSNP and OMAP SNP discovery pools, we were able to identify a set of well-distributed SNPs showing within-population variation (frequency >10%) for each of the four major O. sativa subpopulations, indica, aus, tropical japonica, and temperate japonica as well as for O. rufipogon.
Our decision to build an Affymetrix array consisting of 44,100 SNPs was based on the conservative assumption that not all of the SNP targets selected from the SNP discovery pools were likely to convert into reliable SNP-detection assays. We were very pleased that ~82% of SNPs were successfully converted using both the Illumina GoldenGate and the Affymetrix custom arrays. Furthermore, there was excellent inter-convertability between the two platforms.
Novel algorithms for allele calling and quality control
Current methods for automated allele calling of genotypes are almost entirely based on clustering approaches that perform poorly when a majority of the samples are inbred or deficient in heterozygotes, as is the case for all inbreeding species, including rice and several other important crop species. This is largely due to the fact that the default algorithms used by Illumina or Affymetrix were first developed to classify mammalian genotypes based on the expectation that the population under consideration was in Hardy–Weinberg equilibrium. Thus, when the heterozygote cluster is under represented, or completely absent (as is the case for inbred lines), the software cannot reliably identify cluster locations and boundaries, unless a large dataset is generated to “train” the algorithm. Problems with the default allele calling software became immediately obvious when we started to analyze the rice data.
To address this issue, we have developed a novel genotype-calling approach called “ALCHEMY” which is based on a statistical model of the process generating the data and not on clustering methods (Wright et al. 2010). This model-based genotype-calling algorithm does not depend on ad hoc or generalized clustering methods and can accept a priori specified inbreeding coefficients. This allows the method to make adjustments depending on the expected frequency of heterozygosity in a sample. Simultaneous estimation and optimization of the inbreeding coefficient on a per-sample basis allows both outbred and inbred samples to be analyzed simultaneously and improves both accuracy and call rates. Our method also provides a posteriori quality scores on a per-SNP basis so that the reliability of specific SNPs can be evaluated. It is capable of making an inference even if only a single sample is analyzed, though the parameters of the model are refined and optimized when several samples are available for simultaneous inference. ALCHEMY has been shown to obtain >99% accuracy with as few as six samples, with larger numbers of samples continuing to improve call rates. Details regarding the theory and utility of ALCHEMY for calling SNPs using both the Illumina and the Affymetrix platforms can be found in Wright (2010). ALCHEMY is available as open source software (http://alchemy.sourceforge.net).
Phenotypic variation
O. sativa
Twenty-four agronomic and biochemical traits were evaluated on the ~400 O. sativa accessions in the rice diversity panel over the course of this project and many additional phenotypes are being evaluated by collaborators at this time. Phenotypes were evaluated on field grown plants in Stuttgart, Arkansas over 2 years (two replications, three plants per replication) as illustrated in Fig. 3. This phenotypic evaluation provided the basis for analyzing correlations among traits, for assessing the degree of phenotypic differentiation among subpopulations and for confirming that there was sufficient variation within as well as between subpopulations to enable association mapping using this diversity panel.

Flow diagram showing the sequence of phenotypic evaluation procedures used to evaluate the 400 O. sativa accessions.
Highly significant variation was observed both within and among the five subpopulations in the diversity panel for most morpho-agronomic traits, including days to heading, plant height, panicles per plant, panicle length, flag leaf length, flag leaf width, and also for grain traits, such as grain length, width, length–width ratio, and hundred grain weight (Fig. 4). For some traits, variation is controlled by a small number of genes and these are very amenable to association mapping. Other traits show complex inheritance, where a similar phenotype may result from a combination of different alleles in the different subpopulations of O. sativa or O. rufipogon. Traits showing non-additive variation or those controlled by rare alleles are also problematic for association mapping and will require a larger panel of germplasm and complementary genetic resources to permit dissection of these phenotypes.

Box plots showing trait means and variances associated with O. sativa subpopulations. Flag leaf width was measured at the widest part of the flag leaf, it exhibits a wide range of variation both within and between subpopulations, except for the aromatic (Group V) group where the range of phenotypes is much smaller, due in to small sample size (14 accessions). Subpopulation group was assigned based on 44,100 SNP markers using principal component analysis (PCA) method (see Table 1).
O. rufipogon
Twelve phenotypes related to plant morphology and domestication-related traits were evaluated on ~100 greenhouse-grown accessions in both Stuttgart, AR and Ithaca, NY using purified seed stocks of O. rufipogon/O. nivara from the rice diversity panel. These phenotypes are being analyzed at this time to identify trait-marker associations and will enable us to compare the resolution of trait dissection using O. sativa and O. rufipogon. We are also interested in evaluating haplotype diversity in O. rufipogon/O. nivara and comparing it to O. sativa to identify regions of the genome that show the footprints of selection associated with domestication and varietal differentiation. Regions associated with selective sweeps offer targets for future investigation aimed at identifying genes and alleles underlying the selection and breaking up extensive linkage blocks through recombination. Interspecific and inter-subspecific population development has already been initiated and has great potential to invigorate populations of O. sativa and release new variation for long-term selection by breeders.
CSSL development
Validation of QTLs identified by association mapping requires the development of multiple bi-parental mapping populations using parents from the association mapping panel. These populations may be complemented by access to mutant or functional genomics populations as well as more specialized resources such as libraries of introgression lines or CSSLs.
As part of this project, we are constructing six libraries of CSSLs using three diverse O. rufipogon/O. nivara donors from our diversity panel, and two O. sativa recurrent parents, one indica and one tropical japonica. The donors were selected from different branches of the phylogenetic tree based on SNP- and SSR clustering of O. rufipogon/O. nivara. One of the O. rufipogon/O. nivara donors clusters near indica, one clusters near japonica, and one is classified as independent, because it shows no clustering with any of the O. sativa subpopulations.
A library of CSSLs offers a powerful resource for dissecting quantitative variation and it also provides breeders with a tool for efficiently exploiting natural allelic variation for crop improvement. A set of CSSLs generally consists of ~50–100 lines, each carrying a single, specific introgressed segment of chromosome from a donor line in the genetic background of a recurrent parent, with the introgressed donor segment distributed evenly across all 12 chromosomes of the recurrent parent genome (Fig. 5). The rice community has developed several libraries of CSSLs and these have proven to be a powerful resource (Tian et al. 2006; Ahn et al. 2002; Ghesquiere et al. 1997; Sobrizal et al. 1996; Ali et al. 2010b). Donors can be cultivated rice varieties or may be a wild relative, and are usually selected to be genetically divergent from the recurrent parent, which is often an elite, adapted variety of interest to the breeding community. Such combinations provide novel alleles and a wide range of phenotypic variation and environmental adaptability not originally present in the elite gene pool.

Diagram showing the development of six libraries of CSSLs, with indica and japonica recurrent parents crossed with three diverse O. rufipogon donors selected from separate branches of the phylogenetic tree, different geographical regions and displaying diverse plant morphological characteristics.
A set of CSSLs can be grown in different environments by different researchers, and evaluated for multiple traits to determine whether particular genes, QTLs or chromosomal segment(s) from the donor are responsible for trait variation in the recurrent parent. Because the number of lines in a primary set of CSSLs is usually small (~96), and the size of each introgression is quite large (~6–8 Mb in size, or 24–32 cM), the resolution of CSSL mapping is roughly equivalent to that of QTL mapping, but this is accomplished with less than half the number of lines. The phenotypes observed in a CSSL population can be immediately mapped to a particular introgressed segment, and is not complicated by differences in flowering time or other aspects of plant development that are generally observed when a large number of other donor introgressions are segregating in the genetic background, as occurs with recombinant inbred lines. When using CSSLs to validate QTLs detected by association or linkage mapping, the performance of a particular introgression line is compared to the recurrent parent and to sib introgession lines, and this can be readily accomplished in as many environments or under as many treatments as appropriate. Individual introgression lines provide an excellent starting point for positional cloning and are useful immediately as parents in a breeding program. This may be of particular importance if the donor was a wild accession because a particular CSSL contains only a single introgressed segment of interest, and this exotic introgression can be easily bred into other elite cultivars using marker-assisted selection.
Interspecific populations between O. sativa × O. rufipogon have been used to identify offspring that outperform the better parent (positive transgressive segregants; McCouch et al. 2007; Tanksley and McCouch 1997). The fact that this occurs at relatively high frequency in BC2 populations, and that it is possible to identify O. rufipogon-derived QTLs associated with the favorable effect in both inbred and hybrid backgrounds has created strong interest in the use of interspecific backcross breeding in rice. Libraries of CSSLs provide a powerful and an efficient way to verify the impact of a target introgression and required only a comparison of the performance of the appropriate CSSL and its recurrent parent. When CSSL libraries do not exist, researchers generally have to go through several generations of backcrossing to develop QTL-NILs.
We have enhanced the efficiency of generating CSSLs by developing several 384-SNP assays for genotyping and selection during the backcrossing process. The SNPs used to develop the mini-assays were selected from the 44 K SNP database and additional re-sequencing data based on their distribution across the genome and their ability to detect polymorphism in the specific parental accessions used to construct the CSSLs. A tool for selecting useful subsets of SNPs for applications in genetics and breeding is also under development and will be hosted on our project website (www.ricediversity.org). This tool will make it easy for researchers to directly utilize genomic information from this and other projects to develop customized SNP assays for multiple different types of applied and basic research in rice.
Recently, researchers have begun to identify networks of interacting loci that explain the genetic architecture of non-additive variation for rice traits such as starch biosynthesis and flowering time by leveraging prior knowledge of candidate genes from other species, as well as information derived from biochemical and regulatory pathways (Maas et al. 2010; Tian et al. 2009; Uwatoko et al. 2008). This work provides a gene-based paradigm for dissecting the genetics of transgressive variation, and establishes the groundwork for the development of synthetic models to guide the creation of new crop varieties with novel attributes. CSSLs and other genetic resources provide invaluable tools for translating gene-based discoveries into breeding realities because they represent a material link between genomic information and the reproductive organism.
Future developments
With financial support from the collaborators around the world (www.ricesnp.org), we are currently re-sequencing 100–150 accessions of wild and cultivated Asian and African rice using Illumina GAII technology. Accessions are selected to represent the diversity of O. sativa, O. rufipogon/O. nivara, O.glaberrima and O. barthii and we are generating 5–55× genome coverage for each. A parallel effort is being undertaken for other wild Oryza genomes as part of the OMAP project by the Wing lab (http://www.omap.org/). These re-sequencing efforts are providing the plant breeding community with vital information about the distribution and frequencies of SNP alleles within and between populations of both wild and cultivated materials. This information will allow us to undertake evolutionary and population genetics analyses enabling the selection of the most informative SNPs for targeted applications in genetics, breeding and germplasm management.
A future endeavor involves the design and development of a high-quality 950,000-SNP array for rice. The 950 K SNP chip will feature: (a) comprehensive coverage of the rice genome, with ~1 SNP/kb across the entire genome, (b) at least one SNP in every annotated, single copy gene, (c) a balanced spectrum of polymorphisms within and between sub-populations of O. sativa, O. glaberrima and its wild relative, O. rufipogon/O. nivara and O. barthii, (d) ability to target copy number variation by including probes for invariant sites distributed throughout the rice genome, and (e) ability to target methylation sites in the rice genome as the basis for exploring the role of epigenetics in regulating trait expression.
As part of the larger Rice Diversity Research Platform, the 950 K SNP chip will be used to genotype several thousand rice accessions from the IRRI, GRIN, and NIAS germplasm banks and make the data available through public databases such as Gramene (www.gramene.org), NIAS Oryza SNP database in Japan (http://oryza-snp.dna.affrc.go.jp/en/index_en.html), and IRRI website (http://iris.irri.org). In parallel, scientists at IRRI are coordinating a broad-based phenotyping initiative and developing a rich set of mapping populations that will complement the genotyping effort described above.
The rich phenotypic and genotypic diversity data generated from this initiative will greatly expand our understanding of natural variation in crop plants and will open the door to more efficient utilization of the enormous wealth of diversity available in rice germplasm repositories around the world. This combination of genetic, genomic, and phenotypic information and resources will be immediately useful to the plant breeding community and will significantly increase the depth, breadth, and rigor of genetic analyses that can be undertaken in rice. The ability to link sequence and diversity information to physiological functions, plant development and agronomic traits in rice will encourage a new generation of highly qualified and competent young scientists to the field of rice research and will simultaneously expand the foundation for comparative genomics using rice as a pivotal reference genome.
References
Ahn SN, Suh JP, Oh CS, Lee SJ, Suh HS. Development of introgression lines of weedy rice in the background of Tongil-type rice. Rice Genetics Newsletter. 2002;19:14.
Ali ML, McClung AM, Jia MH, Kimball J, McCouch SR, Eizenga GC. A “rice diversity panel” evaluated for genetic and agro-morphological diversity between sub-populations. Mol Breed. 2010a, in press.
Ali ML, Sanchez PL, Yu SB, Lorieux M, Eizenga GC. Chromosome segment substitution lines: A powerful tool for the introgression of valuable genes from wild species of rice (Oryza spp.). Rice. 2010b; this issue.
Ammiraju JSS, Luo M, Goicoechea JL, Wang W, Kudrna D, Mueller C, et al. The Oryza bacterial artificial chromosome library resource: construction and analysis of 12 deep-coverage large-insert BAC libraries that represent the 10 genome types of the genus Oryza. Genome Res. 2006;16:140–7.
Barbier P, Morishima H, Ishihama A. Phylogenetic relationships of annual and perennial wild rice: probing by direct DNA sequencing. Theor Appl Genet. 1991;81:693–702.
Brar DS, Khush GS. Alien introgression in rice. Plant Mol Biol. 1997;35:35–47.
Caicedo AL, Williamson SH, Hernandez RD, Boyko A, Fledel-Alon A, York TL, et al. Genome-wide patterns of nucleotide polymorphism in domesticated rice. PLoS Genet. 2007;3:e163.
Chao S, Zhang W, Dubcovsky J, Sorrells M. Evaluation of genetic diversity and genome-wide linkage disequilibrium among U.S. wheat (Triticum aestivum L.) germplasm representing different market classes. Crop Sci. 2007;47:1018–30.
Cho YC, Suh JP, Choi IS, Hong HC, Baek MK, Kang KH, Kim YG, Ahn SN, Choi HC, Hwang HG, Moon HP. QTLs analysis of yield and its related traits in wild rice relative Oryza rufipogon. Treat of Crop Res In Korea 4. 2003.
Clark RM, Schweikert G, Toomajian C, Ossowski S, Zeller G, Shinn P, et al. Common sequence polymorphisms shaping genetic diversity in Arabidopsis thaliana. Science. 2007;317:338–42.
Ersoz ES, Yu J, Buckler ES. Applications of linkage disequilibrium and association mapping in maize. In Molecular genetic approaches to maize improvement, Ed. 2009; 173–195.
Flint-Garcia SA, Thornsberry JM, Buckler ES 4th. Structure of linkage disequilibrium in plants. Annu Rev Plant Biol. 2003;54:357–74.
Flint-Garcia SA, Thuillet AC, Yu J, Pressoir G, Romero SM, Mitchell SE, et al. Maize association population: a high-resolution platform for quantitative trait locus dissection. Plant J. 2005;44:1054–64.
Garris AJ, McCouch SR, Kresovich S. Population structure and its effect on haplotype diversity and linkage disequilibrium surrounding the xa5 locus of rice (Oryza sativa L.). Genetics. 2003;165:759–69.
Garris AJ, Tai TH, Coburn J, Kresovich S, McCouch S. Genetic structure and diversity in Oryza sativa L. Genetics. 2005;169:1631–8.
Ghesquiere A, Sequier J, Second G, Lorieux M. First steps toward a rational use of African rice, Oryza glaberrima in rice breeding: a contig line concept. Euphytica. 1997;96:31–9.
Glaszmann JC. Isozymes and classification of Asian rice varieties. Theor Appl Genet. 1987;74:21–30.
He F, Kang D, Ren Y, Qu LJ, Zhen Y, Gu H. Genetic diversity of the natural populations of Arabidopsis thaliana in China. Heredity. 2007;99:423–31.
Kovach M, Calingacion MN, Fitzgerald M, McCouch S. The origin and evolution of fragrance in rice (Oryza sativa L.). Proc Natl Acad Sci USA. 2009;106:14444–9.
Liu L, Lee GA, Jiang L, Zhang J. The earliest rice domestication in China. Antiquity. 2007;81:313.
Londo JP, Chiang Y-C, Hung K-H, Chiang T-Y, Schaal BA. Phylogeography of Asian wild rice, Oryza rufipogon, reveals multiple independent domestications of cultivated rice, Oryza sativa. Proc Natl Acad Sci USA. 2006;103:9578–83.
Lu BR, Zheng K, Qian H, Zhuang J. Genetic differentiation of wild relatives of rice as assessed by RFLP analysis. Theor Appl Genet. 2002;106:101–6.
Maas L, McClung A, McCouch S. Dissection of a QTL reveals an adaptive, interacting gene complex associated with transgressive variation for flowering time in rice. Theor Appl Genet. 2010;120:895–908.
Marri PR, Sarla N, Reddy LV, Siddiq EA. Identification and mapping of yield and yield related QTLs from an Indian accession of Oryza rufipogon. BMC Genetics UK. 2005;6:33. doi:10.1186/1471-2156-1186-1133.
Mather KA, Caicedo AL, Polato NR, Olsen KM, McCouch S, Purugganan MD. The extent of linkage disequilibrium in rice (Oryza sativa L.). Genetics. 2007;177:2223–32.
Matsuoka Y, Vigouroux Y, Goodman MM, Sanchez GJ, Buckler E, Doebley J. A single domestication for maize shown by multilocus microsatellite genotyping. Proc Natl Acad Sci USA. 2002;99:6080–4.
McCouch S, Sweeney M, Li J, Jiang H, Thomson M, Septiningsih E, et al. Through the genetic bottleneck: O. rufipogon as a source of trait-enhancing alleles for O. sativa. Euphytica. 2007;154:317–39.
McNally KL, Bruskiewich R, Mackill D, Buell CR, Leach JE, Leung H. Sequencing multiple and diverse rice varieties. Connecting whole-genome variation with phenotypes. Plant Physiol. 2006;141:26–31.
McNally KL, Childs KL, Bohnert R, Davidson RM, Zhao K, Ulat VJ, et al. Genomewide SNP variation reveals relationships among landraces and modern varieties of rice. Proc Nat Acad Sci USA. 2009;106:12273–8.
Morishima H, Sano Y, Oka HI. Differentiation of perennial and annual types due to habitat conditions in the wild rice Oryza perennis. Plant Syst Evol. 1984;144:119–35.
Myles S, Peiffer J, Brown PJ, Ersoz ES, Zhang Z, Costich DE, et al. Association mapping: critical considerations shift from genotyping to experimental design. Plant Cell. 2009;21:2194.
Nagasaki H, Ebana K, Shibaya T, Yonemaru J and Yano M. Core single-nucleotide polymorphisms - a tool for genetic analysis of the Japanese rice population. Breed. Sci. (2010) In press
Nordborg M, Hu TT, Ishino Y, Jhaveri J, Toomajian C, Zheng H, et al. The pattern of polymorphism in Arabidopsis thaliana. PLoS Biol. 2005;3:e196.
Oka HI. Origin of cultivated rice. Tokyo: Elsevier/Japan Scientific Societies Press; 1988.
Olufowote JO, Xu YB, Chen XL, Park WD, Beachell HM, Dilday RH, et al. Comparative evaluation of within-cultivar variation of rice (Oryza sativa L) using microsatellite and RFLP markers. Genome. 1997;40:370–8.
Purcell S, Neale B, Todd-Brown K, Thomas L, Ferreira MAR, Bender D, et al. PLINK: a tool set for whole-genome association and population-based linkage analyses. 2007;81:559–75
Rakshit S, Rakshit A, Matsumura H, Takahashi Y, Hasegawa Y, Ito A, et al. Large-scale DNA polymorphism study of Oryza sativa and O. rufipogon reveals the origin and divergence of Asian rice. Theor Appl Genet. 2007;114:731–43.
Richards P, De Bruin-Hoekzema M, Hughes SG, Kudadjie-Freeman C, Offei S, Struik P, et al. Seed systems for African food security: linking molecular genetic analysis and cultivator knowledge in West Africa. Int J Technol Manage. 2009;45:196–214.
Saisho D, Purugganan MD. Molecular phylogeography of domesticated barley traces expansion of agriculture in the old world. Genetics. 2007;177:1765–76.
Sneller CH, Mather DE, Crepieux S. Analytical approaches and population types for finding and utilizing QTL in complex plant populations. Crop Sci. 2009;49:363–80.
Semon M, Nielsen R, Jones MP, McCouch SR. The population structure of African cultivated rice Oryza glaberrima (Steud.): evidence for elevated levels of linkage disequilibrium caused by admixture with O. sativa and ecological adaptation. Genetics. 2005;169:1639–1647.
Sobrizal K, Ikeda K, Sanchez PL, Doi K, Angeles ER, Khush GS, et al. Development of Oryza glumaepatula introgression lines in rice, O. sativa L. Rice Genetics Newsletter. 1996;16:107.
Song W-Y, Wang G-L, Chen L-L, Kim H-S, Pi L-Y, Holsten T, et al. A receptor kinase-like protein encoded by the rice disease resistance gene, Xa21. Science. 1995;270:1804–6.
Sweeney M, Thomson M, Cho Y-G, Park Y-J, Williamson S, Bustamante C, et al. Global dissemination of a single mutation conferring white pericarp in rice. PLoS Genet. 2007;3(8):e133. doi:10.1371/journal.pgen.0030133.
Takano-Kai N, Jiang H, Kubo T, Sweeney M, Matsumoto T, Kanamori H, et al. Evolutionary history of GS3, a gene conferring grain length in rice. Genetics. 2009;182:1323–34.
Tanksley SD, McCouch SR. Seed banks and molecular maps: unlocking genetic potential from the wild. Science. 1997;277:1063–6.
Tian F, Li D, Fu Q, Zhu Z, Fu Y, Wang X, et al. Construction of introgression lines carrying wild rice (Oryza rufipogon Griff.) segments in cultivated rice (Oryza sativa L.) background and characterization of introgressed segments associated with yield-related traits. Theor Appl Genet. 2006;112:570–80.
Tian Z, Qian Q, Liu Q, Yan M, Liu X, Yan C, et al. Allelic diversities in rice starch biosynthesis lead to a diverse array of rice eating and cooking qualities. Proc Natl Acad Sci USA. 2009;106:21760–5.
Uwatoko N, Onishi A, Ikeda Y, Kontani M, Sasaki A, Matsubara K, et al. Epistasis among the three major flowering time genes in rice: coordinate changes of photoperiod sensitivity, basic vegetative growth and optimum photoperiod. Euphytica. 2008;163:167–75.
Vaughan DA, Lu B-R, Tomooka N. The evolving story of rice evolution. Plant Sci. 2008;174:394–408.
Wang MX, Zhang HL, Zhang DL, Qi YW, Fan ZL, Li DY, et al. Genetic structure of Oryza rufipogon Griff. in China. Heredity. 2008;101:527–35.
Wright M, Tung C-W, Zhao K, Reynolds A, McCouch SR, Bustamante CD. ALCHEMY: a reliable method for automated SNP genotype calling for small batch sizes and highly homozygous populations. Bioinformatics 2010, doi:10.1093/bioinformatics/btq533.
Xie X, Jin F, Song M-H, Suh J-P, Hwang H-G, Kim Y-G, et al. Fine mapping of a yield-enhancing QTL cluster associated with transgressive variation in an Oryza sativa × O. rufipogon cross. Theor Appl Genet. 2008;116:613–22.
Yamamoto T, Yonemaru J-I, Nagasaki H, Ebana K, Nakajima M, Shibaya T, et al. Fine definition of the pedigree haplotypes of closely related rice cultivars by means of genome-wide discovery of single-nucleotide polymorphisms. BMC Genomics. 2010;11:267.
Yan W, Rutger JN, Bryant R, Bockelman HE, Fjellstrom R, Chen M-H, et al. Development and evaluation of a core subset of the USDA rice germplasm collection. Crop Sci. 2007;47:869–78.
Zhao K, Aranzana M, Kim S, Lister C, Shindo C, Tang C, et al. An Arabidopsis example of association mapping in structured samples. PLoS Genet. 2007;3:e4.
Zhao K, Wright M, Kimball J, Eizenga G, McClung A, Kovach M, et al. Genomic diversity and introgression in O. sativa reveal the impact of domestication and breeding on the rice genome. PLOS One 2010. PLoS ONE 5(5): e107780. doi:10.1371/journal.pne.0010780.
Zhu Q, Ge S. Phylogenetic relationships among A-genome species of the genus Oryza revealed by intron sequences of four nuclear genes. New Phytol. 2005;167:249–65.
Zhu Q, Zheng X, Luo J, Gaut BS, Ge S. Multilocus analysis of nucleotide variation of Oryza sativa and its wild relatives: severe bottleneck during domestication of rice. Mol Biol Evol. 2007;24:875–88.
Zhu C, Gore M, Buckler ES, Yu J. Status and prospects of association mapping in plants. The Plant Genome. 2008;1:5–20.
Acknowledgment
We thank Teresa Hancock and Heather Maupin for their valuable assistance in phenotyping of the rice diversity panel, Daniel Wood, Fumio “Gen” Onishi and Kazi Akther for crossing and genotyping during CSSL development, and Dr. Rolfe Bryant (USDA-ARS Stuttgart, AR) for help with chemical analyses. This project is funded by the National Science Foundation Award 0606461 (to SMc; GE; AM; CB), the Crop Functional Genomics Center of the 21st Century Frontier Research Program (Project no. CG3113), Republic of Korea (to S-N. Ahn), and USAID Linkage Program and the Government of Japan (to IRRI).
Author information
Authors and Affiliations
Corresponding author
Rights and permissions
Open Access This article is distributed under the terms of the Creative Commons Attribution 2.0 International License ( https://creativecommons.org/licenses/by/2.0 ), which permits unrestricted use, distribution, and reproduction in any medium, provided the original work is properly cited.
About this article
Cite this article
Tung, CW., Zhao, K., Wright, M.H. et al. Development of a Research Platform for Dissecting Phenotype–Genotype Associations in Rice (Oryza spp.). Rice 3, 205–217 (2010). https://doi.org/10.1007/s12284-010-9056-5
Received:
Accepted:
Published:
Issue Date:
DOI: https://doi.org/10.1007/s12284-010-9056-5