
Abstract
Safety standards for domestic trampolines are based on static-load testing using a factor of five times the maximum intended user mass. This paper presents a dynamic test method for trampolines, and provides measures of the users’ performance (e.g., peak acceleration, Accmax) and injury risk (e.g., mean rate of change of acceleration, Jerkmean). Uniform masses (41–116 kg) were dropped from 0.66 m onto the bed centre of nineteen different trampolines. Trampoline bed and spring stretches, mass flight time (FlightT) and accelerations were recorded using motion capture and accelerometers. Thirty-seven percent of trampolines exceeded the static safety standard bed deformation limits (80% of frame height) by 11 ± 6% with dynamic testing (mean ± standard deviation). Across all trampolines and masses dropped, the Accmax ranged from 5.1 to 7.6 g, suggesting the factor of five used in static-loading safety standards needs reviewing. Statistically significant negative correlations (p < 0.05) were found between trampoline bed diameter and Accmax (r = – 0.88), Jerkmean (r = – 0.77) and FlightT (r = – 0.82). Furthermore, significant correlations (p < 0.05) were also found between the mass dropped and Accmax (r = – 0.27), Jerkmean (r = – 0.59) and FlightT (r = 0.25). The combined effects of the spring constants, number of springs, bed diameters and masses dropped were described in predictive multivariate equations for Accmax (explained variance, R2 = 95%) and maximum vertical bed deformation (R2 = 85%). These findings from dynamic testing may assist manufacturers in designing trampolines that meet safety standards while maximising user performance and reducing injury risk.
Avoid common mistakes on your manuscript.
1 Introduction
Domestic trampolines are fun, interactive equipment that have increased in popularity with children over the last decade, with a substantial increase in sales from 2005 [1]. Beyond fun, trampoline use has secondary benefits including the promotion of weight loss, improvement of cardiovascular health, and the action of cyclic acceleration facilitates lymphatic drainage [2, 3]. Despite the constant change in motion while trampolining, research has shown that accelerations recorded at the ankle, pelvis and head remain relatively consistent [4]. Evidently, the human–equipment interaction is complex, but little is known on how trampoline design could influence accelerations.
Injuries have been related to trampoline use, most commonly sprains and strains of lower extremity ligaments and fractures of the upper extremities [5,6,7,8]. Most of these injuries are from improper trampoline use, such as multiple users on a trampoline [5, 7, 9,10,11,12,13]. For example, younger children, when bouncing on a trampoline with a heavier individual, are prone to torus and transverse tibial fractures from the increased force exerted upwards on the lighter user as they make contact with the bed recoiling from the heavier user [11]. Such examples reinforce manufacturers’ recommendations of sole users. While some medical associations propose bans on domestic trampolines [5, 6, 9, 10] other options, including education [7] and appropriate marketing using scientific knowledge of trampoline function, would be valuable to maintain the benefits of trampolining. This is particularly important given the obesity epidemic and recommendations for children to be active [8].
Few epidemiological studies segregate proper from improper use, so the relative risk of trampolining compared to other sports and exercise is unknown. As with all exercise, there are acute risks, although these could be outweighed by long-term benefits. Logic suggests that acute injuries from appropriate use would likely occur from high repetitive impact force, landing positions, and kinetics both absorbed and generated. There is some research on trampolining that may inform this risk; however, literature from jumping and running have historically provided insight into impacts and injury links [14]. In one of the few prospective studies in running, rate of change of acceleration (i.e., jerk) was found to be a higher contributor to injury rate than peak force [12]. While peak accelerations have been linked to higher osteogenic effects, prospectively greater jerk has been shown to be related to a higher risk of injury in running [22, 23]. Higher magnitudes of force and jerk have also been related to higher injury risk in drop jumps [15]. Accelerations in trampolining have been found to be higher than in running [4], while jerk has not been investigated.
Global safety standards, including American [16], European [17] and Australian [18], provide guidelines for aspects of trampoline design and manufacture. For example, the centre of the trampoline bed is statically loaded vertically downwards using a hydraulic press, with a factor of five times the trampoline’s maximum intended user mass for a period of ten minutes. During this time, the bed must not vertically deflect downwards by more than 80% of the frame height while also maintaining a 0.1 m clearance with the floor. The factor of five [16,17,18] applied in static testing is stated to account for the dynamic weight of the user and their rebound capacity based on the European standards for gymnastic equipment [19, 20].
Dynamic testing with athletes has investigated the influence of trampoline specification on bounce characteristics [13, 21]. Within these studies, flight time, bounce height, and peak and mean accelerations have been identified from skin mounted accelerometers [22]. Evidence showed that flight times, peak and mean accelerations, and bed contact time, increased with trampoline bed diameter [13]. Longer flight times and higher peak accelerations have been linked to positive emotional responses when comparing domestic trampolines with different spring specifications [21]. There is limited knowledge on how specific changes in spring specification influence these bounce characteristics. Furthermore, there is limited detail available as to how trampoline components influence trampoline function (e.g., bed and spring stretch) or associated performance variables (e.g., flight time, acceleration and jerk).
There have been attempts to predict trampoline behaviour [25, 26]. Principally, these provide models to predict trampoline force, and incorporate assumptions and simplifications to achieve this objective. These models have been tested under either light static loads (e.g., 50 kg), or dynamically using a non-uniform mass (one person), which limit the application of these findings. Equations that predict acceleration, bed deformation, and force may be advantageous for trampoline design. In particular, equations developed over a range of dynamic loading scenarios would better cater for application to product design. Problematically, dynamic testing of trampoline performance using participants would show variation from individual differences in tissue responses and technique. Therefore, dynamic testing with uniform masses would provide results that are more consistent.
The aims of this research were to: (1) develop a methodology to dynamically test trampoline function, (2) describe the effects of design on function, and (3) produce equations to predict trampoline function based on design features.
2 Methods
2.1 Experimental procedure
Nineteen circular domestic trampolines, spanning a range of sizes, spring characteristics and frame specifications (Supplementary material Table 1) from one trampoline manufacturer were selected. The trampolines covered five designs, labelled here as A to E. The trampoline designs were certified to European standard static safety testing [17] and had a woven polypropylene bed typical of domestic trampolines. The spring constants for the range of springs were obtained from tensile testing machine (LT4-20,000, force capacity 20,000 N, length range 900 mm, Institute of Spring Technology, Sheffield) (Supplementary material Table 2). A sample of ten springs from a batch were individually loaded until they deformed plastically, i.e., when the spring reached its limit of stretch and did not return to its original length. The knee of the tensile load–length curve, where the gradient of the curve changes, was identified using a piecewise based regression method [27]. This location was determined to be the elastic limit of each spring.
Three meter wide horizontal trussing fitted to adjustable vertical stands were used to create bespoke rigging. Using a magnet release system, four masses were each dropped three times onto the centre of the bed of 2.44 m (8 ft), 3.05 m (10 ft), 3.66 m (12 ft) and 4.27 m (14 ft) trampolines. The drop height of 0.66 m, as measured vertically from the bottom of the mass to the trampoline bed, has been reported as the mean maximum bounce height from children on similar trampolines [28]. The masses were Atlas stones encased in bespoke steel frames to provide masses of 41, 65, 91 and 116 kg (265–751 J). The maximum mass dropped on each trampoline did not exceed the manufacturer’s stated maximum user mass by more than 25 kg.
2.2 Data collection
Using bespoke 3D printed housing units, six accelerometers (Trigno sensors, Deslys Inc., Boston, MA) were secured to the Atlas stone frames at the top and bottom, and at the four quadrilaterals of the horizontal plane through the frame. Retro-reflective markers were placed on the top of each accelerometer housing unit, and a further six markers were placed in opposing pairs on the top–bottom, left/lower-right/upper, and anterior/lower-posterior/upper locations of the Atlas stone.
To provide eight spring and bed combinations, 24 retro-reflective markers were placed at eight equally spaced intervals to form inner, middle and outer circles on the trampoline (Fig. 1). At each interval, markers were placed at the outside (outer circle) and inside (middle circle) of the spring hooks, and midway between the edge and centre of the bed (inner circle). The intervals aligned with the springs closest to the bed weave; hence two intervals lay along the weft bed threads, two intervals along the warp (threads perpendicular to weft threads) and four intervals at 45º angles to the weft and warp.

Experimental setup: left, positions of 24 retro-reflective markers (dots) on the bed and ends of 8 springs, and; right, drop height of masses and frame height
The accelerometer data were captured using Delsys v4.7 software, and the motion of the markers were recorded using a ten Raptor-camera motion capture system and Cortex v7.2 software (Motion Analysis Corporation, Santa Rosa, CA). Data were sampled at 148.1 Hz. The motion capture system was calibrated to < 0.3 mm. The accelerometers were calibrated to a 2.1% root mean square deviation using an optimisation process [22]. Data for the first bounce were analysed.
2.3 Data analysis
A custom MATLAB script (R2019a, Mathworks, Natick, MA) was used for analyses. Kinematic data were smoothed using a second order, low-pass, Butterworth filter with a cut off frequency of 10 Hz, as determined using residual analysis [29].
Trampoline performance was assessed using peak acceleration (AccMax) and mass flight time (FlightT) determined from the acceleration of the mass (Fig. 2). The accelerometers indicated 0 g during flight hence, FlightT was calculated from the start to end (i.e., contact) periods of constant 0 g. AccMax was identified as the local maxima of the mean of the resultant acceleration from the six accelerometers on the Atlas stone frames. To account for rotation of the masses, the mean of opposite pairs of accelerometers provided an acceleration of the centre of the mass. Where data were missing from an accelerometer, then data for both that accelerometer and its opposite pair were omitted. The mean rate of change in acceleration (JerkMean) was calculated as the difference in acceleration at contact and AccMax divided by the corresponding time interval from contact to AccMax.

Example resultant acceleration-time series for a 91 kg mass dropped from 0.66 m onto a 2.44 m (8 ft) diameter trampoline. The series shows the acceleration of the mass while held at the beginning and then three bounces. The symbols indicate mass release (cross), onset of contact between mass and trampoline bed (diamonds), peak acceleration during each contact phase (stars) and end of mass-bed contact phase (circles). Variables calculated were JerkMean (gradient between the first diamond and first star illustrated by dashed line), AccMax (first star) and FlightT (time elapsed between first circle to second diamond)
Trampoline function was assessed through component mechanisms, including maximum vertical bed deformation as a percentage of the trampoline frame height (BedMax%), along with spring and bed stretch measures. Specifically, for each trial the peak values across all eight springs and respective bed sections, occurring at the bottom of the first bounce of the mass-bed contact phases, were determined. This provided maximum resultant spring stretch (SpringStretch) and maximum bed stretch (BedStretch) for each drop. As the stretch is affected by weave direction, the median stretch of the four sections in line with the weave (SpringWeave; BedWeave), and the four sections at a 45º angle to the weave (SpringOffWeave; BedOffWeave) were first calculated. The mean of these two median values was calculated for SpringStretch and BedStretch for each mass dropped on each trampoline. BedMax% was calculated as the ratio of the minimum vertical position of the marker at the bottom of the mass, to the bed height at rest (determined as the mean of the eight inner circle markers before the mass was released). A linear regression, using the four masses for each trampoline and corresponding four BedMax%, was used to determine the mass equating to a vertical displacement of the bed of 80% of the bed-frame height.
2.4 Statistical analysis
Using the Solver function in Excel (2010, Microsoft, Redmond, WA), predictive equations were calculated for peak acceleration (Predicted AccMax) and maximum vertical bed deformation (Predicted BedMax%) based on trampoline component specifications. Specifically, these component specifications were: spring constant in N.mm−1, k; number of springs, N; mass dropped in kg, M; trampoline diameter in ft, D. To obey dimensionality theory, whereby the left and right sides of the predictive equation have the same or proportional units, the Solver function was in the form of
where a, b, c and d are constants, and SEE is standard error of the estimate. Solver was used to calculate a Least Products Regression to minimise both the error in y (e.g., Predicted AccMax) and x (e.g., AccMax) variables, hence minimising the error of ((y-x)2)/(SDx/SDy), where SD is standard deviation. One Solver constraint was set that SDx = SDy, such that y = fn(x) and x = fn(y) equations would be the same. Further constraints were that the separate independent variables should be significantly correlated with the dependent variable, and independent variables should not significantly correlate with each other (i.e., no multi-collinearity) assessed using Pearson’s correlations. The statistical significance level was set to 0.05. Predicted BedMax% was initially calculated in the same Solver approach using the equation:
This equation obeyed dimensionality; however, there were violations of the constraints of significant correlations between independent variables. Therefore, the equation was adjusted to be
Inferential statistical analyses were calculated using SPSS (v26.0, IBM, Armonk, NY). Normally distributed data were confirmed (Shapiro–Wilks > 0.05). Descriptive results are displayed as means ± standard deviations. Pearson’s correlations were calculated to determine the relationship between trampoline size and three variables: FlightT, AccMax, and JerkMean. Strength of correlations were determined as high (> 0.7), moderate (> 0.5–0.7), low (> 0.3–0.5) and negligible (0–0.3) [30].
3 Results
3.1 Trampoline behaviour
Twelve out of the nineteen trampolines had a maximum bed deformation of less than 80% of frame height when the stated manufacturer’s maximum user mass was dropped (Fig. 3). The predictive equation showed that for these 12 trampolines there was potential to increase the maximum user mass by 35 ± 26%, or reduce frame height, and still remain within 80% of the frame height. For the other seven trampolines, the 80% bed deformation limit was exceeded by 11 ± 6% maximum user mass.
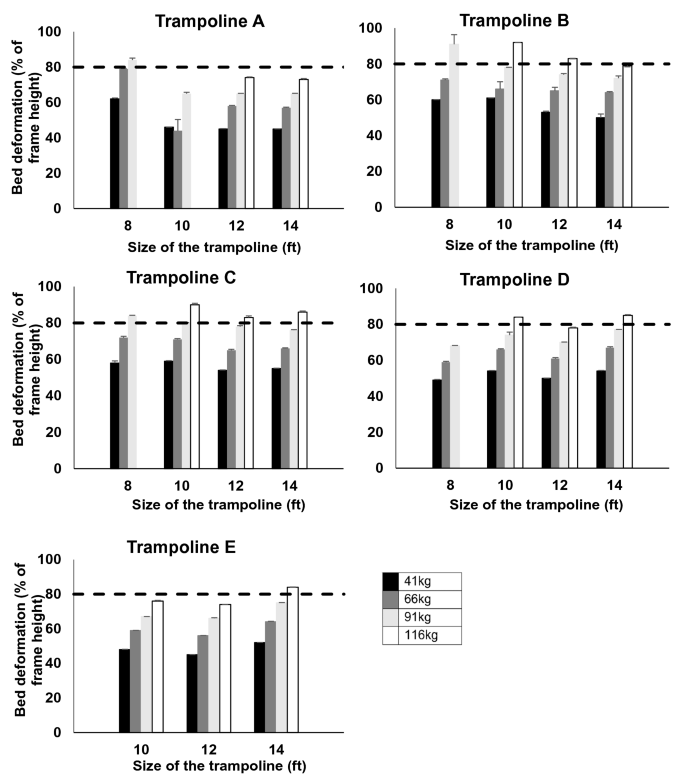
Trampoline bed deformation as a percentage of frame height for trampolines of 2.44 m (8 ft), 3.05 m (10 ft), 3.66 m (12 ft) and 4.27 m (14 ft) diameters for each mass dropped during dynamic testing. Static safety standard of 80% represented by dashed line. Bars are means and whiskers are standard deviations
The largest SpringStretch on all trampolines was 112 mm (62% strain) on a 4.27 m (14 ft) trampoline with seventy-two 180 mm long springs. This equated to 72% of the springs’ elastic limit and 47% of the springs’ ultimate tensile strength (Supplementary material Fig. 1). The smallest SpringStretch of all trampolines was 10 mm (4% strain) on a 4.27 m (14 ft) trampoline with eighty-eight, 220 mm long springs. This equated to 54% of the springs’ elastic limit and 36% of the springs’ ultimate tensile strength.
Across all trampolines and masses, SpringWeave stretch (77 ± 26 mm, or 47 ± 16% strain) was about three times greater than for SpringOffWeave (27 ± 10 mm, or 4 ± 2% strain) (Fig. 4). The opposite was true for the bed, which stretched about 10% more along BedOffWeave (163 ± 35 mm) than along BedWeave (154 ± 35 mm). The BedWeave stretch across the trampolines tested was a mean of 2.6 ± 1.3 times SpringWeave stretch and BedOffWeave stretch was about 6.9 ± 3.6 times SpringOffWeave.

SpringStretch for each mass dropped using the full Trampoline A size range as an example for diameters of: a 2.44 m (8 ft); b 3.05 m (10 ft); c 3.66 m (12 ft), and; d 4.27 m (14 ft). Odd numbered springs are in line with the weave (SpringWeave), while even numbered springs are at a 45º angle to the weave (SpringOffWeave). Bars are means and whiskers are standard deviations
3.2 Trampoline function
AccMax across all trampolines and masses dropped was 6.3 ± 0.8 g, and ranged from 5.1 to 7.6 g (Fig. 5a). AccMax had a high negative correlation with trampoline size (r = -0.88; p < 0.05) and a negligible negative correlation with mass dropped (r = – 0.27; p < 0.05). Regardless of the number and type of springs, peak acceleration decreased as mass dropped and trampoline sized increased (Fig. 5a). JerkMean across all trampolines and masses dropped ranged from 19.5 to 55.2 g·s−1, with higher values associated with larger trampolines and heavier masses (Fig. 5b). JerkMean had a high negative correlation with trampoline size (r = – 0.77; p < 0.05) and a moderate negative correlation with mass dropped (r = – 0.59; p < 0.05). FlightT (Fig. 5c) was longer with larger trampolines and heavier masses, and had a high negative correlation with trampoline size (r = – 0.82; p < 0.05) and a negligible positive correlation with mass dropped (r = 0.25; p < 0.05).

Box plots for a peak acceleration, b mean jerk and c flight time for four mass sizes dropped on four trampolines of diameters of 2.44 m (8 ft), 3.05 m (10 ft), 3.66 m (12 ft) and 4.27 m (14 ft).
3.3 Predictive equations
The combined effect of the variables within the ranges used in this study resulted in a Predicted AccMax equation with a SEE of 0.18 g, which equated to 2.8% of the mean Predicted AccMax, and an explained variance of 95%:
The combined effect of variables resulted in a Predicted BedMax equation with a SEE of 42.5 mm, equating to 8.1% of the mean Predicted BedMax, and an explained variance of 85%:
4 Discussion
In dynamic testing, 7 out of the 19 (37%) trampolines tested, all of which had passed EU safety standard testing, exceeded the 80% bed deformation limit. For all trampolines and all masses dropped, the peak accelerations exceeded 5 g. This suggests that the multiplication factor of five times the maximum intended user mass used in static safety testing [16, 17] may not reflect the force exerted on the trampoline during trampolining. For the dynamic BedMax% of these trampolines to fit within the limit specified in static safety standard, our regression equation shows that the maximum user mass would need to be reduced by 11 ± 6% of the current maximum. However, this may not be appropriate given the increasing size of children with age, as well as increasing global obesity rates [31]. Instead, the design of the trampoline could be changed, which on a basic level would require increasing the frame size (height and thickness of tubing to still conform to other aspects of the safety standard), or through a change in spring specification. Conversely, 12 of the trampolines were within the current safety limit, whereby the stated user mass could be increased by 35 ± 26% maximum user mass. Assuming the static standards testing limits are still met, the potential reduction of the frame height on some trampolines could be explored thus saving on production and shipping costs. As such, this dynamic testing could inform future trampoline design.
The maximum resultant SpringStretch across all of the trampolines tested was 112 mm (62% strain) for the 180 mm long springs on the 3.66 m (12 ft) trampoline when the heaviest mass was dropped. The minimum SpringStretch occurred on the trampoline that had the longest and most springs, and with the lightest mass dropped. There were no trampolines with the same number of springs with different lengths, or a different number of springs with the same length, so analysing the spring properties independently was difficult. The predictive equations would allow the analyses of these properties separately to optimise the number and length of springs.
The stretch of the springs and bed were affected by the direction of the weave of the bed. It was found that the springs in line with the weave (SpringWeave stretch of 77 ± 26 mm, and 47% ± 16% strain) stretched the most at up to three times more than the stretch of the springs diagonal to the weave (SpringOffWeave stretch of 27 ± 10 mm, 4% ± 2% strain), which may have implications for trampoline bed design. The BedWeave stretch had a mean of 2.6 ± 1.3 times SpringWeave stretch and BedOffWeave had a mean stretch of 6.9 ± 3.6 times SpringOffWeave. The bed elastic component was not modelled as the material was the same for all trampolines tested and is the same material used by many manufacturers. However, the results demonstrate that the bed also stretches with the springs, and future work should seek to incorporate bed properties into trampoline assessments.
Overall, our results demonstrate that as trampoline size decreases, AccMax, JerkMean and FlightT increase. Across trampoline sizes, the range in the FlightT from the lightest to heaviest mass was narrower in the smaller trampolines and wider in the larger trampolines. Domestic trampolines are commonly produced in sizes of 2.44 m (8 ft), 3.05 m (10 ft), 3.66 m (12 ft) and 4.27 m (14 ft). Across trampoline promotional media, it is typical to market smaller trampolines for younger users. Literature has shown that in adults, accelerations repeatedly exceeding 4 g provide an osteogenic stimulus [24]. Bouncing on trampolines, as a cyclic activity, therefore, facilitates positive bone adaptations. However, problematically, an increase in jerk has been linked to increased risk of injuries in running [24]. Therefore, smaller trampolines, which often have fewer, smaller and stiffer springs could be subjecting users to a higher risk of injury from increased jerk. The increased force and jerk experienced on smaller trampolines could mean that these are actually less suitable for younger users who tend to have less developed musculoskeletal systems [32, 33]. Designs to target different stages of maturation warrants further consideration.
In addition to trampoline size and mass dropped, the predictive equations within this research allow further design specifications to be evaluated. The combination of trampoline size, user mass, spring constant and number of springs could be adjusted to achieve a targeted acceleration value (Predicted AccMax) that optimises strengthening of the user’s musculoskeletal system while minimising injury risk. The trampoline specification can also be altered to achieve a targeted bed deformation (Predicted BedMax) that helps to ensure that the product will be within safety testing limits. Altering the number of springs has been used to control the stiffness of a trampoline, with the thought that more springs creates a stiffer trampoline [34]. Kersting et al. [34] found no differences with altering spring number; however, this was with just changing four springs (36 to 40 springs). Other studies have found that the spring specification affects the trampoline performance and user accelerations; however, the specific spring specifications were not disclosed [35]. The five trampoline designs in our study show clear changes with trampoline output by modifying design factors beyond springs alone, therefore, providing useful data for modelling conceptual designs. The equations presented here enable trampolines to be designed for a safer bounce (BedMax%). Combined with the findings in this paper, these equations may also facilitate the creation of designs to reduce injury risk. For instance, manufacturers could increase the spring number on smaller trampolines to decrease jerk, which could make them more suitable for younger users. Conversely reducing the spring number on the larger trampolines could increase peak acceleration to enhance performance and jump height in the likely more controlled older user.
The developed equations are limited, combining the variables to account for interaction effects. The equations are also constrained to the range of features of the trampolines tested here, mostly spring constants of 8.09, 4.13 and 2.75 N.mm−1, spring numbers of 42–90, bed diameters of 2.44–4.27 m (8–14 ft), and masses dropped of 41–116 kg. While spring constant is affected by spring properties, the equations do not take into account properties such as length and wire diameter. The equations do not consider the elastic properties of the trampoline bed and the influence of bed diameter or shape. The elastic limit of the springs was calculated from a quasi-static load rate in a tensile machine that may not be reflective of the performance of springs during a faster stretch rate during trampolining. The dynamic testing using rigid body uniform masses may affect the performance on the trampoline differently when compared to the soft tissue structures of human users. Furthermore, data were only captured for masses dropped on to the centre of the trampoline bed, and off-centre impacts were not considered. Consequently, these limitations emphasise further research is warranted, including investigating the interaction between the trampoline and user.
5 Conclusion
This study introduces a method for dynamically testing trampolines. Static testing in safety standards is based on a loading factor of five times the maximum intended user mass, which may be too low as during dynamic testing peak accelerations were found to range from 5.1 to 7.6 g. Spring stretch was found to be affected by placement in relation to the trampoline bed weave. Equations were developed to predict dynamic trampoline function based on design specifications. Good predictions were found for trampoline performance as described by peak accelerations, and trampoline function as described by maximum vertical bed deformation. The dynamic test method allows new trampoline designs’ function and safety to be tested under dynamic use. The predictive equations could assist manufacturers in designing trampolines for a targeted age group while also informing the trampoline industry.
Availability of data and material
Due to commercial sensitivity data cannot be made available.
References
The Royal Society for the Prevention of Accidents (2015) Garden trampolining. RoSPA. http://www.rospa.com/rospaweb/docs/advice-services/leisure-safety/garden-trampolining.pdf. Accessed 2 September 2020
Edin J, Goodwin S, Gerberich SC, Leon AS, McNally C, Serfass R, Shaw G, Moy J, Casal D (1990) Analysis of the training effects of minitrampoline rebounding on physical fitness, body composition and blood lipids. J Cardiopulm Rehabil 10:401–408. https://doi.org/10.1097/00008483-199011000-00002
Eager D, Scarrott C, Nixon J, Alexander K (2012) Survey of injury sources for a trampoline with equipment hazards designed out. J Paediatr Child Health 48:577–581. https://doi.org/10.1111/j.1440-1754.2012.02426.x
Bhattacharya A, McCutcheon E, Shvartz E, Greenleaf J (1980) Body acceleration distribution and O2 uptake in humans during running and jumping. J Appl Physiol Respir Environ Exerc Physiol 49:881–887. https://doi.org/10.1152/jappl.1980.49.5.881
Furnival RA, Street KA, Schunk JE (1999) Too many pediatric trampoline injuries. Pediatrics 103(5):e57. https://doi.org/10.1542/peds.103.5.e57
Hammer A, Schwartzbach AL, Paulev PE (1981) Trampoline training injuries-one hundred and ninety-five cases. Brit J Sports Med 15:151–158. https://doi.org/10.1136/bjsm.15.3.151
Ashby K, Eager D, D’Elia A, Day L (2015) Influence of voluntary standards and design modifications on trampoline injury in Victoria, Australia. Inj Prev 21:314–319. https://doi.org/10.1136/injuryprev-2015-041598
Walker K, Caine-Bish N, Wait S (2009) ‘I like to jump on my trampoline’: an analysis of drawings from 8 to 12 year-old children beginning a weight-management program. Qual Health Res 19:907–917. https://doi.org/10.1177/1049732309338404
Tileston K, Raney E (2019) Trampolines can cause serious injuries; use should be discouraged. American Academy of Pediatrics News. https://www.aappublications.org/news/2019/09/10/focus091019. Accessed 16 October 2019
Woodward G, Furnival R, Schunk JE (1992) Trampolines revisited: a review of 114 pediatric recreational trampoline injuries. Pediatrics 89:849–854 https://pediatrics.aappublications.org/content/89/5/849/tab-article-info
Boyer RS, Jaffe RB, Nixon GW, Condon VR (1986) Trampoline fracture of the proximal tibia in children. Am J Roentgenol 146:83–85. https://doi.org/10.2214/ajr.146.1.83
Milner CE, Ferber R, Pollard CD, Hamill J, Davis IS (2006) Biomechanical factors associated with tibial stress fracture in female runners. Med Sci Sports Exerc 38:323–328. https://doi.org/10.1249/01.mss.0000183477.75808.92
Sands WA, Varmette MK, Bogdanis GC, Donti O, Murphy BV, Taylor TJ (2018) Comparison of bounce characteristics on three types of trampolines. Sci Gymnast J 11:223–237 https://www.fsp.uni-lj.si/mma/-/20190602135715/
Davis IS, Bowser BJ, Mullineaux DR (2016) Greater vertical impact loading in female runners with medically diagnosed injuries: a prospective investigation. Br J Sports Med 50:887–892. https://doi.org/10.1136/bjsports-2015-094579
Dufek JS, Bates BT (1991) Biomechanical factors associated with injury during landing in jump sports. Sport Med 12:326–337. https://doi.org/10.2165/00007256-199112050-00005
ASTM International Committee (1969) F08 on sports equipment and facilities. ASTM International, West Conshohocken
European Committee for Standardization (2018) EN 71–14:2018 safety of toys - part 14: trampolines for domestic use. European Committee for Standardization, Brussels
Australia S (2015) Trampolines for domestic use - safety aspects (AS 4989–2006). Standards Australia, Sydney
Standards B (2008) BS EN 913:2008 gymnastics equipment - general safety requirements and test methods. British Standards, London
Standards B (2008) BS EN 13219:2008 gymnastic equipment - trampolines functional and safety requirement test methods. British Standards, London
Eager D, Chapman C, Bondoc K (2012) Characterisation of trampoline bounce using acceleration. In: Advances in Applied Mechanics Research, Conference Proceedings - 7th Australasian Congress on Applied Mechanics, pp. 1–8 http://hdl.handle.net/10453/31730
Mulloy F, Brown O, Mullineaux DR (2019) Comparison of simple gravity based accelerometer calibration procedures. In: 37th International Society of Biomechanics in Sport Conference, pp. 503–506 https://commons.nmu.edu/isbs/vol37/iss1/124
Hamill J, Derrick TR, Holt KG (1995) Shock attenuation and stride frequency during running. Hum Mov Sci 14:45–60. https://doi.org/10.1016/0167-9457(95)00004-C
Jämsä T, Ahola R, Korpelainen R (2011) Measurement of osteogenic exercise - how to interpret accelerometric data? Front Physiol 2:73. https://doi.org/10.3389/fphys.2011.00073
Kraft M (2011) A simple approximation for the vertical spring force of the trampoline jumping cloth. Technical University Braunschweig 2:1–13 https://publikationsserver.tu-braunschweig.de/receive/dbbs_mods_00001214
Jaques H (2008) Determining and modelling the forces exerted by a trampoline suspension system. Masters thesis, Loughborough University
Gorman AJ, Willmott AP, Mullineaux DR (2019) The determination of break points in time series data. In: Proceedings of 37th International Society of Biomechanics in Sport Conference, pp. 613–616 https://ojs.ub.uni-konstanz.de/cpa/article/view/7113
Kajastila R, Holsti L, Hämäläinen P (2014) Empowering the exercise: a body-controlled trampoline training game. Int J Comput Sci Sport 13:6–23
Wells RP, Winter DA (1980) Assessment of signal and noise in the kinematics of normal, pathological, and sporting gaits. In: Proceedings of the Special Conference of the Canadian Society for Biomechanics, pp. 92–93
Mukaka MM (2012) Statistics corner: a guide to appropriate use of correlation coefficient in medical research. Malawi Med J 24:69–71 https://pubmed.ncbi.nlm.nih.gov/23638278/
Robertson W, Stewart-Brown S, Wilcock E, Oldfield M, Thorogood M (2011) Utility of accelerometers to measure physical activity in children attending an obesity treatment intervention. J Obes. https://doi.org/10.1155/2011/398918
Forestier-Zhang L, Bishop N (2016) Bone strength in children: understanding basic bone biomechanics. Arch Dis Child Educ Pract Ed 101:2–7. https://doi.org/10.1136/archdischild-2015-308597
Currey J, Butler G (1975) The mechanical properties of bone tissue in children. J Bone Jt Surg 57:810–814. https://doi.org/10.2106/00004623-197557060-00015
Kersting UG, Brandi AP, Rosendal AB, Hansen JFSG, Kristensen MB, Gregersen ML (2017) The potential effect of mini-trampoline stiffness on take-off behaviour of gymnasts - a methodological study. In: 35th Conference of the International Society of Biomechanics in Sport, pp. 14–18 https://commons.nmu.edu/isbs/vol35/iss1/137
Eager D, Chapman C, Bondoc K (2012) Characterisation of trampoline bounce using acceleration. In: Advances in Applied Mechanics Research, Conference Proceedings - 7th Australasian Congress on Applied Mechanics, pp. 1062–1069 http://hdl.handle.net/10453/31730
Funding
This work was funded by Innovate UK as part of a Knowledge Transfer Partnership with Plum Products Ltd. (Grant number: 11183)
Author information
Authors and Affiliations
Corresponding author
Ethics declarations
Conflicts of interest
This work was funded by Innovate UK as part of a Knowledge Transfer Partnership between the University of Lincoln and Plum Products Ltd. The principle author is the KTP Associate employed at the University.
Additional information
Publisher's Note
Springer Nature remains neutral with regard to jurisdictional claims in published maps and institutional affiliations.
Supplementary Information
Below is the link to the electronic supplementary material.
Rights and permissions
Open Access This article is licensed under a Creative Commons Attribution 4.0 International License, which permits use, sharing, adaptation, distribution and reproduction in any medium or format, as long as you give appropriate credit to the original author(s) and the source, provide a link to the Creative Commons licence, and indicate if changes were made. The images or other third party material in this article are included in the article's Creative Commons licence, unless indicated otherwise in a credit line to the material. If material is not included in the article's Creative Commons licence and your intended use is not permitted by statutory regulation or exceeds the permitted use, you will need to obtain permission directly from the copyright holder. To view a copy of this licence, visit http://creativecommons.org/licenses/by/4.0/.
About this article

Cite this article
Brown, O.H., Mullineaux, D.R. & Mulloy, F. Dynamic testing to determine and predict trampoline function. Sports Eng 24, 13 (2021). https://doi.org/10.1007/s12283-021-00348-z
Accepted:
Published:
DOI: https://doi.org/10.1007/s12283-021-00348-z