
Abstract
The Yee finite difference time domain (FDTD) algorithm is widely used in computational electromagnetics because of its simplicity, low computational costs and divergence free nature. The standard method uses a pair of staggered orthogonal cartesian meshes. However, accuracy losses result when it is used for modelling electromagnetic interactions with objects of arbitrary shape, because of the staircased representation of curved interfaces. For the solution of such problems, we generalise the approach and adopt an unstructured mesh FDTD method. This co-volume method is based upon the use of a Delaunay primal mesh and its high quality Voronoi dual. Computational efficiency is improved by employing a hybrid primal mesh, consisting of tetrahedral elements in the vicinity of curved interfaces and hexahedral elements elsewhere. Difficulties associated with ensuring the necessary quality of the generated meshes will be discussed. The power of the proposed solution approach is demonstrated by considering a range of scattering and/or transmission problems involving perfect electric conductors and isotropic lossy, anisotropic lossy and isotropic frequency dependent chiral materials.
1 Introduction
In this paper, we consider the simulation of problems in electromagnetics using unstructured co-volume staggered meshes and a generalisation of the Yee finite difference time domain (FDTD) method [1]. In its standard form, the FDTD algorithm is implemented on structured staggered spatial meshes. The use of staggered meshes enables the interleaving of the unknown nodal values of the electric and magnetic field components, resulting in an explicit algorithm that is second order accurate in both space and time. The algorithm has the additional advantages of simplicity, low computational cost and, as no linear algebra is required, there is no inherent limit to the size of the simulation. In addition, the scheme preserves the energy and amplitude of waves, is divergence free and can readily be parallelised. To retain these benefits, for simulations involving geometries of complex shape, non-uniform and unstructured mesh FDTD implementations have been suggested, such as the generalised Yee algorithm [2] and the Yee-like algorithm [3]. Unfortunately, these methods do not retain the efficiency of the original scheme [4]. An alternative approach to generalising the FDTD algorithm to unstructured meshes is to employ a primal unstructured Delaunay mesh and its orthogonal Voronoi dual graph [5]. With this method, hybrid meshes can be naturally incorporated, without requiring the inter-mesh interpolation, and consequent non-physical diffraction effects mesh interfaces, that plagues many hybrid approaches. The proposed implementation is edge and face based, which means that it is not restricted to specific mesh element types and can handle any form of polyhedron.
This paper is structured as follows: In Sect. 2, we outline the problem of interest and employ a scattered field formulation for Maxwells equation in integral form for problems involving an isotropic lossy dielectric material and/or a perfect electric conductor (PEC). Section 3 introduces the FDTD method and illustrates the discretisation of the Maxwell equations on both a structured and an unstructured mesh. Section 4 is devoted to the mesh generation process, which is one of the most crucial parts for the successful implementation of the proposed scheme. The treatment of the different kinds of boundary conditions is discussed in Sect. 5. Section 6 describes the method adopted for the calculation of the distribution of the radar cross section (RCS). In Sect. 7, we validate our algorithm by comparing the numerical and analytical solutions for the RCS distribution for problems involving, dielectric lossy and coated spheres of different electrical lengths. The calculation of the RCS distribution of a more complex PEC aircraft geometry and the simulation of transmission of an electromagnetic pulse through a radome are presented in Sect. 8. In Sects. 9–11, we move on to consider anisotropic lossy materials, where the material parameters, electric permittivity \(\varepsilon\), the magnetic permeability \(\mu\) and the electric and magnetic conductivites \(\sigma ,\sigma _m\), become second order tensors. This allows us to consider the simulation of problems involving crystals, or composite materials, where the orientation of fibres plays an important role. In Sects. 12–13, we consider a further extension that allows for the modelling of bi-isotropic materials. Materials of this type are frequency dependent and have an additional parameter, the chirality, which couples the electric to the magnetic field, making the simulation even more challenging. Brief conclusions are presented in Sect. 14.

Schematic representation of the electromagnetic scattering problem
2 Problem Formulation
We consider problems involving the simulation of the interaction of an incident electromagnetic wave, generated by a source located in the far field, and a general medium surrounded by free space. We assume, initially, that the medium might represent a dielectric or a closed region of very high electrical conductivity, as illustrated in Fig. 1. A closed region of very high electrical conductivity is generally approximated as a PEC. With this approximation, electromagnetic fields do not penetrate the conducting surface and the outer boundary of the PEC forms the inner boundary of the problem domain. For such simulations, it is convenient to split the total electric and magnetic fields into incident and scattered components, according to
with the subscripts tot, inc and scat referring to the total, incident and scattered fields respectively. To enable a numerical solution of this problem, the governing Maxwell equations are expressed in terms of the scattered field components [6] and written in the integral form provided by the Laws of Ampère and Faraday [5]. For a three dimensional lossy dielectric medium, the resulting equations become
and
Here, \(\partial A\) denotes the closed curve bounding a surface A, \(\mathrm {d}{\mathbf {A}}\) is an element of area of the surface A, directed normal to the surface, and \(\mathrm {d}{\mathbf {l}}\) is an element of contour length in the direction of the tangent to the curve \(\partial A\). In addition, \(\varepsilon\) denotes the electric permittivity of the medium, \(\mu\) its magnetic permeability, \(\sigma\) its electric conductivity and \(\sigma _m\) its magnetic conductivity.
We will often consider plane incident waves, of free space wavelength \(\lambda _0\). In this case, if \(\varepsilon _o\) and \(\mu _o\) denote the electric permittivity and magnetic permeability of free space respectively, we can write
where \(\mathbf {k}\) is the unit wave vector, \(\mathbf {r}\) is the position vector, \(\omega =2\pi /\lambda _0\) is the angular frequency and \(\eta =\sqrt{\mu _{o}/\varepsilon _{o}}\) is the impedance of free space.
3 The FDTD Method
3.1 The Standard Algorithm
The standard FDTD scheme [1, 7] is a popular solution algorithm in computational electromagnetics. In its original form, the algorithm is implemented on two mutually orthogonal staggered structured cartesian meshes in a straightforward manner.
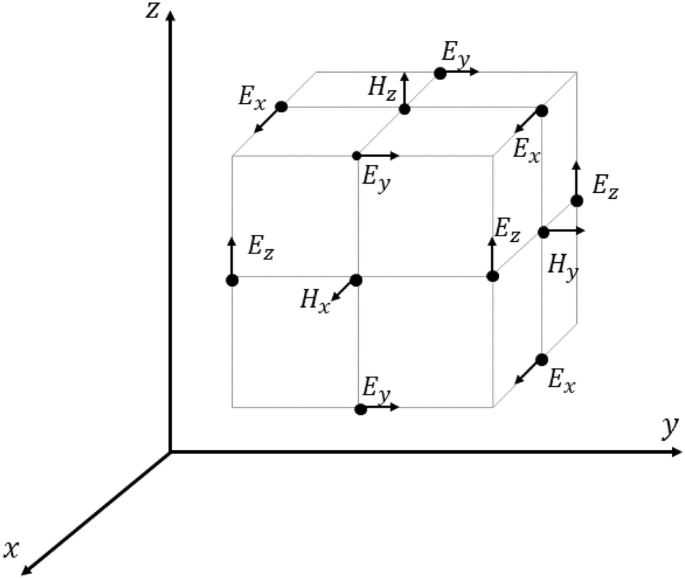
Location of the unknowns for the cartesian FDTD algorithm
For example, on a general (x, y, z) cartesian mesh, with mesh spacing \(\varDelta x\), \(\varDelta y\), \(\varDelta z\) in the three coordinate directions, the location of the unknown electric and magnetic field components is illustrated in Fig. 2. These components are advanced in time using a staggered leapfrog scheme. In the resulting algorithm, with the superscript n denoting an evaluation at time \(n\varDelta t\), where \(\varDelta t\) is the time step, and subscripts (I, J, K) denoting an evaluation at the point \((I\varDelta x, J\varDelta y, K\varDelta z)\), typical discretized forms of Eqs. (2) and (3) in the scattered field formulation [6] are
and
Similar equations can be written directly for the other field components. For a stable implementation of this explicit scheme, the magnitude of the time step employed has to be restricted and, for a uniform cartesian mesh, this stability criterion may be written as \(c\sqrt{3}\varDelta t \le l\), where \(c=(\epsilon \mu )^{-1/2}\) is the speed of wave propagation through the medium and l is the edge length in the mesh [7]. It should be noted that, since the incident fields are defined analytically in Eq. (4), the time derivatives of \(E_{inc,x}\) and \(H_{inc,x}\) can be evaluated directly for use in Eqs. (5) and (6). In this form, this explicit algorithm is second order accurate, in both space and time, on a uniform mesh. The computational implementation of this FDTD method, characterized by its low storage requirements, of around 75 Mbytes per million nodes, and its low operation count, provides a highly efficient simulation process.
3.2 Unstructured Mesh Algorithm
Although the cartesian mesh algorithm is very efficient, unstructured meshes are more suitable for use in the solution of problems involving regions of complex shape. For the implementation of a corresponding unstructured mesh FDTD procedure, a suitable pair of mutually orthogonal meshes has to be identified. An obvious choice, given the widespread availability of automatic unstructured mesh generators, is to select a primal Delaunay tetrahedral mesh together with its Voronoi dual. These meshes are mutually orthogonal, in that each Voronoi face is a perpendicular bisector of the corresponding Delaunay edge, while each Delaunay face is perpendicular to the corresponding Voronoi edge. It is assumed that the Delaunay mesh employs \(N_{e}^{D}\) and the Voronoi mesh \(N_{e}^{V}\) edges. Each Delaunay edge has an associated closed loop of Voronoi edges and each Voronoi edge is surrounded by a closed loop of Delaunay edges. The unknowns in the unstructured mesh implementation of the FDTD scheme are located at the midpoints of these edges. The unknown at the centre of the ith Delauany edge corresponds to the projection, \(E_{scat,i}\), of the scattered electric field onto the direction of the edge. The unknown at the centre of the jth Voronoi edge corresponds to the projection, \(H_{scat,j}\), of the scattered magnetic field onto the direction of the edge. Discretization of the Ampère’ and Faraday’ Laws by applying the central difference approximations
leads to the equations
and
Here \(l_{i}^{D}\) represents the length of the ith Delaunay edge and \(A_{i}^{V}\) corresponds to the area of the Voronoi face spanned by the Voronoi edges surrounding Delaunay edge i. Similarly, \(l_{j}^{V}\) represents the length of the jth Voronoi edge and \(A_{j}^{D}\) corresponds to the area of the Delaunay face spanned by the Delaunay edges surrounding Voronoi edge j. The numbers \(j_{i,k}\), \(k=1,\ldots ,M_{i}^{V}\) refer to the \(M_{i}^{V}\) edges of the Voronoi face corresponding to the ith Delaunay edge, as illustrated in Fig. 3a. Similarly, the numbers \(i_{j,k}\), \(k=1,\ldots ,M_{j}^{D}\) refer to the \(M_{j}^{D}\) edges of the Delaunay face corresponding to the jth Voronoi edge, as illustrated in Fig. 3b.

a The ith Delaunay edge, connecting Delaunay vertices \(p_{1}\) and \(p_{2}\), and the corresponding Voronoi face, formed by the Voronoi edges \(j_{i,1},\ldots ,j_{i,6}\); b the jth Voronoi edge, connecting Voronoi vertices \(e_{1}\) and \(e_{2}\), and the corresponding Delaunay face, formed by the Delaunay edges \(i_{j,1},i_{j,2},i_{i,3}\)
With these staggered equations, the magnetic field is advanced over the dual mesh at the half time step, using Eq. (14), and the electric field is advanced over the primal mesh at the full time step, using Eq. (13). It should be noted that, with the appropriate interpretation, the discrete approximations of Eqs. (13) and (14) reduce to the basic FDTD algorithm, when they are employed on a pair of staggered regular orthogonal cartesian meshes. For post-processing purposes, a local least squares problem has to be solved to determine all components of \({\mathbf {E}}\) and \({\mathbf {H}}\) at the vertices of the primal and dual meshes respectively. For a stable implementation of this explicit unstructured mesh scheme, practical experience has shown that a relationship of the form
generally results in stability, where \(S_f\) is a safety factor that depends on the mesh and is normally given a value in the range 0.8–2.0.
4 Mesh Generation
4.1 Structured Mesh
Structured meshes of hexahedra are readily generated and the meshes employed for wave propagation problems are generally constructed to consist of cubes of uniform side length, \(\delta\). For problems involving waves of characteristic wavelength, \(\lambda _0\), a value of \(\delta\) in the range \(\lambda _0 /30\)–\(\lambda _0 /10\) is typically employed for practical applications of the FDTD scheme on regular cartesian grids [7].

Illustration of the case where a Voronoi edge and the corresponding Delaunay face do not intersect
4.2 Unstructured Mesh and the Ideal Unstructured Mesh
The unstructured mesh discretisation employed in Eqs. (13) and (14) will be second order accurate provided that each Voronoi face is a perpendicular bisector of the corresponding Delaunay edge. This criterion is satisfied automatically for meshes generated by the Delaunay method, but the need to recover a given boundary triangulation may result in the loss of this property. In addition, each Delaunay face must be a perpendicular bisector of the corresponding Voronoi edge and the intersection point, between the edge and the face, must be at the centroid of the face. This criterion can only be achieved for a perfect tetrahedron, which is a tetrahedron for which all faces are equilateral triangles. In this case, the centre of the circumsphere lies inside the tetrahedron and coincides with its centroid. Failure to ensure that this criterion is satisfied means that the corresponding contour integral in Eq. (13) is approximated over a surface that does not intersect the corresponding Voronoï edge, as illustrated in Fig. 4. In this case, the accuracy of the approximation of the integral cannot be guaranteed.
It follows that certain requirements should be imposed on a Delaunay primal mesh and its Voronoi dual mesh, to ensure the successful implementation of the unstructured mesh FDTD solution method. These requirements are:
-
1.
all Voronoi and Delaunay edge lengths should be bounded from below;
-
2.
the centre of the circumsphere for each Delaunay tetrahedron should lie within the tetrahedron;
-
3.
all Delaunay and Voronoi edge lengths should be bounded from above by a value that is not significantly greater than the specified value of \(\delta\);
-
4.
any deviation in the location of the midpoint of a Voronoi edge from the actual point of intersection with the corresponding Delaunay face should be minimised;
-
5.
any deviation in the location of the circumcentre of a tetrahedron from its centroid should be minimised.
In this list of requirements, the first two entries are the most important in securing a practical, stable implementation of the unstructured FDTD algorithm. For complex three dimensional geometries, it is not always possible to satisfy exactly the last two requirements, so that these criteria have to be relaxed in practice. The third requirement guarantees a sufficiant resolution for the propagation of the electromagnetic wave.
In two dimensions, the ideal unstructured mesh is the space filling mesh of equilateral triangles [8]. The number of nodes connected to each node is 6, the Voronoi edge length \(l^V = l^D/\sqrt{3}\approx 0.56\,l^D\) and all the vertex angles are \(60^\circ\). In three dimensions, a tetrahedral mesh made of elements with faces in the form of equilateral triangles is not space filling. It has been shown [9,10,11] that an ideal space filling mesh consists of equal non-perfect tetrahedra, with each face in the form of an isosceles triangle, with one side of length \(l^D_{\mathrm{long}}\) and two shorter sides of length \(l^D_{\mathrm{short}} = \sqrt{3}/2\,l^D_{\mathrm{long}}\). Six such tetrahedra form a parallelepiped tiling the space, as illustrated in Fig. 5. This configuration can be shown to maximise the minimum Voronoi edge for a fixed element size. All Voronoi edges have the same length \(l^V \approx 0.38\,\delta\) where \(\delta \equiv \langle l^D\rangle = (3\,l^D_{\mathrm{long}} + 4\,l^D_{\mathrm{short}})/7 \approx 0.92\,l^D_{\mathrm{long}}\). The number of nodes connected to each node is 14. All vertices have an acute angle of \(71.5^\circ\) and, hence, for each element, the centre of the circumsphere is located inside the element. However, certain dihedral angles are equal to \(90^\circ\), which is larger than the value \(70.5^\circ\) for the dihedral angle of the perfect tetrahedron. The elements in this three dimensional ideal mesh satisfy the requirements set out above, but do not, of course, fit general boundaries. It can be readily demonstrated that the solenoidal preserving property of the original FDTD algorithm is also valid for the discretisation of Eqs. (13) and (14) on these ideal meshes.

Detail of a mesh of ideal tetrahedral elements, showing the surface Delaunay faces and the internal Voronoi cells
4.3 Unstructured Mesh Generation
Traditional automatic unstructured mesh generation methods, such as the advancing front technique [12] and the Delaunay triangulation [13], or their combination [14], are not designed to guarantee the creation of an unstructured mesh meeting the FDTD requirements set out above, even in the two dimensional case. These methods generate meshes in which the element edge length is acceptable, but the corresponding Voronoı diagram is often highly irregular and can include some very short Voronoı edges. This means that these methods cannot guarantee the regularity of the edge lengths of the dual mesh and the absence of bad elements. Although methods based on swapping, reconnection and smoothing [15] can be used to improve mesh quality, experience has shown that boundary constraints usually mean that their use does not result in a suitable unstructured mesh for the FDTD method, even in two dimensions [8].

Mesh optimisation: a a two dimensional element ABC, with the centre, O, of the circumcircle lying outside the element, b a two dimensional element ABC, with the dual vertex moved to the point O inside the element
An alternative approach is to generate meshes using an iterative constrained centroidal Voronoi tessellation (CVT) [16], followed by mesh quality optimisation. The iteration process adopted is Lloyd’s algorithm [17] which, given an initial mesh, relocates the nodes, to the mass centroids of the corresponding Voronoi cells, and then creates a new Voronoi tessellation of the relocated nodes. The process is repeated until all nodes are close enough to the corresponding centroids. The initial tetrahedral mesh is constructed using the vertices of the ideal mesh as the point distribution. In addition to relocating the nodes, the CVT scheme changes the mesh topology and, although the quality of final mesh is much higher than the quality of the initial mesh, typically around 10% of the elements in the final mesh may still be found to violate the mesh quality measures that are required in the current context.
4.4 Unstructured Mesh Optimisation
The unstructured mesh is optimised in an attempt to ensure that both the primal and the dual mesh are of the highest possible quality. The requirement that a dual edge must be a bisector of the corresponding Delaunay edge is relaxed. At the same time, the corresponding dual mesh vertex is moved to a point which still ensures orthogonality between the two grids and which lies inside the corresponding primal element. The procedure adopted is similar to that found in the concept of a power diagram [18], where the perpendicular bisector of an edge is moved parallel to itself by an amount that is proportional to a weight assigned to the edge nodes.
To illustrate how this optimisation process can be achieved, consider, in two dimensions, the case when the Voronoi vertex, located at the centre, O, of the circumcircle enclosing a triangular element ABC, lies outside the element. The point O is located at the intersection of the perpendicular bisectors of the three edges of the triangle. For edge AB, the perpendicular bisector is identical to the common cord of the two circles, each having the same radius as the circumcircle, centred at the points A and B, as illustrated in Fig. 6a. When the radii of these two circles are changed, the new common cord remains perpendicular to AB but loses its property of being a bisector. This is illustrated in Fig. 6b. In this case, with careful choice of the radii, the common cords of the circles centred at the nodes of each edge still intersect at a common point O. The vertices and edges of the dual mesh are modified accordingly, with the dual mesh vertex for the element being relocated to this common point. This same process can be applied to a tetrahedral element in three dimensions.
These ideas are employed as the basis of a mesh optimisation process that is used to locate the position \(\mathbf {X}_{O}\) of the dual mesh node, O, for each element, as close as possible to the element centroid. This will ensure that each element contains its dual node and guarantees the essential criterion of mesh orthogonality. For a tetrahedron element, ABCD, the dual node is located at the intersection point of the common cords of the spheres centred at the vertices of each element, with the sphere at A having a radius of \(R_A\). If the radius employed at each vertex of a tetrahedron is the same, then the dual node will coincide with the circumcentre. Suppose that \({\mathbf {X}}_O=(x^O,y^O,z^O)\) and that the vertex coordinates are \({\mathbf {X}}_E=(x^E,y^E,z^E)\) for \(E=A,B,C,D\). The optimisation is achieved, during the CVT process, by changing the radius associated with vertex A by an amount \(\delta R_A\), where the new dual node location for each tetrahedron is computed by solving the system
where the summation convention is employed for \(i=x,y,z\).
4.5 A Hybrid Mesh Approach
The unknowns in the FDTD algorithms are associated with the edges of the primal and dual meshes. It follows that, for a fixed number of points per wave length, an unstructured mesh made of ideal tetrahedral elements will over-resolve the wave, by about 30%, compared to a structured cartesian mesh. To obtain a resolution similar to that achieved with a structured cartesian mesh, the number of points per wavelength must be reduced when generating the ideal tetrahedral mesh. Unfortunately, such a reduction can result in the under-resolution of boundary geometries, particularly in regions of high curvature. This suggests that a hybrid mesh approach could result in a computationally effective compromise. This has been demonstrated for two dimensional electromagnetic scattering simulations, which have been performed accurately and efficiently using such a hybrid approach, with a mesh of triangles used near complex boundaries and a cartesian mesh used elsewhere [19]. Initial attempts at extending these ideas to three dimensions, for problems involving simple geometries, have also been reported [11, 20].
With such an approach, the resolution employed is selected to be that appropriate for the operation of the FDTD algorithm on a regular cartesian mesh. This will result in an unstructured mesh that over-resolves the solution in the free space region immediately adjacent to the scatterer. However, as it can be estimated that, typically, only around 10% of the total number of nodes will lie in the unstructured mesh region in three dimensions, following this approach will only result in a small increase in the total number of degrees of freedom, which is regarded as being acceptable given the improved boundary resolution.
4.6 Hybrid Mesh Generation
Consider the problem of discretising a general domain, using tetrahedral cells in the vicinity of the scatterer and regular cartesian hexahedral cells elsewhere. To provide a consistent hybrid mesh, these two groups of cells will be connected through a set of interface polygonal cells. The process of generating a hybrid mesh for the computational domain surrounding a general scattering obstacle is accomplished in four stages. In the first stage, an unstructured triangulation of the surface of the scatterer is produced [21] and the triangulation is then placed inside a hexahedral box. The surface of the box forms the outer surface of the computational domain. The region inside the box is discretised using a regular cartesian mesh of cubes, of a prescribed edge length \(\delta\), as illustrated in Fig. 7a. Cubes within a prescribed distance of the scatterer, or lying internal to the scatterer, are removed in a second stage, to create a staircase shaped surface that completely encloses the scatterer, as shown in Fig. 7b. In the third stage, a point distribution is specified to completely cover the unmeshed region, as in Fig. 7c, with those points from the distribution that lie either inside the scatterer or outside the staircase surface being removed, as shown in Fig. 7d. The fourth stage consists of using the points that remain to generate an unstructured tetrahedral mesh in the region between the surface triangulation of the scatterer and the staircase surface. However, this mesh generation process cannot start directly, as the exposed faces of the staircase surface are all squares. The traditional approach to handling the problem of fitting a hexahedral mesh to a tetrahedral mesh is either to place a pyramidal element on each exposed square face, leading naturally to a consistent mesh, or, at the expense of introducing a hanging edge, to divide each exposed square face into two triangles. The use of pyramids is not adopted here, because the geometrical constraints of the staircasing imply that the centre of the circumsphere of each pyramid would lie outside the pyramid, which is something that should be avoided. Instead, the hanging edge approach is employed, but is modified to produce a consistent mesh of arbitrary shaped polyhedral cells that are appropriate for use with the co-volume method. In this approach, each cube that forms part of the staircase surface is divided into six tetrahedra. For a cube with a single exposed face, a tetrahedron that contains one of the staircase surface triangles is removed from the mesh, as shown in Fig. 8a and b. A similar procedure is employed for cubes with either two or three exposed faces, producing the configurations shown in Fig. 8c and d. This process will replace the original staircase surface by a set of triangular faces that are appropriate as the starting point for the generation of the tetrahedral mesh. Each polyhedral interface cell is stored as a set of tetrahedra. The tetrahedra in each set have the same circumsphere and they are merged again during the solution process.

Illustration of the stages involved in the generation of an initial hybrid mesh: a the regular cartesian mesh covering the interior of the computational domain; b creation of the staircase surface at a prescribed distance from, and completely enclosing, the scatterer; c the introduction of the point distribution; d the final point distribution, retaining only those points lying in the region between the scatterer and the staircase surface

Treatment of the cubes forming the staircase surface to enable a consistent hybrid mesh to be generated: a typical cube; b cube with one face exposed; c cube with two exposed faces; d cube with three faces exposed
4.7 Element Merging
The primal Delaunay mesh will be degenerate if two, or more, adjacent tetrahedral elements share the same circumsphere. In this case, certain Voronoi edges will have zero length, certain Voronoi faces will have zero area and the discrete approximations of Eqs. (13) and (14) become invalid. However, the approximations will remain valid if, at the outset, each set of such adjacent degenerate tetrahedra is merged, to create a polyhedron of the appropriate shape, and the unknowns and the lists of Delaunay and Voronoï edges are modified accordingly. The primal mesh is then regarded as a hybrid of tetrahedra and polyhedra and the dual mesh is updated appropriately. To avoid creating a new data format to cater for the shapes that are created in this way, a polyhedron is stored as a set of tetrahedra, each with the same circumsphere. These tetrahedra are merged again during the solution process.
Voronoi edges having a ’small’ length may still be present in the mesh and this will have a detrimental effect on the efficiency of the explicit time stepping process. To alleviate this problem, certain ’small’ Voronoi edges are also collapsed and the corresponding primal elements are merged to form a polyhedron. For the examples that are presented here, this merging is performed for all Voronoi edges with a length that is less than \(0.01\delta\). Note that, if two merged polyhedra are adjacent, it is important to ensure that the triangles forming the common face are co-planar. Violation of this criterion implies that the original merging process should not be allowed. Here, two triangles are taken to be co-planar provided their dihedral angle in less than \(1^\circ\).
5 Treatment of Boundary Conditions
5.1 Material Interfaces
At interface boundaries, the material parameters change over the area of integration. In this case, the values of \(\varepsilon\), \(\mu\), \(\sigma\) and \(\sigma _{m}\) are replaced by appropriately averaged values \(\varepsilon _{av}\), \(\mu _{av}\), \(\sigma _{av}\) and \(\sigma _{m{av}}\). For the standard FDTD algorithm, the three most common averaging techniques, at an interface between materials with generic parameters \(a_1\) and \(a_2\), are the arithmetic mean, the harmonic mean and the geometric mean. It has been reported [22] that the convergence rates obtained with the geometric and harmonic means deteriorate as the mesh size decreases, whereas second order convergence is maintained with the arithmetic mean. For this reason, the arithmetic mean average is adopted here and modified for use with unstructured meshes, where the cell size is not necessarily uniform.
To illustrate how an arithmetic mean is employed in the construction of the material parameters, consider the situation at an interface, between material 1 and material 2, illustrated in Fig. 9. At the interface, material property a on Delaunay edge i is assigned the averaged value \(a_{avDel,i}\), computed as

Averaging of material properties at an interface. a Delaunay edges in material 1 in blue, in material 2 in green, at the interface in red; b the Voronoi edge crossing a triangle at this interface in black. (Color figure online)
In this equation, the term \(a_{cell(k)}\) denotes the material parameter assigned to cell k, surrounding Delaunay edge i. Cell k, with volume \(w_{k}\), is defined as the region spanned by the end points of Delaunay edge i, the point of intersection of the Voronoi edge with the Delaunay face and the position of the circumcentre of cell k. For example, in Fig. 9a, \(w_{1}\) would be the volume spanned in material 1 by the points P1, P5, P9, P8, and \(a_{cell(1)}=\epsilon _{1}\) or \(a_{cell(1)}=\sigma _{1}\). Similarly, \(w_{2}\) would correspond to the volume spanned in material 2 by the points P1, P5, P9, P10, so that \(a_{cell(2)}=\epsilon _{2}\) or \(a_{cell(2)}=\sigma _{2}\).
Similarly, material property b, on a Voronoi edge, j, is assigned the average value \(b_{avVor,j}\) and is computed using the weighted average formulae
In this equation, the term \(b_{cell}(\ell )\) denotes the material parameter assigned to cell \(\ell\). The length of the Voronoi edge inside cell \(\ell\) is \(g_{\ell }\) and this corresponds to the distance between the point of intersection of the Voronoi edge j with the Delaunay face and the circumcentre of the cell. For example, in Fig. 9b, the distance between the points P1 and P3 is \(g_{1}\), and the coefficient \(b_{cell(1)}=\mu _{1}\) or \(b_{cell(1)}=\sigma _{m_{1}}\).
A PEC boundary may also be simulated in this fashion, treating it as a resistive sheet. In this case, the Delaunay and Voronoi edges forming the interface are assigned a very high conductivity value in the order of \(10^6\;\)S/m.
It can be readily demonstrated that this averaging process on an unstructured mesh corresponds to the arithmetic mean on a structured mesh [23].

Representation of the surface of a 2\(\lambda _0\) PEC sphere using structured hexahedral meshes with spacing a \(\delta =\lambda _0/15\); b \(\delta =\lambda _0/60\)
5.2 Far Field Boundary
In the far field, the scattered fields should consist of outgoing waves only. This radiation condition is imposed by considering the outermost layers of the structured hexahedral mesh to be in the form of an artificial absorbing perfectly matched layer (PML) [24]. The PML region is defined to be of a constant thickness and a standard PML formulation is adopted [7, 25].

Cuts through a typical mesh employed for the analysis of scattering of a plane wave by a \(2\lambda _0\) dielectric sphere: a view of the discretised dielectric sphere; b detail of a cut through the mesh showing the different cell types of tetrahedra (white and blue), pyramids (yellow) and hexahedra (red). (Color figure online)

Comparison of the computed and analytic RCS distributions for scattering of a plane wave by a \(2\lambda _0\) PEC sphere: a the co-polarized distribution; b the cross-polarized distribution

Comparison of the computed and analytic RCS distributions for scattering of a plane wave by a \(2\lambda _0\) dielectric sphere with \(\varepsilon _{r}=2\), \(\mu _{r}=1\) and \(\sigma =\sigma _{m}=0\,\)S/m: a the co-polarized distribution; b the cross-polarized distribution
6 Calculation of the RCS
The RCS provides a measure of the power scattered from a target obstacle towards a receiver. In numerical simulation, we evaluate the bi-static RCS, which is a function of aspect angle and bi-static angle. The scattered wave is decomposed into two components. The first component has the same polarization as the transmitted signal and is referred to as co-polarized, while the second component has an orthogonal polarization state compared to the transmitted signal and is referred to as cross-polarized. For numerical simulations, the RCS distribution is of practical interest because an analytical solution is available for certain simple cases. To compute this distribution, a near to far field transformation procedure [26] is employed to obtain the required far field information from the computed near field data. To achieve this, a closed collection surface, S, completely enclosing the scatterer, is constructed and, when steady state conditions have been achieved, a further cycle is computed. During this cycle, the harmonic solution produced by the time domain solver is used to calculate the phasors, which enable fictitious electric and magnetic currents to be defined on S. Standard electromagnetic theory can then be used to determine, using the surface equivalence theorem, the components of the scattered electric field in the far field [27]. With these values, the distribution of the quantity
is computed, where \((r,\theta ,\phi )\) denotes a standard spherical polar coordinate system. For the results presented here, the collection surface, S, is taken to be the surface formed in the mesh by removing all but the first layer of tetrahedra that are attached to the scattering surface and it is the distribution of the quantity
that is displayed.

Rate of convergence of the \(L^2\) norm of the error in the computed RCS distribution of a \(2\lambda _0\) dielectric sphere with different mesh sizes for: a the co-polarized RCS; b the cross-polarized RCS

Scattering of a plane wave by a dielectric lossy sphere of electrical length \(2\lambda _0\) with \(\varepsilon _{r}=2\), \(\mu _{r}=1\) and \(\sigma =0.7\) S/m \(\sigma _{m}=0 \,\)S/m: a co-polarized RCS distribution; b cross-polarized RCS distribution
7 Basic Algorithm: Initial Validation
7.1 Scattering by a \(2\lambda _0\) PEC Sphere
The first example involves modelling the interaction between a monochromatic plane wave, of wavelength \(\lambda _0\), and a PEC sphere of diameter \(2\lambda _0\). Simulations are performed initially using the standard FDTD algorithm and regular structured meshes with mesh spacing \(\delta =\lambda _0/15\) and \(\delta =\lambda _0/60\). Fig. 10 shows the staircased representation of the surface of the sphere on these structured meshes. The simulation is repeated using the unstructured FDTD algorithm, with a conforming unstructured mesh with global spacing \(\delta =\lambda _0/15\). For this example, cuts through a typical hybrid mesh are shown in Fig. 11. The analytical [26] and computed RCS distributions are compared in Fig. 12. It is apparent that the distributions computed on the fine structured mesh do not achieve the accuracy of the solution computed on the conformal unstructured mesh. This indicates that, for this problem, a significantly finer structured mesh must be used with the standard FDTD method to achieve accuracy comparable to that produced with the geometry conforming unstructured mesh FDTD method.

Scattering of a plane wave by a coated spherical object: a view of a cut through the mesh employed, showing the coating (blue cells) and the the object (red cells); b view of the electric scattered field \(E_{scat,y}\) in the coating and on the object. (Color figure online)
The comparison is repeated for the case of \(2\lambda _0\) dielectric sphere, with the relative values \(\epsilon _r= 2\) and \(\mu _r = 1\) assigned to the material parameters in the dielectric. In addition, it is assumed that \(\sigma =\sigma _m=0\). The corresponding RCS distributions are displayed in Fig. 13. In this case, the fine structured mesh is 64 times larger than the unstructured mesh and the corresponding allowable time step is four times smaller. The result is that, for this example, the fine structured mesh FDTD algorithm CPU requirement is 256 times larger than that of the unstructured FDTD method.
The same example is used to demonstrate the order of convergence of the method on a general unstructured mesh. Meshes with global spacing of \(\lambda _0/4\), \(\lambda _0/8\), \(\lambda _0/15\) and \(\lambda _0/20\) are employed and the \({L}^2\) norm of the errors in the computed distributions of the RCS are evaluated after 20 cycles of the incident wave. Fig. 14a shows a convergence rate of 1.59 for the co-polarized RCS and Fig. 14b shows a corresponding rate of 1.48 for the cross-polarized RCS, giving an averaged value of 1.54 for the order of convergence. For a lossy dielectric sphere, with the same values for \(\varepsilon _{r}\), \(\mu _{r}=1\) and \(\sigma _m\), but with the electric conductivity \(\sigma =0.7\) S/m, the bi-static RCS distributions, computed after 20 cycles of the incident wave, are again seen to be in visually in a good agreement by comparing it with the analytical solution as can be seen in Fig. 15.
7.2 Scattering by a Coated \(2\lambda _0\) Sphere
We now consider the scattering of a plane wave by a sphere, of electrical length \(\lambda _0\), that is coated with a uniform dielectric, of thickness \(\lambda _0\). A cut through the mesh used to represent the sphere and the coating is shown in Fig. 16a. For the simulations reported here, the PML consists of 10 layers of hexahedral elements and the complete mesh consists of 876, 116 cells, with 1, 673, 527 Delaunay edges and 2, 076, 019 Voronoi edges.
Initially, the inner sphere Fig. 16a is assigned the material parameter values \(\epsilon _{r}=1\), \(\mu _{r}=1\), \(\sigma =10^{6}\) S/m and \(\sigma _{m}=0\) S/m, so that it effectively is a PEC. The coating is assumed to consist of a conducting dielectric material, with parameters \(\epsilon _{r}=2\), \(\mu _{r}=1\), \(\sigma =0.7\) S/m and \(\sigma _{m}=0\) S/m. The computed bistatic RCS distribution is compared with the analytical distribution in Fig. 17. An illustration of how the scattered electric field propagates through the sphere is given in Fig. 16b. Finally, the sphere is considered to be a dielectric, characterized by the parameters \(\epsilon _{r}=2\), \(\mu _{r}=1\), \(\sigma =\sigma _{m}=0\) S/m, and the dielectric coating is characterized by the parameters \(\epsilon _{r}=1.5\), \(\mu _{r}=1\), \(\sigma =\sigma _{m}=0\). The computed bi-static RCS distribution is compared with the analytical distribution in Fig. 18. For these two examples, the computed and analytical RCS distributions are seen to be in excellent agreement.

Scattering of a plane wave by a \(2\lambda _0\) PEC sphere coated with a conducting dielectric: a co-polarized RCS distribution; b cross-polarized RCS distribution

Scattering of a plane wave by a \(2\lambda _0\) dielectric sphere coated with a dielectric: a co-polarized RCS distribution; b cross-polarized RCS distribution
7.3 Scattering by a \(15\lambda _0\) PEC Sphere
To illustrate the performance of the procedure when it is applied to problems involving bodies of larger electrical length, we consider the simulation of the interaction between a plane single frequency incident wave and a PEC sphere of electrical length \(15\lambda _0\). The incident wave propagates in the x direction, the global element size is \(\delta =\lambda _0/10\) and the outer surface of the PML region is, at its closest point, located at a distance of \(2\lambda _0\) from the surface of the sphere. The staircase boundary is placed at a distance of \(\lambda _0/2\) from the surface of the sphere and the thickness of the PML region is set equal to \(\lambda _0\). The generated mesh has 7, 006, 329 vertices, of which 2, 460, 486 vertices are located within the PML. The unstructured mesh region near the sphere has 848, 205 vertices and, before the application of the mesh enhancement procedure, \(4.3\%\) of the cells in this region are such that the centre of the cell circumsphere lies outside the cell. Following the application of mesh enhancement, the percentage of such elements is reduced to \(1.1\%\). By allowing the merging of adjacent cells to form polyhedron cells, this percentage is further reduced to \(0.2\%\). The majority of these undesirable cells are located adjacent to the staircase boundary. A view of the surface mesh and of a cut through the final mesh is shown in Fig. 19.

Scattering by a PEC sphere of electric length \(15\lambda _0\): a view of the discretisation of the scattering surface and the discretisation on a cut through the domain mesh; b detail of this view

Scattering by a PEC sphere of electric length \(15\lambda _0\): view of the computed distribution of the \(E_{scat2}\) component of the scattered electric field on the scattering surface and on a cut through the domain mesh

Scattering by a PEC sphere of electric length \(15\lambda _0\): comparison between numerical and the exact RCS distributions: a co-polarized RCS distribution (plane \(\theta =0\)); b cross-polarized RCS distribution (plane \(\phi =\pi /2\))
The solution is advanced through 30 cycles of the incident wave, using 180 time steps per cycle. A view of the distribution of the computed contours of the \(E_{scat2}\) component of the scattered electric field, on the scattering surface and on a cut through the mesh, is displayed in Fig. 20. For comparison, the simulation is repeated using an explicit nodal low order finite element time domain scheme (FETD) [28, 29]. The FETD scheme is significantly less efficient requiring 8 times longer to advance the solution for one complete cycle of the incident wave. The RCS distributions computed with both schemes are seen to be in excellent agreement with the exact distribution in Fig. 21.
To demonstrate the effectiveness of the advocated mesh generation approach, an alternative mesh is generated, using a basic Delaunay algorithm with automatic point insertion [13], in the region between the staircase and the sphere. In this case, \(47\%\) of the tetrahedra are such that the centre of the circumsphere of the tetrahedron is located outside the tetrahedron. This percentage is reduced to \(4.3\%\) after applying the traditional mesh enhancement procedures of edge swapping, edge collapse and Laplacian smoothing [15]. Using the FETD scheme on this mesh, it is found that 162 time steps are required to advance the solution for one cycle. If the merging criterion is applied, stability of the FDTD scheme on the resulting mesh requires the use of 5491 time steps to advance the solution through one complete cycle of the incident wave. This shows quite clearly that meshing techniques that are only designed to produce a good quality Delaunay mesh will not, generally, be suitable for use with the unstructured mesh FDTD algorithm.
8 Basic Algorithm: Geometries of More Complex Shape
To demonstrate its predictive capabilities, the described approach is now applied to problems involving more complex geometries.
8.1 Scattering by a PEC Aircraft
This example involves the interaction between a plane single frequency incident wave and a PEC full aircraft configuration. The wave frequency selected is such that the electrical length of the aircraft is \(10\lambda _0\).

Scattering by a PEC aircraft configuration of electric length \(10\lambda _0\): a view of the discretised surface; b detail of the discretised surface and of a cut through the mesh
The main axis of the aircraft is aligned with the x direction and the incident wave propagates in this direction, with the wave impinging directly onto the nose of the aircraft. The staircase surface is located at a distance \(\lambda _0/2\) from the scatterer and the thickness of the PML is taken to be \(\lambda _0\). Two meshes, with an element size \(\delta =\lambda _0/15\), are created. The first mesh is designed for use with the FETD method, with the region of tetrahedral elements generated using the standard Delaunay approach with automatic point insertion [13]. This mesh contains 4, 274, 438 vertices, of which 2, 129, 120 vertices are located within the PML region. The second mesh, for use with the FDTD co-volume algorithm, is generated using the approach outlined above and contains 4, 378, 740 vertices, with 2, 208, 512 vertices in the PML. For this second mesh, the percentage of tetrahedra having the property that the centre of a circumsphere of a tetrahedron is located outside the tetrahedron is reduced, from 16 to \(2.2\%\), by using the proposed mesh enhancement procedure. This percentage is reduced further to \(0.5\%\) by using the advocated merging process. The majority of these undesirable elements again lie in the vicinity of staircase interface. A view of the discretised aircraft surface is given in Fig. 22 and a detail of this view together with a view of the mesh on a cut through the domain is given in Fig. 22b. The solution is advanced for 40 cycles of the incident wave. The FETD computation on the first mesh takes 6.5 times longer per cycle compared to the FDTD scheme on the second mesh. It is interesting to note that the time required for the generation of the mesh for the co-volume scheme is 81 min. A detail of the computed distribution of contours of the \(E_{scat,x}\) component of the scattered electric field on the aircraft surface is given in Fig. 23. The RCS distributions computed by the FETD method and the FDTD algorithm on these meshes are compared in Fig. 24. Note that, in the context of scattering by a PEC dodecahedron using a completely ideal mesh, we have demonstrated previously [11] the convergence properties of the co-volume algorithm and its improved performance on a given mesh, for problems involving singularities, over that of the FETD method. This means that the discrepancies that are apparent here between the two RCS distributions for this example are probably due to the inability of the nodal finite element scheme to adequately represent the solution in the vicinity of geometrical singularities, without the use of additional local mesh refinement [19].

Scattering by a PEC aircraft configuration of electric length \(10\lambda _0\): view of the computed distribution of the \(E_{scat,x}\) component of the scattered electric field on the aircraft surface

Scattering by a PEC aircraft configuration of electric length \(10\lambda _0\): comparison between the computed RCS distributions: a co-polarized RCS distribution (plane \(\theta =0\)); b cross-polarized RCS distribution (plane \(\phi =\pi /2\))
8.2 Illumination of a Radome by a Narrow Band Pulse
This example illustrates the calculation of the transmission efficiency of a dielectric radome. Radomes of this type are typically used to conceal aircraft communication or radar systems. The radome is modelled as half an ellipsoid, with a lateral radius of 0.5 m, a length of 1 m and a thickness of 0.05 m. The ellipsoid is constructed of IparPlexiglass, with a relative electric permittivity \(\epsilon _{r}=2.59\) and a conductivity \(\sigma =0.015\) S/m. The 200 MHz pulse
[Eq. (21)], linearly polarised in the y direction and propagating towards the front of the radome in z direction, is used to illuminate the radome, where \(\tau =3.336\times 10^{-9}\,\hbox {s}\) denotes the pulse width. An indication of the mesh employed can be obtained from Fig. 25a. The mesh has 20 degrees of freedom per wavelength and uses one layer of elements to represent the radome. The PML region is discretised using 10 layers of hexahedral elements and the smallest distance between the inner boundary of the PML and the radome surface corresponds to 8 cells. The complete mesh consists of 228, 371 cells, 537, 375 Delaunay edges and 587, 500 Voronoi edges. Fig. 25b shows computed contours of the scattered electric component \(E_{scat2}\) of the pulse on the portion of the mesh shown in Fig. 25a. To verify that one layer of elements is sufficient to accurately model the dielectric, a new mesh is generated for the same radome, but using now 40 degrees of freedom per wavelength. The discretisation of the radome on the first mesh is shown in Fig. 26a and on the second mesh in Fig. 26b. The fine mesh contains 876, 314 cells, 1, 673, 283 Delaunay edges and 2, 076, 114 Voronoi Edges. The frequency dependent transmission, T(f), which corresponds to a measure of the amplitude of the total electric field divided by the amplitude of the incident electric field, at a point \(\mathbf {r}_{0}\) behind the dielectric object is evaluated as
where \(\text{ FT }\) corresponds to the Fourier transform of the electric field. The value of the transmission obtained from the finer mesh is compared with that obtained from the coarser mesh in Fig. 27. The small differences between these results suggests that acceptable accuracy may be achieved here by using just one layer of cells to model the thickness of the radome.

Illumination of a radome showing: a a view of the coarse mesh used, with the yellow cells representing the dielectric and the white and blue cells representing free space; b a view of the computed component \(E_{scat,y}\) of the scattered electric field. (Color figure online)

Discretisation of the radome on a mesh using a 20 degrees of freedom per wavelength; b 40 degrees of freedom per wavelength

Comparison of the transmission of a 200 MHz pulse through a dielectric Radome, with pulse width \(3.336\times 10^{-9}\) s, evaluated on the coarse and fine meshes
To study the effect of different frequencies on the same mesh, two narrowband pulses are considered. Both have a pulse width of \(1\times 10^{-9}\,\hbox {s}\), with the first centred at 1 GHz and the second centred at 1.2 GHz. In the frequency range where the pulse spectra overlap, the transmission is expected to be the same. The predicted variation of the computed transmission efficiency with frequency, for both pulses, is plotted in Fig. 28. The mesh generation for this problem is challenging due to the rather thin thickness of the layer and extra care needs to be taken when collecting the total field history inside the radome. To reduce the influence of the dispersion error the incident field values in the update Eqs. (13) and (14) are not taken from the known function of Eq. (21) but are interpolated from a 1D FDTD code running in parallel. This 1D code runs with the same time step and with a uniform mesh, with the mesh spacing equal to the spacing of the regular hexahedra in the actual problem.

Comparison of the computed transmission spectrum, through a dielectric radome, for two narrowband pulses, with one centred at 1 GHz and the other centered at 1.2 GHz, on the mesh with 40 degrees of freedom per wavelength
9 Modelling Anisotropic Lossy Materials
For anisotropic materials, the electromagnetic parameters, such as permittivity, permeability and conductivity, vary in different directions, so that they must be treated as tensors. Such materials offer many new and interesting possibilities in engineering, e.g. a thin anisotropic coating may significantly change the RCS distribution of an aircraft. With their additional mechanical strength and weight advantages, compared to metals, composite anisotropic materials, with applications initially limited to stealth aircrafts, satellites and space shuttles, are now part of everyday life [30]. In addition, anisotropy is at the heart of the new metamaterials, which have electromagnetic properties that do not occur naturally, such as a negative index of refraction [31]. It is clearly important to extend the capabilities of the FDTD method to enable the modelling of problems involving such anisotropic materials. The approach that will be followed was initially introduced within the context of a total field formulation [30], but our unstructured mesh extension employs a scattered field formulation.
For a three dimensional lossy anisotropic dielectric medium, the Laws of Ampère and Faraday are expressed, in a scattered field form, as
and
where \(\mathbf {D}\) denotes the electric flux density and \(\mathbf {B}\) the magnetic flux. In addition, \(\bar{\bar{I}}\) is the unit matrix, \(\bar{\bar{\varepsilon }}\) is the electric permittivity tensor, \(\bar{\bar{\mu }}\) is the magnetic permeability tensor and \(\bar{\bar{\sigma }}\) and \(\bar{\bar{\sigma }}_m\) are the electric and magnetic conductivity tensors respectively. The constitutive equations
define the relationships between the electric and magnetic fields and the electric flux density and the magnetic flux.
9.1 Unstructured Mesh Algorithm
For the solution of this equation set, the unknown at the centre of the ith Delaunay edge, illustrated in Fig. 3a, corresponds to the projection, \((D_{scat,i},E_{scat,i})\), of the scattered electric field onto the direction of the edge. The unknown at the centre of the jth Voronoi edge, illustrated in Fig. 3b, corresponds to the projection, \((B_{scat,j},H_{scat,j})\), of the scattered magnetic field onto the direction of that edge. Direct discretization of the Laws of Ampère and Faraday then leads to the equations
and
Here, the bracket notation \(\left\langle \mathbf {F},\hat{\mathbf {e}_{i}} \right\rangle\) is used to denote the projection of a field vector \(\mathbf {F}\) along the ith edge. At interface boundaries, the material parameters in the Eqs. (27) and (26) are not constant and are replaced by averaged values \(\bar{\bar{\varepsilon }}_{av}\), \(\bar{\bar{\mu }}_{av}\), \(\bar{\bar{\sigma }}_{av}\) and \(\bar{\bar{\sigma }}_{m_{av}}\). In this case, every component of the material parameter tensor is averaged following the approach employed earlier for the isotropic case [32]. To represent the vector-matrix multiplications that are required, we define
and these definitions enable us to write Eqs. (26) and (27) as
and
The quantities \(\left. \mathbf {D}_{scat}^{n}\right| _{i}\), \(\left. \mathbf {E}^{n+1/2}_{inc}\right| _{i}\), and \(\left. \mathbf {B}_{scat}^{n-1/2}\right| _{j}\), \(\left. \mathbf {H}_{inc}^{n}\right| _{j}\) represent field vectors computed at the centre of the ith Delaunay edge and the jth Voronoi edge respectively.
9.2 Obtaining Approximated Field Vectors from Edge Projections
To perform the necessary matrix–vector multiplications in Eqs. (32) and (33), we need to obtain the field vectors \(\mathbf {D}_{scat}\) and \(\mathbf {B}_{scat}\) and associate them with Delaunay edge i and Voronoi edge j respectively. Unfortunately, we cannot get exact full field vector components directly from edge projections, but we are able to approximate the full field components at any location in the mesh. To achieve this, we assume that, with a set of three orthogonal vectors \(\mathbf {v}_1,\mathbf {v}_2,\mathbf {v}_3\), a general vector \(\mathbf {x}\) can be reconstructed as
in terms of the projections
As the mesh is unstructured, we cannot use this method directly to obtain an exact field vector (Please note that Einstein notations is not employed in this paper). The trivial solution would be to consider all the edges connected to one node, as depicted in Fig. 39b, and solve a system of equations. This will give us a field vector at node \(n_1\). As one edge is always formed by two points, we can do the same for point \(n_2\) and average these field vectors and project to the corresponding edge. For example, to obtain the displacement field vector \(\mathbf {D}_{scat}\) on the edge i, denoted by the red line in Fig. 29a, we have to construct the set of equations

Interpolation of the field vector at node \(n_1\): a tetrahedra in the Delaunay mesh containing the point \(n_1\); b edges in the Delaunay mesh containing the point \(n_1\). (Color figure online)
where
and \(\hat{\mathbf {e}}_i\) is the normalized Delaunay edge vector corresponding to Delaunay edge i. The entries in the matrix \(\bar{\bar{\mathbf {P}}}\), based upon the three components of the vector \(\hat{\mathbf {e}}_i\) and the projections \(\mathbf {D}_{scat} \cdot \hat{\mathbf {e}}_i\), are all known. The displacement field vector, \(\mathbf {D}_{scat}\), at a node belonging to Delaunay edge i is approximated by considering the sum of the system in Eq. (36) for each Delaunay edge connected to the node, as depicted in Fig. 29b. In this case, we solve the system
with
Here, \(\bar{\bar{\mathbf {P}}}'\) and \(\mathbf {D}_{scat,q} \cdot \hat{\mathbf {e}}_{q}\) are known and N is the number of Delaunay edges connected to the node. This system of equations is solved locally, node by node, resulting in an approximated field vector at all nodes of the Delaunay mesh. The computed field vector is then linked to the corresponding edges. A Delaunay edge is assumed to connect the two nodes \(n_1\) and \(n_2\) and the displacement field vector, associated to the Delaunay edge i, is obtained by averaging the electric field vectors at nodes \(n_1\) and \(n_2\), i.e. \(\mathbf {D}_{scat,i}=\left( \mathbf {D}_{scat,n_1}+\mathbf {D}_{scat,n_2}\right) /2\). The same procedure is applied for approximating the magnetic flux vectors \(\mathbf {B}_{scat}\), but using now the Voronoi edges. However, unlike the standard FDTD scheme, where we have one update equation for each component of the field vectors, the approximations of the full vector fields obtained using this method are not good enough for time iterating the field components. It is found that error accumulation causes the algorithm to become unstable. We modified it in order to circumvent this difficulty.
9.3 Local Orthogonal Unit Vectors
It is the projection, \(D_{scat,i}=\mathbf {D}_{scat}\cdot \mathbf {e}_i\), of displacement field vector \(\mathbf {D}_{scat}\) onto a Delaunay edge \(\mathbf {e}_i\), that is updated in the solution process. For an isotropic material, the electric permittivity and the magnetic permeability are scalars, so that updating the fields only involves scalar multiplication between the field projections and the scalar material properties. For an anisotropic material, matrix–vector multiplications, between the material tensors (\(\bar{\bar{\varepsilon }}\), \(\bar{\bar{\mu }}\), \(\bar{\bar{\sigma }}\),\(\bar{\bar{\sigma }}_{m}\)) and the fields (\(\mathbf {D}_{scat},\mathbf {B}_{scat}\)), are required. To perform these multiplications, we create two linearly independent vectors for each Delaunay and Voronoi edge. Using the stabilized Gram–Schmidt orthonormalization procedure, we generate three orthonormal vectors, as illustrated in Fig. 30. The first vector \(\mathbf {e_1}\), to which the two linearly independent vectors (\(\mathbf {e'}_{2}\),\(\mathbf {e'}_{3}\)) are added, remains unchanged during the whole process. Each set of three orthogonal vectors represents one local coordinate system, leading to as many local systems as Delaunay and Voronoi edges. We have already seen how we can reconstruct approximated field vector components for each local coordinate system, using the field projections of the surrounding Delaunay or Voronoi edges. The field vectors, obtained in this way, are projected onto the two orthogonal vectors forming the local frame. The first vector of each subset can be immediately updated using the projection equation employed in the isotropic case. For this projection, no error is induced by the field averaging.

Generating the orthonormal local coordinate system
9.4 Coordinate Transformation
The material tensors are expressed in the global reference frame formed by the orthonormal vectors \(\hat{\mathbf {x}}\), \(\hat{\mathbf {y}}\) and \(\hat{\mathbf {z}}\). Three orthonormalized vectors \(\hat{\mathbf {x}}',\ \hat{\mathbf {y}}',\ \hat{\mathbf {z}}'\) form the basis of each local coordinate system. Here, the symbol \(\hat{\,}\) denotes a unit vector and the symbol \('\) refers to vectors or vector components in the local coordinate system. The Jacobian matrix \(\bar{\bar{J}}\), defined by
can be used to transform from the global (x, y, z) to a local frame. Each component of the Jacobian can be interpreted as an amplification factor, describing how one coordinate in a given reference frame stretches, shrinks or rotates with respect to another coordinate in another reference frame. In our case, the Jacobian is purely a rotation matrix \(\bar{\bar{J}}_R\), which can be directly calculated as
This rotation matrix has unit determinant, i.e. \(\text{ det }(\bar{\bar{J}}_R)=1\). Using a simplified set of Maxwells equations the form invariance [33, 34] is easiest explained in the following paragraph by expressing them in the local coordinate system, as
The electric and magnetic fields, in local and global coordinates, are related as
while a general material parameter tensor, \(\bar{\bar{M}}\), is transformed to the local coordinate system as
In this way, the coordinate transformation may be absorbed completely into the material properties.
9.5 Time Updating
The magnetic field is updated over the dual mesh at the half time step, using Eq. (33), and the electric field is updated over the primal mesh at the full time step, using Eq. (32). We will describe the updating of the electric field projection \(E^n_{scat}\). The magnetic field \(H^n_{scat}\) is updated similarly. The coordinate transformation applied to the terms \(\bar{\bar{a}}_{\varepsilon +}, \bar{\bar{a}}_{\varepsilon -}\), defined in Eq. (28), and the term \(\bar{\bar{\varepsilon }}_{av}'^{-1}\), defined in Eq. (32), gives
These values are stored at the corresponding Delaunay edges before entering the time loop. Within the time iteration loop, Eq. (31), for each Delaunay edge \(\hat{\mathbf {e}}_i\), is calculated and stored. This is readily accomplished, as the magnetic components in the circulation term \(\sum _{k=1}^{M_{i}^{V}}H_{scat,j_{i,k}}^{n+0.5}l_{j_{i,k}}^{V}\) are available, from the previous iteration, and the complete vector \({\mathbf {E}}^{n+0.5}_{inc,i}\) is a known function. Before updating the projection \(D_{scat}^n\), the vectors \(\mathbf {D}_{scat}^n\) and \(\mathbf {Z}_D\) are calculated using Eq. (38). These vectors are projected in each of the three orthogonal directions of every local frame, e.g. \(\hat{\mathbf {e}}'_1\equiv \hat{\mathbf {e}}_1,\ \hat{\mathbf {e}}'_2,\ \hat{\mathbf {e}}'_3\) from Fig. 30, and the matrix vector multiplication is performed. In this way, Eq. (33) in the local frame takes the vector form
The constitutive equation may then be used to obtain the electric field projection. In practice, we only have to consider the first line of \(\bar{\bar{\varepsilon }}'^{-1}_{av}\), due to the fact that our data storage is based upon field projections along the edges and not field vectors. As a result, we can obtain
These values are then again used in to compute the curl in Eq. (30).
10 Anisotropic Material Modelling Algorithm: Initial Validation
A series of examples, involving scattering of an incident plane wave by an anisotropic sphere, is performed to validate the revised algorithm and to demonstrate its numerical performance. Validation of the implementation is achieved by comparing the computed RCS distributions with those obtained from the open source program Discrete Dipole Scattering (DDSCAT) [35], which is an implementation of the frequency domain discrete dipole approximation [36]. In each case, the incident wave, propagating in the x direction, has free space wavelength \(\lambda _0\) and the electrical length of the sphere is \(2\lambda _0\). The mesh employed is illustrated in Fig. 31 and has an average edge length of \(\lambda _0/20\). The PML region is located at a minimum distance of \(\lambda _0\) from the scatterer and is discretised using 10 layers of hexahedra. The complete mesh consists of 876, 116 cells, 1, 673, 527 Delaunay edges and 2, 076, 019 Voronoi edges [23]. It is worth noting that our unstructured mesh FDTD scheme only needs 8 points per wavelength to produce accurate results in free space [8]. However, inside a dielectric, the wavelength, \(\lambda _{Diel}\), is less than the free space wavelength, \(\lambda _0\). For the anisotropic case, it is estimated that a mesh spacing of \(\lambda _0/20\) mesh should be sufficient here. Despite the fact that coarser meshes could have been used in some cases, we decided to use the same mesh for all the examples.

Scattering by a dielectric anisotropic sphere: a cut through the mesh used to represent the sphere; b contours of \(E_{scat,y}\) on a cut through the computational domain
10.1 Electrically Lossy Anisotropic Sphere
For the first example, the material parameters
are employed and matrix multiplications are required in Eq. (27). Steady state conditions were attained after ten cycles of the incident wave. The computed RCS distributions are shown to be in excellent agreement with the DDA results in Fig. 32.

Scattering of a plane wave by a dielectric sphere of electrical length \(2\lambda _0\) with anisotropic permittivity and electrical conductivity: a co-polarized RCS distribution; b cross-polarized RCS distribution
10.2 Magnetically Lossy Anisotropic Sphere
In the next example, the material parameters of the sphere are characterised, by an anisotropic permeability tensor, together with magnetic conductivity, as

Scattering of a plane wave by a dielectric sphere of electrical length \(2\lambda _0\) with anisotropic permeability and magnetic conductivity: a co-polarized RCS distribution; b cross-polarized RCS distribution
Now, matrix multiplication is required in Eq. (26) and steady state is again reached after ten cycles of the incident wave. The computed RCS distribution is compared with the DDA results in Fig. 33.
10.3 Analysis of the Full Anisotropic Model
To investigate the time penalty that results from the use of the anisotropic model, two simulations are performed on the same mesh. In the first example, the sphere is taken to be an isotropic lossy dielectric material. In the second example, the sphere is modelled as an anisotropic lossy dielectric material, characterised by the parameters
Comparison with DDA results is not possible for the second example, as the DDA code only allows for the modelling of non-magnetic materials. It is found that the computational cost for the simulation involving the anisotropic sphere is ten times the cost of the simulation for the isotropic sphere. This extra cost mainly arises from Eq. (38), which is a requirement to solve a system of three equations for each Voronoi and each Delaunay node. The y and z components of the electric and magnetic fields respectively are represented in Fig. 34

Scattering of a plane wave by a fully anisotropic dielectric sphere of electrical length \(2\lambda _0\): a contours of \(H_{scat,z}\) shown on a cross-section through the mesh; b contours of \(E_{scat,y}\) shown on a cross section through the mesh
Given this additional cost, it is reasonable to ask if the current scheme is competitive when compared to the standard FDTD method for this class of problems. We have previously shown [23] that the accuracy of this scheme, with a \(\lambda _0/15\) unstructured mesh, compares favourable with that of the standard FDTD method, with a \(\lambda _0/90\) or even a \(\lambda _0/120\) structured mesh for objects of arbitrary shape. This means that we get comparable results when using a mesh that is 6–8 times coarser. A standard FDTD cell stores the electric and magnetic field components at 12 edges and 6 faces respectively, corresponding to 18 degrees of freedom per wavelength. One FDTD cell may be discretised using 6 tetrahedra, in the worst case scenario, leading to 19 edges and 14 faces and a total of 33 degrees of freedom per wavelength. Although the number of degrees of freedom has nearly doubled, this is more than compensated by the fact that we may use a mesh that is, at least, 6 times coarser. Furthermore, for the same volume in three dimensions, an unstructured mesh with 33 degrees of freedom produces the same accuracy as a structured mesh with \(6^3\times 6 = 1296\) degrees of freedom. The extra operations, needed for averaging and reconstructing vectors, imply a cost penalty. For each node, we require 18 averaging operations for each field, in addition to \(3 \times 3\) operations of vector reconstruction for each edge. For the 6 tetrahedra lying inside one cube, the number of operations will then be \(2 \times 8 \times 18 + 9 \times 33=585\). For one cell of a cartesian mesh, 8 operations are required for averaging the two offset components of a field vector, leading to 48 extra operations on one cell node or 144 per FDTD cell. This implies that, when dealing with curved boundaries, to achieve the same level of accuracy, the standard FDTD scheme will actually require \(6^3 \times 48=10{,}368\) operations per computational volume, whereas the current unstructured implementation has only 585 operations.
11 Anisotropic Material Modelling Algorithms: Geometry of More Complex Shape
To illustrate the predictive modelling capability of the enhanced solution algorithm, we consider again a problem involving the evaluation of the transmission efficiency of a pulse through a radome.The dimensions of the radome remain unaltered, but an anisotropic dielectric material, containing conducting fibres, is used to construct the radome. The mesh employed for the simulation, with 40 degrees of freedom per wavelength, is the mesh that was used earlier for the isotropic material case. The incident plane wave is again the narrow band pulse defined in Eq. (21), polarised in the y direction.
Figure 35a is a schematic of a cut through a slab of composite material, in which the fibres are oriented in the \(\hat{\mathbf {y}}''\) direction. Reinforced carbon-carbon is such a type of composite where carbon fibres are reinforcing a graphite matrix. This material is for example used as heatshields for space shuttles. For the illustrated slab orientation, the material frame \((\hat{\mathbf {x}}'',\hat{\mathbf {y}}'',\hat{\mathbf {z}}'')\) and the global frame \((\hat{\mathbf {x}},\hat{\mathbf {y}},\hat{\mathbf {z}})\) are identical. The situation is more complicated for the curved shell of the radome, as the orientation of the fibres changes in space. In this case, for each location on the shell, we have a material frame which, in general, differs from the global frame as illustrated schematically in Fig. 35b.

Composite material: a orientation of fibres in the material frame; b orientation of the fibres inside the radome
Previously, we have only used the coordinate transformation to pass from a global frame (\((\hat{\mathbf {x}},\hat{\mathbf {y}},\hat{\mathbf {z}})\) coordinates) to a local frame (\((\hat{\mathbf {x}}',\hat{\mathbf {y}}',\hat{\mathbf {z}}')\) coordinates), linked to each Voronoi or Delaunay edge. For a composite it becomes more complicated as we first have to make a coordinate transformation from the material frame, linked to the orientation of the fibres (referred to as \((\hat{\mathbf {x}}'',\hat{\mathbf {y}}'',\hat{\mathbf {z}}'')\) coordinates) to the global frame (\((\hat{\mathbf {x}},\hat{\mathbf {y}},\hat{\mathbf {z}})\) coordinates). We then pass as before from the global frame, to a local frame \((\hat{\mathbf {x}}',\hat{\mathbf {y}}',\hat{\mathbf {z}}')\) which is linked to each Voronoi or Delaunay edge. Mathematically these transformations are performed as follows: \((\hat{\mathbf {x}}'',\hat{\mathbf {y}}'',\hat{\mathbf {z}}'') \rightarrow \bar{\bar{J}}_{R1} \rightarrow (\hat{\mathbf {x}},\hat{\mathbf {y}},\hat{\mathbf {z}})\rightarrow \bar{\bar{J}}_{R2} \rightarrow (\hat{\mathbf {x}}',\hat{\mathbf {y}}',\hat{\mathbf {z}}')\). Here, \(\bar{\bar{J}}_{Ri},i=1,2\), are the two transformation matrices
where \(\bar{\bar{J}}_{R1}\) corresponds to the first transformation matrix describing the transformation from the material to the global frame, while \(\bar{\bar{J}}_{R2}\) corresponds to the second transformation matrix from the global to the local frame. This is therefore identical to the matrix \(\bar{\bar{J}}_R\). Both \(\bar{\bar{J}}_{Ri},i=1,2\) are computed using Eq. (41), but with respect to the corresponding coordinate system leading to Eq. (53). We create an orthonormal material frame, which simplifies the coordinate transformation as the transformation matrix becomes a simple rotation matrix. The procedure here is illustrated in Fig. 36a. Initially, we only consider Voronoi edges at the dielectric interface. Each Voronoi edge (Vor1,blue) crossing the face of a tetrahedron is surrounded by three Delaunay edges. We select two of these edges, \(Del_1\) and \(Del_2\). By construction, these edges are parallel to the surface and taking the cross product between them the creation of the vector \(\mathbf {z}''=Del_1\times Del_2\) that is perpendicular to the surface. In the next step we assign \(\mathbf {x}''=Del_1\). By construction \(\mathbf {x}''\) and \(\mathbf {z}''\) are perpendicular to each other. To create the third vector \(\mathbf {y}''\) perpendicular to \(\mathbf {x}''\) and \(\mathbf {z}''\), the cross product between \(\mathbf {z}''\times Del_1=\mathbf {z}''\times \mathbf {x}''=\mathbf {y}''\) is taken. Following normalization, we have one orthonormal material frame \((\hat{\mathbf {x}}'',\hat{\mathbf {y}}'',\hat{\mathbf {z}}'')\) for each face of the dielectric interface. In the next step, the material frame is linked to the cells inside the composite, by comparing the distances between the intersection points of a Voronoi edge with the interface and the circumcentre of all cells \(C_1\) inside the dielectric. After finding the smallest distance, we link the local material frame \((\hat{\mathbf {x}}',\hat{\mathbf {y}}',\hat{\mathbf {z}}')\) from the surface to the corresponding cell. This process is illustrated in Fig. 36b. To illustrate this process, consider a typical material parameter tensor \(\bar{\bar{M}}\), defined with respect to the material frame \((\hat{\mathbf {x}}'',\hat{\mathbf {y}}'',\hat{\mathbf {z}}'')\). The first coordinate transformation converts the material parameters, from the material to the global frame, according to
The second coordinate transformation then converts the parameters from the global to the local frame, a process that has been described earlier. If we consider, for example, Eqs. (28) and (29), the material parameters \(\bar{\bar{\varepsilon }},\bar{\bar{\sigma }},\bar{\bar{\mu }},\bar{\bar{\sigma }}_m\) have to be replaced by \(\bar{\bar{\varepsilon }}'',\bar{\bar{\sigma }}'',\bar{\bar{\mu }}'',\bar{\bar{\sigma }}''_m\) in each equation. The radome is characterized by the material parameters

Radome of composite material: a construction of the orthonormal material frame; b distance between cell centres and material frame located at the interface
Due to the orientation of the fibres, the properties of the composite are the same in the \(\hat{\mathbf {y}}''=\hat{\mathbf {m}}''\) and the \(\hat{\mathbf {x}}''=\hat{\mathbf {l}}''\) directions, but differ along the \(\hat{\mathbf {z}}''=\hat{\mathbf {n}}''\) axis (see Fig. 36). This means that for the material parameters \(\bar{\bar{M}}(1,1)''=\bar{\bar{M}}(2,2)''\ne \bar{\bar{M}}(3,3)''\), and the off-diagonal components are 0, for \(\bar{\bar{\varepsilon }}'',\bar{\bar{\sigma }}''\). The magnetic permeabiility tensor is set to the unit matrix \(\bar{\bar{I}}\), \(\bar{\bar{\mu }}''=\bar{\bar{I}}\) corresponding to free space and \(\bar{\bar{\sigma }}''_m=\bar{\bar{0}}\). Typically, a material that minimally attenuates the electromagnetic signal transmitted or received by the antenna is used.
The computed transmission for a 1 GHz narrowband pulse through the composite radome is represented in Fig. 37.

Transmission of 1 GHz pulse through a radome constructed of a fiber based composite dielectric
12 Modelling of Bi-isotropic Materials
Innovative fabrication techniques are currently being employed to create new chiral materials for use in communication technologies. For these materials, a metallic structure, with the size of around 1/10 of the wavelength of interest, is embedded in a dielectric matrix. These inclusions need to be much smaller than the wavelength, so that the incoming wave sees the matrix and the inclusions as one homogeneous material. Often, these inclusions take the form of a combination of a straight wire and a ring, to which the electric and magnetic field respectively will couple, leading to a material (Fig. 38a) with a frequency dependent response. For such materials, the electric permittivity and the magnetic permeability are frequency dependent parameters. Furthermore, for specific shapes or arrangement of the metallic inclusions, e.g. the use of left or right handed helices, as shown in Fig. 38b, the electric and magnetic fields will be related by an additional frequency dependent material parameter in the constitutive equation, referred to as the chirality. The chirality allows for a negative index of refraction with, simultaneously, a positive relative permittivity and permeabilty.

a Metamaterial developed by Smith et al. [37], b chiral metamaterial consisting of left handed helices in an epoxy resin matrix
Chiral materials can also create phenomena such as optical rotatory dispersion (ORD) and circular dichroism (CD). In ORD, the polarization is continuously rotated inside the material, while CD refers to the change of polarisation of the incident wave, from linear to elliptical, due to the different absorption coefficients of a right and a left circularly polarized wave. Such materials are being used to create smaller antennas, super lenses [38], polarizers and radomes or RCS reducing materials.
To extend the modelling approach to enable the simulation of problems involving chiral dispersive materials, a Lorentz model is employed for the electric permittivity and magnetic permeability and a Condon model is adopted for the chirality [39]. Several methods have been developed for modelling frequency dependent materials within a time domain method, including the auxiliary differential equation method [40], the piecewise recursive convolution method [41] and the Z-transform technique [42]. As these three methods have been found to produce generally comparable results, we decided to implement the Z-transform technique. This approach, which demonstrates good convergence close to the resonant frequency [43], is widely used in signal processing and can be viewed as the discrete version of the Laplace transform. It was first used to model chiral materials in 3D with FDTD [44], using the Z-transform to handle the frequency dependence of the material parameters. First order approximations were used in the Z-domain and the Z-transform coefficients were derived analytically. In a different approach [45], second order accuracy in the Z-domain is achieved by employing a bilinear transformation for calculating Padé approximants [46]. In our approach, chiral materials are modelled by employing a generalization of this method.
12.1 Problem Formulation
It is not possible to employ a pure scattered field formulation when modelling problems involving frequency dependent chiral materials. With such materials, an intermediate total field step is found to be required. In the frequency domain, the Laws of Ampère and Faraday are expressed in the integral form
and
where \({{\mathrm {j}}}=\sqrt{-1}\). In the total field formulation, the corresponding equations are
and
so that the terms \(\varepsilon (\omega )\) and \(\mu (\omega )\) do not appear. Constitutive equations for chiral materials are expressed in the form
where c is the speed of light and \(\kappa\) the chiral parameter coupling the electric and magnetic fields. The Lorentzian model
is employed to determine the variation of the permittivity and the permeability with frequency. Here, the subscript \(\infty\) denotes high frequency values, while the subscript \(\ell\) refers to the low frequency limit. The values \(\omega _e,\omega _h\) refer to the resonance frequency and \(\xi _e,\xi _h,\) to the damping coefficients. The chiral parameter is obtained, from the Condon model, as
where \(\omega _k\) denotes the resonance frequency, while \(\xi _k\) corresponds to the damping coefficient for the Chiral material. The coupling constant, \(\tau _k\), defines the magnitude of the chirality.
Using these relations, Eqs. (56) and (57) may then be expressed as
and
where
12.2 Discrete Equations and the Z-Transform
To convert Eqs. (63) and (64) from the frequency to the time domain, we use the substitution \({{\mathrm {j}}}\omega \rightarrow \frac{\partial }{\partial t}\) and then apply the FDTD time stepping scheme to discretize the resulting equations. The bilinear transformation
is used, to convert a frequency dependent function to the Z-Domain [42]. Equations (65) and (66) can be expressed, with second order accuracy in the Z-Domain, by adopting the Padé approximants \(b_0^{ij},b_1^{ij},b_2^{ij},a_1^{ij},a_2^{ij}\) for \(ij=ee,\kappa e, hh\) or \(\kappa h\). In this manner, we obtain, for example, the approximation
Transfer to the time domain is direct, as \(Z^{-m}\) acts as a backwards operator in time, e.g. for \(m=1\), \(Z^{-1}\mathbf {J}_{ee}^{n+1}=\mathbf {J}_{ee}^n\). Rearranging Eq. (68) and, for an arbitrary field, \(\mathbf {F}\) using the notation \(Z^{-m}\mathbf {F}^{n}=\mathbf {F}^{n-m}\), we obtain
Similar approximations may be written for the terms \(\mathbf {J}_{\kappa h}^{n-1/2}\), \(\mathbf {J}_{hh}^{n+1/2}\) and \(\mathbf {J}_{\kappa e}^{n+1}\). Using this notation, discretising the time dependent form of Eqs. (63) and (64) on our unstructured mesh leads directly to the update equations
and
The difficulty in these equations lies in the chiral material coupling terms \(J_{{\kappa h,i}_{av}}^{n+1/2}\) and \(J_{{\kappa e,j}_{av}}^n\). For example, \(J_{{\kappa e,j}_{av}}^n\) is required on the Voronoi edges, but it includes the electric field projections, that are only available on the Delaunay edges. The solution to this problem is illustrated in Fig. 39.

Determining the electric field on the Voronoi edges: a reconstruct the electric field vector from its projections on the Delaunay edges and link this vector to the corresponding cell center; b average the electric field vectors from the cell centers linked to the same Voronoi edge \(\mathbf {v}\) and project them to the corresponding edge
For a tetrahedron, we have six Delaunay edges and the electric field projection \(E_i,i=1,\ldots ,6\) is stored on each edge. Using these projections, the electric field vector \(\mathbf {E}_{Cell_1}\) can be reconstructed and linked to the centre of the corresponding cell, in this case cell 1. To achieve this, the equation set
is constructed, where we again use the procedure described earlier. The resulting field vector is associated to the corresponding cell center. As a Voronoi edge connects two cells, we need to repeat this procedure for the second cell leading to \(\mathbf {E}_{Cell_2}\). The field vectors linked to these cells are then averaged and projected on to the corresponding Voronoi edge \(\mathbf {v}\) according to \((\mathbf {E}_{Cell1}+\mathbf {E}_{Cell2})/2\cdot \mathbf {v}\), as illustrated in Fig. 39b. With the electric field defined on the Voronoi edges in this manner, we may then compute \(J_{{\kappa e,i}_{av}}^n\). A similar process is adopted for the magnetic field, but in this case we have a point from the Delaunay mesh inside a Voronoi cell [32].
12.3 Solution Update Process
To update the solution over one timestep, the total field formulation is employed as an intermediate step. In this manner, the solution is updated over one time step as follows:
-
1.
Magnetic field loop. Calculation of \(H_{scat,j}^{n+1/2}\)
-
(a)
reconstruct \(\mathbf {E_{scat}}^n\) from Delaunay edges and project to the Voronoi edges leading to \(E_{scat,j}^n\)
-
(b)
add the incident field to obtain the total field vector \(E_{tot,j}^n=E_{scat,j}^n+E_{inc,j}^n\)
-
(c)
compute \(J_{ke,j}^n\), \(H_{tot,j}^{n+1/2}\) and \(J_{hh,j}^{n+1/2}\)
-
(d)
compute \(H_{scat,j}^{n+1/2}=H_{tot,j}^{n+1/2}-H_{inc,j}^{n+1/2}\)
-
(a)
-
2.
Electric field loop. Calculation of \(E_{scat,i}^{n+1}\)
-
(a)
reconstruct \(\mathbf {H_{scat}}^{n+1/2}\) from Voronoi edges and project to the Delaunay edges leading to \(H_{scat,i}^{n+1/2}\)
-
(b)
add the incident field to obtain the total field vector \(H_{tot,i}^{n+1/2}=H_{scat,i}^{n+1/2}+H_{inc,i}^{n+1/2}\)
-
(c)
compute \(J_{kh,i}^{n+1/2}\), \(E_{tot,i}^{n+1}\) and \(J_{ee,i}^{n+1}\)
-
(d)
compute \(E_{scat,i}^{n+1}=E_{tot,i}^{n+1}-E_{inc,i}^{n+1}\)
-
(a)
12.4 Material Interfaces
Boundary conditions at material interfaces are applied by using a weighted average process that is similar to that employed earlier for simulations involving isotropic and anisotropic media. However, for the Padé approximants, which are required in expressions such as Eq. (68), we only average the coefficients in the numerator.

Representation of a Voronoi edge and the corresponding cells at a material interface
To illustrate this process, consider two tetrahedral cells, separated by a boundary face, as illustrated in Fig. 40, and consider the calculation of the permeability for the corresponding Voronoi edge. Applying the bilinear transformation to the frequency dependent component \(\mu _{\infty }-\mu\), from Eq. (61), leads to \((\mu _{\infty }-P(z))\), where
The magnetic flux is determined as
where the subscript \(i(=1,2)\) refers to the medium 1 or 2. The average magnetic flux at the interface is calculated as
where \(w_i=l_i/(l_1+l_2)\) for \(i=1,2\) and \(l_i\) corresponds to the length of the segment of the Voronoi edge between the intersection with the Delaunay face and the center of the tetrahedron \(C_i\) as shown in Fig. 40.
13 Bi-isotropic Material Modelling: Initial Validation
13.1 Rotation of the Plane of Polarization
To verify the implementation of the scheme, the transmission coefficients for an electromagnetic wave incident upon a chiral slab are computed, along with an evaluation of the variation of the angle of the plane of polarisation of the incident field. The dielectric slab has dimensions 0.3 m, 0.3 m and 0.1 m in the x, y, and z directions respectively and the mesh employed is such that 40 cells are used to discretise a length of 0.1 m. The electric permittivity and magnetic permeability of the slab are described by a Lorentz model and the chirality by a Condon model. The slab is located in free space, as depicted in Fig. 41.

Chiral slab (yellow) located in free space (blue). (Color figure online)
The slab has a real chirality, which induces an ORD of the incident field. In this case, the variation of the angle of polarisation, \(\varPhi\), can be computed as
where \(\kappa\) is the chirality, \(\omega\) is the angular frequency of the incident wave and L is the thickness of the slab [47]. To compute this angle, we use a Fourier transform, which allows us to evaluate the variation of the amplitude without time dependence. A point in the Delaunay mesh is selected, such that, with respect to the incident wave, it lies behind the chiral slab. Then, for a wave propagating in z direction, the numerical value for the angle of polarisation is computed as

Rotation of the plane of polarization over time for 6 different values of the chirality. The black lines correspond to the theoretical values and the coloured lines to the numerically computed values over several cycles. (Color figure online)
Figure 42 shows the numerically computed rotation compared to the theoretical result, for different values of the chirality. For values of \(\kappa\) less than 0.00407, the numerically computed angles of rotation of the plane of polarisation remain constant over time and are in good agreement with the theoretical values. For higher chiralities, however, the numerical solution shows very strong fluctuations indicating an instability of the scheme. We performed a stability analysis with respect to variations in the time step, the spatial step and the real and imaginary part of the chirality [48]. The results showed that the stability is independent of the time step size. To investigate the effect of the spatial step size on the stability, a rotation per cell is defined by expressing the slab thickness, L, as \(L=n\varDelta z\), where n is the number of cells through the slab, in the z direction, and \(\varDelta z\) is the edge length of a given cell. The cell normalised rotation of the plane of polarization is then defined as
and the relative error in this quantity is computed. For a given real chirality, reducing the mesh size leads to a more stable scheme. A similar result is obtained if we use a given mesh and vary the chirality. Typically the lower the real part of the chirality the more stable the scheme. For a stable simulation and a real chirality, the results suggest that the scheme remains stable if \(\varPhi _{cell}\le 0.4^{\circ }\). An imaginary component of the chirality also has a stabilizing effect on the scheme, as can be seen in Fig. 43. A coupling coefficient \(\tau _k=2\cdot 10^{-12}\) s leads to strong instabilities in the scheme without damping. We increase the damping, using \(\xi _k=0.01,0.025,0.5,0.1\) in turn, and again plot the angles over 20 cycles.

for different damping factors \(\xi _k=0.01,0.025,0.5,0.1\), the relative error of the computed angle over 20 cycles is plotted
From the results, shown in Fig. 43, we see that the scheme is now stable well above the \(\varPhi _{Cell}=0.4^{\circ }\) limit suggested for the non-damped case. It appears that, provided \({{\mathrm {Im}}}(\kappa )\ge {{\mathrm {Re}}}(\kappa )/15\), the scheme is stable, but, in this case, we are no longer dealing with a pure ORD.
13.2 Reflection/Transmission on a Chiral Slab
We consider the problem of simulating the interaction between an incident wave and a slab of bi-isotropic chiral material, with the object of determining the transmission and reflection coefficients. The chiral slab, which is assumed to be of infinite length and width, with a finite thickness L, fills the region \(0\le z\le L\). The regions \(-\infty \le z \le 0\) and \(L\le z\le \infty\) are filled with free space. When the incident wave takes the form of a linearly polarised narrowband pulse, as in Eq. (21), propagating in the z direction, the problem has an analytic solution [47].
In the numerical simulation, the thickness of the slab \(L=0.1\) m is discretised with 40 cells and the chiral material is characterised by the values \(\varepsilon _s=1.8\varepsilon _0\), \(\varepsilon _{\infty }=1.8\varepsilon _0\), \(\mu _s=1.1\mu _0\), \(\mu _{\infty }=1.0\mu _0\), \(\omega _e=\omega _h=\omega _k=2 \pi \times 3.5\) GHz, \(\xi _e=0.14\), \(\xi _h=0.12\), \(\xi _k=0.1\) and \(\tau _k=1\) ps. A point p1, in the free space region just ahead of the slab, is chosen for the computation of the reflection coefficient, while the transmission coefficient is calculated at a point p2, in the free space region slightly behind the slab. The co-polarized reflection coefficient, \(R_{co}\), the co-polarized transmission coefficient, \(T_{co}\), and the cross polarized transmission coefficient, \(T_{cr}\), are then determined as

Comparison between analytical and numerical transmission coefficients a co-polarized transmission coefficient \(T_{co}\); b cross polarized transmission coefficient \(T_{cr}\)

Comparison between analytical and numerical co-polarized reflection coefficients \(R_{co}\)
For a simple isotropic material, \(T_{cr}\) is equal to zero. Good agreement is obtained in the comparison between the analytical and computed distributions of the transmission coefficients shown in Figs. 44 and 45. The differences in the results arise because the analytical model assumes a slab which is infinite in both the x and y directions and, in addition, the numerical dispersion inherent in the scattered field formulation leads to a shift in the peaks for the reflection coefficient.
13.3 Chiral Sphere
This example involves the simulation of the interaction between a plane wave and a chiral sphere. We consider a \(\lambda _0/40\) sphere and employ a mesh consisting of 4, 742, 854 Delaunay cells, 1, 727, 445 Delaunay vertices, 7, 604, 002 Delaunay edges and 10, 544, 148 Voronoi edges, with 10 layers of elements in the PML region. Three different values \(0.8\,{\mathrm{m}},\,1.0\,{\mathrm{m}}\) and \(1.2\,{\mathrm{m}}\) are assigned to the free space wavelength \(\lambda _0\). For \(\lambda _0=\,1.0\,{\mathrm{m}}\) this corresponds to a sphere of electrical length \(2\lambda _0\). The wavelength \(\lambda\) inside a dielectric shrinks, with respect to free space, according to \(\lambda =\lambda _0/\sqrt{\varepsilon _r\mu _r-\kappa ^2}\). For the simulations, the values \(\varepsilon _{s}=1.8\,\varepsilon _{0}\), \(\varepsilon _{\infty }=1.6\,\varepsilon _{0}\), \(\mu _{s}=1.1\,\mu _{0}\), \(\mu _{\infty }=1.0\,\mu _{0}\), \(\omega _{e}=\omega _{h}=\omega _{k}=2\pi \times 1\,GHz\), \(\xi _{e}=0.12\), \(\xi _{h}=0.12\) are employed for the material parameters. A time step size \(\varDelta t=6.18\) ps is used and the numerical solution is advanced through 20 cycles of the incident wave. The results produced for the RCS are compared to those produced in an analytical solution of this problem, using the program developed by Demir et al. [49].

Scattering of a plane wave by a chiral sphere with \(\lambda _{0}=1\) m, \(\xi _{k}=0.3\) and \(\tau _{k}=16.7\) ps: a co-polarised RCS distribution; b cross-polarised RCS distribution

Scattering of a plane wave by a chiral sphere with \(\lambda _{0}=1\) m, \(\xi _{k}=0.3\) and \(\tau _{k}=10\) ps; a co-polarised RCS distribution; b cross-polarised RCS distribution

Scattering of a plane wave by a chiral sphere with \(\lambda _{0}=0.8\) m, \(\xi _{k}=0.3\) and \(\tau _{k}=16.7\) ps: a co-polarised RCS distribution; b cross-polarised RCS distribution

Scattering of a plane wave by a chiral sphere with \(\lambda _{0}=1.2\) m, \(\xi _{k}=0.3\) and \(\tau _{k}=16.\) ps; a co-polarised RCS distribution; b cross-polarised RCS distribution
The analytical and numerical RCS distributions are compared in Figs. 46, 47, 48, and 49 where, due to the symmetry of the RCS distributions, only the results for angles lying between \(180^{\circ }\) and \(360^{\circ }\) are shown. All the results demonstrate a very good agreement between the numerical and analytical solution for different values of the coupling constants \(\tau _{k}\) and the wavelength \(\lambda _{0}\). In particular, the very weak signal at high angles, from \(300^{\circ }\) to \(360^{\circ }\), is well captured.
14 Conclusion
We have demonstrated an unstructured mesh implementation of the classical Yee FDTD co-volume algorithm for computational electromagnetics. The complexities associated with generating an appropriate primal Delaunay mesh, together with its Voronoi dual, have been identified and addressed. The approach was used initially for the simulation of wave scattering by PEC and isotropic dielectric objects, where the efficiency of the solution process, and the accuracy of the results, has been demonstrated. An advantage of the approach is that,with the same set of equations, it allows for the modelling of isotropic lossy dielectric materials or PECs by simply increasing the conductivities to very high values. This does not lead to any instabilities in the scheme.A description has been given of the extension of the approach, to enable the modelling of problems involving anisotropic lossy materials and of problems involving frequency dependent bi-isotropic materials, with coupling between electric and magnetic fields. The incorporation of frequency dependent materials was accomplished by adopting the Z-Transform method.
This solution procedure must now be parallelised, so that its performance may be fully compared with that of other numerical techniques when applied to problems that are computationally more challenging. When this has been accomplished, the performance of the method can then be compared with that of the powerful current generation of hybrid finite difference time domain/finite element time domain methods [50,51,52,53].
References
Yee K (1966) Numerical solution of initial boundary value problems involving Maxwell’s equations in isotropic media. IEEE Trans Antennas Propag 14(3):302–307
Gedney S, Lansing FS, Rascoe DL (1996) Full wave analysis of microwave monolithic circuit devices using a generalized Yee-algorithm based on an unstructured grid. IEEE Trans Microw Theory Tech 44(8):1393–1400
Bossavit A, Kettunen L (1999) Yee-like schemes on a tetrahedral mesh, with diagonal lumping. Int J Numer Model Electron Netw Devices Fields 12:129–142
Madsen NK (1995) Divergence preserving discrete surface integral methods for Maxwell’s curl equations using non-orthogonal unstructured grids. J Comput Phys 119(1):34–45
Xie ZQ, Hassan O, Morgan K (2010) Tailoring unstructured meshes for use with a 3D time domain co-volume algorithm for computational electromagnetics. Int J Numer Methods Eng 87(1–5):48–65
Inan US, Marshall RA (2011) Numerical electromagnetics the FDTD method. Cambridge University Press, Cambridge
Taflove A, Hagness SC (2005) Computational electrodynamics: The finite-difference-time-domain method, 3rd edn. Artech House, Norwood
Sazonov I, Wang D, Hassan O, Morgan K, Weatherill N (2006) A stitching method for the generation of unstructured meshes for use with co-volume solution techniques. Comput Methods Appl Mech Eng 195(13–16):1826–1845
Naylor DJ (1999) Filling space with tetrahedra. Int J Numer Methods Eng 44(10):1383–1395
Eppstein D, Sullivan JM, Üngör A (2004) Tiling space and slabs with acute tetrahedra. Comput Geom 27(3):237–255
Sazonov I, Hassan O, Morgan K, Weatherill NP (2007) Generating the Voronoi-Delaunay dual diagram for co-volume integration schemes. In: 4th international symposium on Voronoi diagrams in science and engineering (ISVD 2007). IEEE
Peraire J, Vahdati M, Morgan K, Zienkiewicz OC (1987) Adaptive remeshing for compressible flow computations. J Comput Phys 72(2):449–466
Weatherill NP, Hassan O (1994) Efficient three-dimensional Delaunay triangulation with automatic point creation and imposed boundary constraints. Int J Numer Methods Eng 37:2005–2040
Frey PJ, Borouchaki H, George P-L (1998) 3D Delaunay mesh generation coupled with an advancing-front approach. Comput Methods Appl Mech Eng 157(1–2):115–131
Thompson JF, Soni BK, Weatherill NP (1998) Handbook of grid generation. CRC Press, Boca Raton
Du Q, Faber V, Gunzburger M (1999) Centroidal Voronoi tessellations: applications and algorithms. SIAM Rev 41(4):637–676
Lloyd S (1982) Least squares quantization in PCM. IEEE Trans Inf Theory 28(2):129–137
Aurenhammer F, Edelsbrunner H (1984) An optimal algorithm for constructing the weighted Voronoi diagram in the plane. Pattern Recogn 17(2):251–257
Sazonov I, Hassan O, Morgan K, Weatherill NP (2008) Comparison of two explicit time domain unstructured mesh algorithms for computational electromagnetics. In: Partial differential equations, pp 95–112. Springer Netherlands
Sazonov I, Hassan O, Morgan K, Weatherill NP (2006) Smooth Delaunay–Voronoï dual meshes for co-volume integration schemes. In: Proceedings of the 15th international meshing roundtable, pp 529–541. Springer, Berlin
Peiro J, Peraire J, Morgan K (1989) The generation of triangular meshes on surfaces. Appl Surf Modell 114:25–33
Hwang K, Cangellaris AC (2001) Effective permittivities for second-order accurate FDTD equations at dielectric interfaces. IEEE Microw Wirel Compon Lett 11(4):158–160
Gansen A, El Hachemi M, Belouettar S, Hassan O, Morgan K (2015) An effective 3D leapfrog scheme for electromagnetic modelling of arbitrary shaped dielectric objects using unstructured meshes. Comput Mech 56(6):1023–1037
Berenger JP (1994) A perfectly matched layer for free-space simulation in finite-difference computer codes. J Comput Phys 114:185–200
Bondeson A, Rylander T, Ingelström P (2005) Computational electromagnetics. Springer, Berlin
Balanis CA (1989) Advanced engineering electromagnetics. Wiley, New York
Morgan K, Brookes PJ, Hassan O, Weatherill NP (1998) Parallel processing for the simulation of problems involving scattering of electromagnetic waves. Comput Methods Appl Mech Eng 152(1–2):157–174
Morgan K, Hassan O, Peraire J (1994) An unstructured grid algorithm for the solution of Maxwell’s equations in the time domain. Int J Numer Methods Fluids 19(9):849–863
Morgan K, Hassan O, Peraire J (1996) A time domain unstructured grid approach to the simulation of electromagnetic scattering in piecewise homogeneous media. Comput Methods Appl Mech Eng 134(1–2):17–36
Lixing D, Sebak AR (2006) 3D FDTD method for arbitrary anisotropic materials. Microw Opt Technol Lett 48:2083–2090
Chanda D, Shigeta K, Gupta S, Cain T, Carlson A, Mihi A, Baca AJ, Bogart GR, Braun P, Rogers JA (2011) Large-area flexible 3D optical negative index metamaterial formed by nanotransfer printing. Nat Nanotechnol 6(7):402–407
Gansen A, El Hachemi M, Belouettar S, Hassan O, Morgan K (2016) EM modelling of arbitrary shaped anisotropic dielectric objects using an efficient 3D leapfrog scheme on unstructured meshes. Comput Mech 58(3):441–455
Cai W, Shalaev V (2010) Optical metamaterials: fundamentals and applications, chapter 9, transformation optics and electromagnetic cloak of invisibility. Springer, New York, pp 159–195
Werner DH, Kwon D (2014) Transformation electromagnetics and metamaterials. Springer, London
Draine BT, Flatau PJ (1994) Discrete-dipole approximation for scattering calculations. J Opt Soc Am A 11:1491–1499
Eremin Y (2000) Method of discrete sources in electromagnetic scattering by axially symmetric structures. J Commun Technol Electron 45:269–280
Smith D, Willie Padilla D, Vier SN-N, Schultz S (2000) Composite medium with simultaneously negative permeability and permittivity. Phys Rev Lett 84(18):4184–4187
Zhang X, Liu Z (2008) Superlenses to overcome the diffraction limit. Nat Mater 7(6):435–441
Nayyeri V, Soleimani M, Rashed Mohassel J, Dehmollaian M (2011) FDTD modeling of dispersive bianisotropic media using Z-transform method. IEEE Trans Antennas Propag 59(6):2268–2279
Kashiwa T, Fukai I (1990) A treatment by the FD-TD method of the dispersive characteristics associated with electronic polarization. Microw Opt Technol Lett 3(6):203–205
Luebbers RJ, Hunsberger F, Kunz KS (1991) A frequency-dependent finite-difference time-domain formulation for transient propagation in plasma. IEEE Trans Antennas Propag 39(1):29–34
Sullivan DM (1992) Frequency-dependent FDTD methods using Z transforms. IEEE Trans Antennas Propag 40(10):1223–1230
Lin Z, Thylen L (2009) On the accuracy and stability of several widely used FDTD approaches for modeling Lorentz dielectrics. IEEE Trans Antennas Propag 57(10):3378–3381
Demir V, Elsherbeni AZ, Arvas E (2005) FDTD formulation for dispersive chiral media using the Z transform method. IEEE Trans Antennas Propag 53(10):3374–3384
Pereda J, Grande A, Gonzales O, Vegas A (2006) FDTD modeling of chiral media by using the Mobius transformation technique. Antennas Wirel Propag Lett 5(1):327–330
Baker GA, Graves-Morris PR (1996) Padé approximants. Cambridge University Press, Cambridge
Lindell IV, Sihvola AH, Tretyakov SA, Viitanen AJ (1994) Electromagnetic waves in chiral and bi-isotropic media. Artech House, Norwood
Gansen A, El Hachemi M, Belouettar S, Hassan O, Morgan K (2019) EM modelling of arbitrary shaped dispersive chiral dielectric objects using a 3D leapfrog scheme on unstructures meshes.Computational Mechanics (Submitted)
Demir V, Elsherbeni A, Worasawate D, Arvas E (2004) A graphical user interface (GUI) for plane-wave scattering from a conducting, dielectric, or chiral sphere. IEEE Antennas Propag Mag 46(5):94–99
Rylander T, Bondeson A (2000) Stable FEM-FDTD hybrid method for Maxwell’s equations. Comput Phys Commun 125(1–3):75–82
Edelvik F, Ledfelt G (2002) A comparison of time-domain hybrid solvers for complex scattering problems. Int J Numer Model Electron Netw Devices Fields 15(5–6):475–487
Hachemi ME, Hassan O, Morgan K, Rowse D, Weatherill N (2004) A low-order unstructured-mesh approach for computational electromagnetics in the time domain. Philos Trans R Soc A Math Phys Eng Sci 362(1816):445–469
Xie ZQ, Hassan O, Morgan K (2009) A parallel implicit/explicit hybrid time domain method for computational electromagnetics. Int J Numer Methods Eng 80(8):1093–1109
Acknowledgements
A. Gansen gratefully acknowledges the financial support provided by the National Research Fund, Luxembourg AFR5977057. The authors acknowledge the support of the UK EPSRC, under Grant Numbers EP/K502935 and EP/D074258/1.
Author information
Authors and Affiliations
Corresponding author
Additional information
Publisher's Note
Springer Nature remains neutral with regard to jurisdictional claims in published maps and institutional affiliations.
Rights and permissions
Open Access This article is licensed under a Creative Commons Attribution 4.0 International License, which permits use, sharing, adaptation, distribution and reproduction in any medium or format, as long as you give appropriate credit to the original author(s) and the source, provide a link to the Creative Commons licence, and indicate if changes were made. The images or other third party material in this article are included in the article's Creative Commons licence, unless indicated otherwise in a credit line to the material. If material is not included in the article's Creative Commons licence and your intended use is not permitted by statutory regulation or exceeds the permitted use, you will need to obtain permission directly from the copyright holder. To view a copy of this licence, visit http://creativecommons.org/licenses/by/4.0/.
About this article

Cite this article
Gansen, A., El Hachemi, M., Belouettar, S. et al. A 3D Unstructured Mesh FDTD Scheme for EM Modelling. Arch Computat Methods Eng 28, 181–213 (2021). https://doi.org/10.1007/s11831-019-09395-z
Received:
Accepted:
Published:
Issue Date:
DOI: https://doi.org/10.1007/s11831-019-09395-z