
Abstract
In this study, different cationic surfactants were prepared by reacting dodecyl bromide with tertiary amines to produce a series of quaternary ammonium salts that were converted subsequently to stannous and cobalt cationic complexes via complexing them with stannous (II) or cobalt (II) ions. Surface properties such as surface- and interfacial-tension, and the emulsifying power of these surfactants were investigated. The surface parameters including critical micelle concentration, maximum surface excess, minimum surface area, tension lowering efficiency and effectiveness were studied. The free energy of micellization and adsorption were calculated. Antimicrobial activity was determined via the inhibition zone diameter of the prepared compounds, which was measured against six strains of a representative group of microorganisms. The antimicrobial activity of some of the prepared surfactants against sulfate reducing bacteria was determined by the dilution method. FTIR spectra, elemental analysis and a H1 NMR spectrum were examined to confirm compound structure and purity. The results obtained indicate that these compounds have good surface properties and good biocidal effect on broad spectrum of micro organisms.
Introduction
Cationic surfactants are used for quite different purposes than anionic surfactants. They have a greater affinity for various surfaces and could play an important role in the textile industry. Surfactants are usually employed for wetting or emulsifying and it has been reported by many investigators [1–3] that cationic surfactants, especially those having quaternary ammonium groups, display these activities. Quaternary ammonium salts also show biocidal properties [4]. Surfactant metal complexes are expected to provide a wide range of interesting phenomena on aggregation in aqueous solution due to variations in charge numbers, size and extent of hydrophobicity through combination of the central metal and ligands [5]. However, their physical properties in solution have not been studied extensively [6–9].
Metalloaggregates are made of surfactants that combine a metal-coordinating polar head with a hydrophobic tail [10]. Surfactants micellize in solution after the critical micelle concentration (CMC) is reached, depending on their molecular structure and the environmental conditions [11].
The antimicrobial action of cationic surfactants is based on their ability to disrupt and disorganize the integral bacterial membrane by combined hydrophobic and electrostatic adsorption phenomena at the membrane–water interface [12].
The cell membrane of pathogenic bacteria is predominantly negatively charged as compared with eukaryotic cells [13]. Hence, the positive charge of the cationic amphiphile facilitates their interaction with the bacterial membrane.
This study aimed to prepare some novel metallocationic surfactants based on naphthalene, and to determine their surface properties including the CMC, the maximum surface excess (Γmax), and the minimum surface area (A min), as well as their efficiency (PC20) and effectiveness (πCMC).
Experimental Procedure
Materials
The chemicals used in this study were of pure grade from Aldrich and were used without further purification. The solvents used were of pure grade.
Synthesis
-
(A)
Piperidine-1-yl methyl naphthalene (Ib) was synthesized by refluxing 1-chloromethyl naphthalene (Ia) (1 mol) and piperidine (4 mol) for 6 h in benzene (30 ml).
-
(B)
Dipiperidine-1-yl dimethyl naphthalene (IIb) was synthesized by refluxing 1,5-bis- dichloromethyl naphthalene (IIa) (1 mol) and piperidine (4 mol) for 6 h in benzene (30 ml).
-
(C)
Dipyridine- 4, 4′-yl -1,5 bis-disulphonamide naphthalene (IIIb) was synthesized by refluxing 1,5 disulphony dichloride naphthalene (IIIa) (1 mol), 4-amino pyridine (2 mol) and pyridine (2 mol) for 4 h in ethanol (30 ml).
The reaction mixtures were left to cool then filtered.
-
(D)
Quaternary ammonium compounds were synthesized by refluxing 1 mol of (Ib), (IIb) and (IIIb) with 1, 2 and 2 mol dodecyl bromide (R), respectively, in ethanol for 12 h. The solid product was filtered off and recrystallized from ethanol to obtain the cationic surfactants N-methyl naphthalene—N-dodecyl pipyridinium bromide (Ic), N, N′-1,5 bis dimethyl naphthalene—N, N′-didodecyl dipipyridinium bromide (IIc) and 4,4′-1,5 bis disulfonamide naphthalene—N, N′-didodecyl dipyridinium bromide (IIIc), respectively.
-
(E)
Metal complexes (metallosurfactants) were synthesized by refluxing 2, 1 and 1 mol of (Ic), (IIc) and (IIIc) in ethanol, respectively, with 1 mol of each of stannous chloride (SnCl2⋅2H2O) and cobalt chloride (CoCl2⋅6H2O) in ethanol, respectively to obtain metal complexes M, N, X, Y, A and B, respectively (Schemes 1, 2; Figs. 1, 2). And metal complex Z was obtained by refluxing 1 mol of (IIc) in ethanol with half a mole each of stannous chloride and cobalt chloride in ethanol (Fig. 3).
Scheme 1 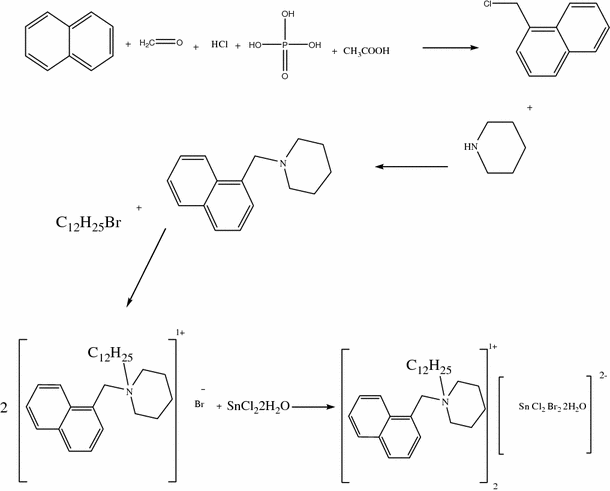
Chloromethylation of naphthalene to produce complex (M)
Scheme 2 
Chlorosulphonation of naphthalene to produce complex (A)
Fig. 1 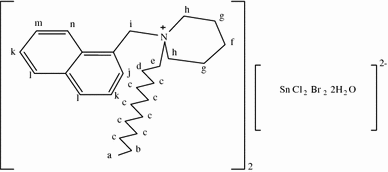
Complex (M), N-methyl naphthalene-N-dodecyl pipyridinium dibromo-dichloro tinate complex
Fig. 2 
Complex (A), 4, 4′-1,5 bis disulfonamide naphthalene-N, N′-didodecyl pyridinium dibromo-dichloro tinate complex
Fig. 3 
Complex (Z),N, N′-1, 5 bis dimethyl naphthalene–N, N′-didodecyl pipyridinium dibromo-dichloro tinate-cobaltate complex


Structural Confirmation of the Prepared Compounds
The chemical structure of the synthesized compounds was characterized as follows. Elemental analysis of the obtained surfactants was carried out using an Elemental Analyzer Model Varioelemenrar. The measurements were carried out at the Micro Analytical Center, Faculty of Science, Cairo University. Fourier transform infrared (FTIR) spectra were obtained using an ATI Mattsonm Infinity series™, Bench top 961 controlled by Win First™ V2.01 software (Egyptian Petroleum Research Institute). 1HNMR was measured in DMSO-d6 in a Spect Varian, GEMINI 200 (1H 200 MHz). (Micro Analytical Center, Cairo University, Egypt).
Evaluation Method of Surface Active Properties
Surface and Interfacial Tension
Surface and interfacial tension of solutions of the prepared compounds were measured using Du-Nouy Tensiometer (Krüss type 6). The surface tension of different concentrations ranging from 5 × 10⁻² to 1 × 10⁻³ mol/L was measured at different temperatures (25, 35 and 45 °C). The interfacial tension between 0.1% surfactants solution and light paraffin oil was also measured at 25 °C.
Emulsification Power
Emulsification power of the synthesized surfactants was measured by vigorous shaking of 10 ml surfactant solution (0.1%) and 10 ml paraffin oil for 5 min at 25 °C. The emulsification power was expressed as the time required for separation of 9 ml pure water.
Surface Parameters of the Prepared Compounds
Critical Micelle Concentration
The CMC values of the prepared compounds were determined using surface tension techniques, i.e., the surface tension measurements were plotted against the logarithm of the surfactant concentration. As is usual, the interrupt change in the curve slope is taken as the CMC.
Effectiveness
Effectiveness (πCMC) is the difference between the surface tension of pure water (γo) and the surface tension of the surfactant solution (γ) at the CMC.
Efficiency
Efficiency (PC20) is determined by the concentration (mol/L) of the surfactant solution capable of suppressing the surface tension by 20 dyne/cm.
Maximum Surface Excess
The values of the maximum surface excess (Γmax) calculated from surface or interfacial data by the use of Gibbs equation [14].
where
- Γmax :
-
maximum surface excess in mole/cm2
- R:
-
universal gas constant 8.31 × 10⁷ ergs mole−1 K−1
- T:
-
absolute temperature (273.2 + °C)
- δγ:
-
surface pressure in dyne/cm
- C:
-
surfactant concentration
- (δγ/δlog C)T :
-
is the slope of a plot surface tension versus −log concentration curves below CMC at constant temperature
Minimum Surface Area
The area per molecule at the interface provides information on the degree of packing and the orientation of the adsorbed surfactant molecule. The average minimum surface area (A min; in square angstrom) occupied by each molecule adsorbed on the interface [15] is given by:
- Γmax :
-
maximum surface excess in mole/cm2
- N :
-
Avogadro’s number
Thermodynamic Parameters of Micellization and Adsorption
The thermodynamic parameters of adsorption and micellization of the synthesized cationic surfactants were calculated according to Gibb’s adsorption equations as follows [16]:
Antimicrobial Activity of the Prepared Compounds
The antimicrobial activity of the prepared metallocationic surfactants (M, N, X, Y, Z, A and B) was measured individually using the diffusion agar technique against a wide range of microorganisms previously isolated in the Biotechnology Laboratory of the EPRI from different oil polluted environments using a dose equal to 5 mg/l.
The microorganisms include Gram-positive bacteria (Staphylococcus gallinarum NK1, Bacillus maroccanus I.1.1.3 and Brevibacterium casei I.2.1.7), Gram-negative bacteria (Pseudomonas synxantha I.1.1.1), yeast (Candida parapsilosis NSh45) and fungi (Aspergillus terreus I.1.3.1).
The antimicrobial activity of some of the synthesized compounds at different doses (800; 1,000; 1,200 ppm) was measured against sulfate reducing bacteria (SRB) using the dilution method.
Results and Discussion
Chemical Structure
The chemical structure of the prepared cationic surfactants was confirmed by elemental analysis, and their FTIR and 1HNMR spectra.
Elemental Analysis
As shown in Table 1, there is very close agreement between the theoretical and experimental values of microanalysis, meaning that these products are rather pure, and their work up was done properly.
FTIR Spectra
FTIR spectroscopy was used to identify the functional groups of prepared metallocationic surfactants. The FTIR spectra of complex M showed an absorption band at 778 cm−1 corresponding to adjacent H atom of naphthalene, and absorption bands at 1,450 cm−1 and 2,847 cm−1 corresponding to CH aliphatic asymmetric bending and symmetric stretching, respectively. An absorption band at 2,920 cm−1 corresponds to ammonium ion (R4N+; Fig. 4). The FTIR spectrum of complex Z showed an absorption band at 720 cm−1 corresponding to the adjacent H atom of naphthalene, and absorption bands at 1,455 cm−1 and 2,851 cm−1 corresponding to CH aliphatic asymmetric bending and symmetric stretching, respectively. An additional absorption band at 2,922 cm−1 corresponds to ammonium ion (R4N+; Fig. 5).

Fourier transform infrared (FTIR)-spectrum of the metallocationic surfactant complex M

FTIR-spectrum of the metallocationic surfactant complex Z
The FTIR spectra of complex A showed an absorption band at 758 cm−1 corresponding to adjacent H atom of naphthalene, and an absorption band at 1,189 cm−1 corresponding to the SO2-NH group. An additional absorption band at 2,927 cm−1 corresponds to ammonium ion (R4N+; Fig. 6).

FTIR-spectrum of the metallocationic surfactant complex A
1HNMR Spectra
1HNMR spectra of complex M showed signal triplet at δ = 0.87 ppm for (Ha), sextet at δ = 0.9 ppm for (Hb), quintet at δ = 1.29 ppm for (Hc), quintet at δ = 1.8 ppm for (Hd), triplet at δ = 3.07 ppm for (He), quintet at δ = 1.29 ppm for (Hf), quintet at δ = 2.56 ppm for (Hg), triplet at δ = 3.44 ppm for (Hh), singlet at δ = 4.83 ppm for (Hi), doublet at δ = 7.1 ppm for (Hj), triplet at δ = 7.65 ppm for (Hk), doublet at δ = 7.93 ppm for (Hl), doublet at δ = 8.09 ppm for (Hm) and triplet at δ = 8.44 for (Hn) (Fig. 7).

1H-NMR-Spectrum of the metallocationic surfactant complex M
1HNMR spectra of complex Z showed signal triplet at δ = 0.85 ppm for (Ha), sextet at δ = 1.1 ppm for (Hb), quintet at δ = 1.24 ppm for (Hc), quintet at δ = 1.7 ppm for (Hd), triplet at δ = 3 ppm for (He), quintet at δ = 1.24 ppm for (Hf), quintet at δ = 2.56 ppm for (Hg), triplet at δ = 3.79 ppm for (Hh), singlet at δ = 4.7 ppm for (Hi), doublet at δ = 7.61 ppm for (Hj), triplet at δ = 7.85 ppm for (Hk) and doublet at δ = 8.02 ppm for (Hl) (Fig. 8).

1H-NMR-Spectrum of the metallocationic surfactant complex Z
1HNMR spectra for complex A showed signal triplet at δ = 0.85 ppm for (Ha), sextet at δ = 1.24 ppm for (Hb), quintet at δ = 1.53 ppm for (Hc), quintet at δ = 1.49 ppm for (Hd), triplet at δ = 2.53 ppm for (He), doublet at δ = 8.9 ppm for (Hf), doublet at δ = 6.8 ppm for (Hg), singlet at δ = 4.6 ppm for (Hh), doublet at δ = 8.1 ppm for (Hi), triplet at δ = 7.4 ppm for (Hj) and doublet at δ = 7.5 ppm for (Hk) (Fig. 9).

1H-NMR-spectrum of the metallocationic surfactant complex A
Surface Properties
Surface and Interfacial Tension
Surface Tension
The surface tension of aqueous solutions of the prepared metallocationic surfactant with different concentrations (0.05, 0.025, 0.01, 0.005, 0.0025, 0.00125 and 0.001 mol/L) and at different temperatures (25, 35 and 45 °C) was measured. The data are represented in surface tension-concentration curves as shown in Figs. 10, 11, and 12. It is clear that surface tension decreases with increasing concentration due to increasing migration of the surfactant molecules from the bulk to the interface of the solution. The figures also show that surface tension values decrease as the temperature increases from 25 to 45 °C; this is because the surfactants become less soluble due to dehydration of the hydrophobic chain as the temperature increases.

Surface tension versus −log concentration of complexes at 25 °C

Surface tension versus −log concentration of complexes at 35 °C

Surface tension versus −log concentration of complexes at 45 °C
The surface tension values of the cationic complexes (M, N, X, Y, Z, A and B) are expected to have lower values than the parent cationic surfactants (Ic, IIc and IIIc). This is possible because of the increase in the hydrophobicity of these complexes in comparison to the parent cationics, which is due to the presence of two ligands coordinated to the metal-ion-like (M and N) complexes, i.e., more non-polar chains. Interactions between the water/surfactant molecules increase, which forces them to the air–water interface [17]. Hence, the surface tension was depressed considerably. Also, the presence of two alkyl chains in one molecule linked by a metal-ion-like (X, Y, Z, A and B) complex enhances the adsorption and aggregation properties by strengthening inter- or intra-molecular hydrophobic interactions [18], i.e., the complexes adsorb more efficiency at air/water interfaces than their parent salts. So, the structures of the synthesized surfactants play an important role in their surface properties.
The higher number of uniqueness of the metal–surfactant coordination complexes lies in the fact that the bond between the head group and the tail part of the surfactant is a coordinate bond, and the surfactant contains a higher charge on the head group, which leads to more repulsion in the bulk of the aqueous solution and thus increasing adsorption onto the surface.
Interfacial Tension
The interfacial tension of the oil/0.1% surfactant systems at (25 °C) was measured (Table 2). It is clear from the data that the synthesized surfactants (M, N, X, Y, Z, A and B) have good interfacial tension values against paraffin oil. Also, the lower values of the interfacial tension indicate the potential to use these surfactants in several applications as corrosion inhibitor and biocides.
Emulsion Stability
The emulsifying power of the prepared cationic surfactants (M, N, X, Y, Z, A and B) is listed in Table 2 as a function of time. All the prepared cationic surfactants have, in general, low emulsion stability as a function of time, so that these surfactants cannot be used as long-term emulsion stabilizers.
Critical Micelle Concentration
CMC values of the prepared metallocationic surfactants were determined by plotting the surface tension (γ) of surfactant solutions versus their bulk concentrations in mole/L at 25 °C, 35 °C and 45 °C. The CMC values listed in Tables 3, 4 and 5 show a decrease in CMC with increasing temperature and number of hydrophobic chains. The rise in temperature probably decreases the hydration of the hydrophilic group, favoring micellization. On the other hand, a rise in temperature causes disruption of the structured water surrounding the hydrophobic group, an effect that disfavors micellization. The relative magnitude of these two opposing effects determines whether the CMC increases or decreases over a particular temperature range. The data in Tables 3, 4 and 5 reveal that CMC decreases with rising temperature, i.e., micellization is enhanced.
Increasing the number of hydrophobic chains decreases the solubility and consequently increases the free energy of the system, leading to concentration of the surfactant molecules at the surface and formation of micelles.
Effectiveness
The most efficient surfactant is one that gives the greatest lowering in surface tension for a given CMC. According to the results of the effectiveness (ПCMC) shown in Tables 3, 4 and 5, complex Y was found the most effective at 25 °C, with a reduction of 38.4 mN/m at CMC. Complexes M and Y were very close in terms of effectiveness, being most effective at 35 °C, with 41.62 and 41.17 dyne/cm, respectively. Complex M achieved the best effectiveness at 45 °C, with 42.4 dyne/cm.
Efficiency
Efficiency (Pc20) values of the prepared metallocationic surfactants are given in Tables 3, 4 and 5. From these data it was observed that increasing the number of alkyl chains and temperature together produce a decrease in efficiency. This is due to the fact that the efficiency of adsorption at interfaces increases linearly with an increase in the number of carbon atoms in the hydrophobic group and temperature.
Maximum Surface Excess
The values of Γmax are represented in Tables 3, 4 and 5. Γmax increases by increasing the number of hydrophobic chains on the head group or by the presence of two ligands (depending on the metal ion) due to the increase of the interaction with the water phase so the surfactant molecules are directed to the interface, which decreases the surface energy of the solution.
Minimum Surface Area
The minimum area per molecule at the aqueous solution/air interface for the prepared surfactants is listed in Tables 3, 4 and 5. The minimum surface area (A min) decreases with an increase in the number of hydrophobic chains in the surfactant molecules due to the higher accumulation of these molecules at the interface and a smaller available area per molecule.
Standard Free Energies of Micellization and Adsorption
From Tables 6 and 7 values of the standard free energies of micellization and adsorption (ΔG omic , ΔG oads ) are always negative, indicating that these two processes are spontaneous; however, there is a greater increase in the negative value of ΔG ads compared to those of micellization. This suggests the tendency of the molecules to be adsorbed at the interface.
Antimicrobial Activity of the Prepared Compounds
It is well known that the activity toward a variety of bacterial species for numerous structural variations of a lot of cationic surfactants is optimal when the carbon chain length is between 10 and 14 atoms [19–23]. The antimicrobial activity results of the prepared compounds are in Table 8. The results indicate that the synthesized metallosurfactants have good antimicrobial activity, and the differences in their activity depend on the structure of the complex.
When the cationic site of the surfactant binds to the anionic sites of the cell wall surface, the surfactant molecules are able to diffuse through the cell wall then disrupt the membrane and permit the release of electrolytes and nucleic materials, leading to cell death. The membrane activity of the surfactants depends on the character of the polar head groups (size and electric charge distribution) and hydrocarbon chains (length, number, saturation and multiple chains).
The antimicrobial activity of the synthesized biocides (X, Y and Z) against SRB was determined by dilution method and the results are listed in Table 9.
The results indicate that the synthesized metallocationic surfactants have antimicrobial activity against the tested organisms (SRB), and that their activity depends on their chemical structure, mainly the number of hydrophobic chains and the length and type of metal.
References
Koshy LL, Pegiadou-Koemtjopoulou S, Rakshit AK (1991) Thermodynamics of micellization of some new pyridinium cationic surfactants. Colloids Surf 59:1–6
Fisicaro EE, Pelizzetti M, Barbier P, Savarino G, Viscardi R (1990) Aqueous micellar of some N-alkyl nicotinamide and N-N-alkyl pyridinium halide surfactants and partial molar enthalpies. Thermochim Acta 168:43–59
Gad E, El-Sukkary EM, Azzam E (1997) Surface and thermodynamic studies of N-(octyl, dodecyl, and cetyl) oxycarbonyl methyl pyridinium bromide. Monatshafte Chemie 128:1237–1246
Badawi AM, El-Marazibanl MM, Haroun B, Soliman H (1983) Quaternary ammonium salts of potential biological activity. Curr Sci 52:1169–1171
Sierra T (1996) Low molecular weight lyotropic metallomesogens. In: Serrano JL (ed) Metallomesogens, chap 2. VCH, Weinheim
Iida M, Yonezawa A, Tanaka A (1997) A novel reverse micellar system composed of bis (octylethylenediamine) zinc (II) chloride in aqueous benzene and chloroform solutions. J Chem Lett 26:663–664
Iida M, Sakai T, Koine N, Kaizaki S (1993) Anisotropic aggregation of A 1, 10-phenanthroline dinuclear chromium (III) complex bridged by two l-tartrates in aqueous solution. J Chem Soc Faraday Trans 89:1773–1778
Iida M, Yamamato M, Fujita N (1996) Multinuclear NMR studies on micellar formation of aqueous [Co(N-octyl- or N-dodecyl ethylene diamine)(3, 7-diazanonane-1, 9-diamine)]3, solutions. Bull Chem Soc Jpn 69:3217–3224
Jaeger DA, Reddy VB, Arulsamy N, Bohle DS, Grainger DW, Berggren B (1998) Micellization model for multivalent ionic surfactants. Langmuir 14:2589–2592
Menger FM, Gan LH, Johnson E, Durst DH (1987) Phosphate ester hydrolysis catalyzed by metallomicelles. J Am Chem Soc 109:2800–2803
Moulik SP (1996) Micelles: self-organized surfactant assemblies. Curr Sci 71:368–376
McDonnell G, Russell AD (1999) Antiseptics and disinfectants: activity, action, and resistance. Clin Microbiol Rev 12:147–179
Oren Z, Hong J, Shai YJ (1997) A repertoire of novel antibacterial diastereomeric peptides with selective cytolytic activity. Biol Chem 272:14643–14649
Takeshita T, Shimohara T, Maeda S (1982) Synthesis of EDTA monoalkyl amide chelates and evaluation of the surface-active properties. J Am Oil Chem Soc 59:104–107
Shuichi M, Kazayasu I, Sadao Y, Kazuo K, Tsuyoshi Y (1990) Surface activities, biodegradability and antimicrobial properties of n-alkyl glucosides, mannosides and galactosides. J Am Oil Chem Soc 67:996–1001
Rosen MJ (1987) Surfactants and interfacial phenomena. Wiley, New York, p 72
Gad EAM, El-Sukkary MMA, Ismail DA (1997) Surface and thermodynamic parameters of sodium N-acyl sarcosinate surfactant solutions. J Am Oil Chem Soc 74:43–47
Lourdes P, Josep LT, Angeles M, Conxitra S, Rosa MI (1996) Synthesis and biological properties of a new class of gemini cationic amphiphilic compounds from arginine. Langmuir 12:5296–5301
Nagamune H, Maeda T, Ohkura K, Yamamoto K, Nakajima M, Kourai H (2000) Evaluation of the cytotoxic effects of bis–quaternary ammonium antimicrobial reagents on human cells. Toxicol In Vitro 14:139–147
Birnie CR, Malamud D, Schnaare RL (2000) Antimicrobial evaluation of N-alkyl betaines and N-alkyl-N, N dimethyl amine oxides with variations in chain length. Am Soc Microbiol 44:2514–2517
Viscardi G, Quagliotto P, Barolo C, Savarino P, Barni E, Fisciaro E (2000) Synthesis and surface and antimicrobial properties of novel cationic surfactants. J Org Chem 65:8197–8203
Pernak J, Kalewska J, Ksycinska H, Cybulski J (2001) Synthesis and antimicrobial activities of some pyridinium salts with alkoxymethyl hydrophobic group. Eur J Med Chem 36:899–907
Campanac C, Pineau L, Payard A, Baziard-Mouysset G, Roques C (2002) Interactions between biocide cationic agents and bacterial bioflms. Antimicrob Agents Chemother 46:1469–1474
Open Access
This article is distributed under the terms of the Creative Commons Attribution Noncommercial License which permits any noncommercial use, distribution, and reproduction in any medium, provided the original author(s) and source are credited.
Author information
Authors and Affiliations
Corresponding author
Rights and permissions
This article is published under an open access license. Please check the 'Copyright Information' section either on this page or in the PDF for details of this license and what re-use is permitted. If your intended use exceeds what is permitted by the license or if you are unable to locate the licence and re-use information, please contact the Rights and Permissions team.
About this article
Cite this article
Aiad, I.A., Badawi, A.M., El-Sukkary, M.M. et al. Synthesis and Biocidal Activity of Some Naphthalene-Based Cationic Surfactants. J Surfact Deterg 15, 223–234 (2012). https://doi.org/10.1007/s11743-011-1286-z
Received:
Accepted:
Published:
Issue Date:
DOI: https://doi.org/10.1007/s11743-011-1286-z