
Abstract
This investigation was initiated to provide governing equations for crack initiation, crack growth, and service life prediction of pipeline steels in near-neutral pH (NNpH) environments. This investigation develops a predictive model considering loading interactions occurring during oil and gas pipeline operation with underload-type variable pressure fluctuations. This method has predicted lifetimes comparable to the actual service lives found in the field. This is in sharp contrast with the predictions made by existing methods that are either conservative or inconsistent with the field observations. It has been demonstrated that large slash loads (R-ratio is 0.05), often seen during gas pipeline operation, are a major life-limiting factor and should be avoided where possible. Oil pipelines have shorter lifetime because of their more frequent pressure fluctuations and larger amplitude load cycles. The accuracy of prediction can be improved if pressure data with appropriate sampling intervals are used. The sampling interval error is much larger in the prediction of oil pipelines than gas pipelines because of their different compressibility but is minimized if the pressure sampling rate for the data is at or less than one minute.


References
J.X. Zhao, W.X. Chen, M.S. Yu, K. Chevil, R. Eadie, G. Van Boven, R. Kania, J. Been, and S. Keane: Metall. Mater. Trans. A. DOI:10.1007/s11661-016-3951-3.
W. X. Chen, R. Kania, R. Worthingham and G. Van Boven: Acta Mater., 2009, vol. 57, pp. 6200-6214.
S.B. Lambert, J.A. Beavers, B. Delanty, R. Sutherby, and A. Plumtree: Proceedings of 3rd International Pipeline Conference, Calgary, 2000, pp. 961–65.
J.A. Beavers, Near-Neutral pH SCC: Dormancy and Re-Initiation of Stress Corrosion Cracks, GRI report #: GRI-7045, August 2004.
T. S. Srivatsan and T. S. Sudarshan: J. Mater. Sci., 1988, vol. 23, pp.1521-1533.
J.F. Kiefner, and K.M. Kolovich: Predicting Times to Failure for ERW Seam Effects that Grow by Pressure-Cycle-Induced Fatigue, Final Report as the Deliverable of Subtask 2.5 on U.S. Department of Transportation, Other Transaction Agreement NO. DTPH56-11-T-000003, Final Report No. 13-021, January, 28, 2013.
Y.H. Zhang and S.J. Maddox: Int. J. Fatigue, 2009, vol. 31, pp. 138-152.
J.X. Zhao, K. Chevil, M.S. Yu, J. Been, S. Keane, G. Van Boven, R. Kania, and W.X. Chen: J. Pipeline Syst. Eng., 04016007, 2016.
J.X. Zhao, W.X. Chen, S. Keane, J. Been, and G. Van Boven: Proceedings of the 2014: 10th International Pipeline Conference IPC2014, September 29–October 3, 2014, Calgary, Alberta, Canada.
B. S. Delanty and J. O’Beirne: Oil Gas J., 1992, vol. 15, pp. 39-44.
T. Kushida, K. Nose, H. Asahi, M. Kimura, Y. Yamane, S. Endo, and H. Kawano: Proceedings of Corrosion 2001. NACE, Houston (TX), 2001. Paper No. 01223.
S. H. Wang, W. X. Chen, F. King, T. R. Jack, R. R. Fessier: Corrosion, 2002, vol. 58, pp. 526-534.
B. Y. Fang, R. L. Eadie, W. X. Chen and M. Elboujdaini: Corros. Eng. Sci. Tech., 2009, vol. 44, pp. 32-42.
B.Y. Fang, R. L. Eadie, W. X. Chen and M. Elboujdaini: Corros. Eng. Sci. Tech., 2010, vol. 45, pp. 302-312.
Z. Qin, B. Demko, J. Noel, D. Shoesmith, F. King, R. Worthingham and K. Keith: Corrosion, 2004, vol. 60, pp. 906-914.
J.A. Beavers, J.T. Johnson, R.L. Sutherby: Proceedings of 3th International Pipeline Conference, vol. 2, Calgary, Canada, October 1–5, 2000, pp. 979–88.
G. Van Boven, W.X. Chen and R. Rogge: Acta Mater., 2007, vol. 55, pp. 29-42.
B.T. Lu, and J.L. Luo: Corrosion, 2006, vol. 62, pp. 129-140.
W. Zheng, D. Bibby, J. Li, J.T. Bowker, J.A. Gianetto, R.W. Revie, and G. Williams: Proceedings of 6th International Pipeline Conference, September 25–29, 2006, p. 95.
B. Fang, E. H. Han, J. Wang, W. Ke: Corrosion, 2007, vol. 63, pp.419-432.
F. King, T. Jack, W.X. Chen, and S.H. Wang: Corrosion, 2001, NACE International, 11–16 March, Houston, Texas.
M.S. Yu, X. Xing, H. Zhang, J.X. Zhao, R. Eadie, W.X. Chen, J. Been, G. Van Boven and R. Kania: Acta Mater., 2015, vol. 96, pp.159-169.
W.X. Chen and R. L. Sutherby: Metall. Mater. Trans. A, 2007, vol. 38A, pp. 1260-1268.
X. Xing, W. X. Chen and H. Zhang: Mater. Lett., 2015, vol.152, pp. 86-89.
M. Skorupa: Fatigue Fract. Eng. Mater. Struct., 1998, vol. 21, pp.987-1006.
M. Skorupa: Fatigue Fract. Eng. Mater. Struct., 1999, vol. 22, pp. 905-926.
R.H. Christensen, Fatigue crack, fatigue damage and their directions, Metal Fatigue, McGraw-Hill, New York, 1959.
N.A. Fleck: Influence of stress state on crack growth retardation, Basic Questions on Fatigue, 1988, vol. 1, ASTM STP 924, pp. 157–83.
N.A. Fleck: Acta Metall., 1985, vol. 33, pp.1339-1354.
J. Schijve and D. Broek: Aircra. Eng. Aerosp. Tec., 1962, vol. 34, pp.314-316.
O.E. Wheeler: J. Basic Eng., 1972, vol.94, pp.181-186.
J. Willenborg, R.M. Engle, and H.A. Wood: A crack growth retardation model using an effective stress concept, Report # AFFDL-TR71-1, Air Force Flight Dynamic Laboratory, Wright-Patterson Air Force Base, USA, 1971.
S.L. Ouk and Z. W. Chen: I. J. Korean Soc. Precis. Eng., 2002, vol.3, pp.72-77.
S. H. Wang and W. X. Chen: Mater. Sci. Eng. A, 2002, vol. 325, pp.144-151.
S. H. Wang, Y. G. Zhang and W. X. Chen: J. Mater. Sci., 2001, vol. 36, pp.1931-1938.
S. H. Wang and W. X. Chen: Mater. Sci. Eng. A, 2001, vol. 301, pp.147-153.
C. D. Beachem: Met. Trans., 1972, vol. 3, pp.437-451.
P. J. Ferreira, I. M. Robertson and H. K. Birnbaum: Acta Mater., 1999, vol. 47, pp. 2991-2998.
T. M. Ahmed, S. B. Lambert, R. Sutherby and A. Plumtree: Corrosion, 1997, vol. 53, pp. 581-590.
G. Van Boven, R. Sutherby, and F. King: Proceedings of 4th International Pipeline Conference, Sep 29–Oct 3, 2002, Calgary, Canada, IPC2002-27149.
J. Schijve: Fatigue of Structures and Materials: Second Edition with CD-ROM, Springer, Dordrecht, 2009.
Standard practices for cycle counting in fatigue analysis, ASTM, E1049-85 (2011) e1.
J. Been, H. Lu, F. King, T. Jack, and R. Sutherby: Proceedings of Second International Conference on Environment-Induced Cracking of Metals (EICM-2), Banff, AB, September 20–23, Elsevier, 2004.
J. Been, R. Eadie, and R. Sutherby: Proceedings of the 2006 6th International Pipeline Conference IPC2006, September 25–29, Calgary, Alberta, Canada, IPC2006-10345.
A.T. Egbewande: Growth behavior of surface cracks in pipeline steels exposed to near-neutral pH environments. PhD thesis, University of Alberta, 2013.
J. X. Zhao, W. X. Chen, K. Chevil, J. Been, G. Van Boven, S. Keane and R. Kania: Effect of pressure sampling methods on pipeline integrity analysis. J. Pipeline Syst. Eng., Minor Revision, 2016.
M. Yu: Crack growth behavior of pipeline steels under variable pressure fluctuations in a near-neutral pH environment, PhD thesis, University of Alberta, 2015.
M. S. Yu et al. (unpublished data).
Acknowledgments
The authors would like to thank TransCanada Pipeline Limited, Spectra Energy Transmission, Natural Science and Engineering Research Council of Canada, the Pipeline Research Council International (PRCI), and US Department of Transportation for financial support.
Author information
Authors and Affiliations
Corresponding author
Additional information
Manuscript submitted January 27, 2016.
Appendix 1: Governing Equations Used in Life Prediction
Appendix 1: Governing Equations Used in Life Prediction
1.1 Algorithm
-
1.
The 1st step of raw data analysis is to define the stress intensity factor range threshold for minor cycles. This is set to be 0.59 \( {\text{MPa}}\sqrt {\text{m}} \), below which crack is considered to be non-propagating.[22,47]
-
2.
The 2nd step is to determine the underload cycles, which is defined as those cycles with a stress intensity factor range threshold larger than or equal to 3.3 \( {\text{MPa}}\sqrt {\text{m}}. \)[22,47]
-
3.
The 3rd step is to divide a spectrum into cycle blocks, each of which is composed of one underload cycle and all the minor cycles before the next underload cycle.
-
4.
Use the code to further characterize a spectrum to obtain the following parameters:
-
a.
Loading and unloading frequency of each underload cycle.
-
b.
K max and ΔK of the loading cycle in an underload cycle.
-
c.
K max and ΔK of each minor cycle within a block.
-
d.
The number of minor cycles within a block.
-
a.
-
5.
Computation of crack growth acceleration factor induced by different variables:
-
(1)
\( f \)is lower than \( 10^{ - 3} \;Hz \)[22]:
$$ \begin{aligned} \Delta {\text{a}}\; & { = }\;\sum\limits_{i = 1}^{k} {F^{i} (cp)} \cdot F^{i} (unload) \cdot F_{\hbox{max} }^{i} \\ & \cdot \left\{ {F_{af}^{i} (\Delta K_{ul} ,\Delta K_{mc} ,n)_{{f = 10^{ - 3} }} \cdot \left\{ {A \cdot \left[ {\frac{{K_{\hbox{max} ul}^{0.33} \cdot \Delta K_{ul}^{0.67} }}{{(10^{ - 3} )^{0.033} }}} \right]^{m} } \right\}_{i} } \right\}. \\ \end{aligned} $$(A.1) -
(2)
\( f \)is larger than \( 10^{ - 3} \;Hz \)[22]:
$$ \begin{aligned} \Delta {\text{a}}\; & { = }\;\sum\limits_{i = 1}^{k} {F^{i} (cp)} \cdot F^{i} (unload) \cdot F_{\hbox{max} }^{i} \\ & \cdot \left\{ {F_{af}^{i} (\Delta K_{ul} ,\Delta K_{mc} ,n)_{{f = 10^{ - 3} }} \cdot \left\{ {A \cdot \left[ {\frac{{K_{\hbox{max} ul}^{0.33} \cdot \Delta K_{ul}^{0.67} }}{{(f)^{0.033} }}} \right]^{m} } \right\}_{i} } \right\}. \\ \end{aligned} $$(A.2)
All the variables and constants are defined in Table AI and all the functions are obtained curve-fitting the experimental results obtained.
1.2 Model Parameters in Equations [A.1] and [A.2]
-
(1)
Combined factor model[23]:
$$ \Delta {\text{a}}\;{ = }\;A \cdot \left[ {\frac{{K_{\hbox{max} ul}^{0.33} \cdot \Delta K_{ul}^{0.67} }}{{(f)^{0.033} }}} \right]^{m} ,\;A = 6.8 \times 10^{ - 8} ,\;m = 2.73. $$(A.3) -
(2)
Factors induced by variable amplitude loadings[47]:
-
(a)
If loading frequency f is lower than or equal to \( 10^{ - 3} \;Hz \)
\( F(cp) \) is a factor reflecting the increased crack growth by cathodic protection as discussed in the text. It is assumed to be 5.0 for all the predictions made in the investigation unless it is specified otherwise. \( F(cp) \) was experimentally determined to vary from 1 for the open circuit potential to 8.12 for surface cracks tested under −0.9 V cathodic potential.
F(unload) is a factor reflecting the effect of asymmetrical loading waveform with the following values experimentally determined.[48]
$$ F(unload) = \left\{ \begin{aligned} 1.4,if\;unloading\;rate\;is\;higher\;than\;loading\;rate \hfill \\ 1,if\;unloading\;rate\;is\;lower\;than\;loading\;rate \hfill \\ \end{aligned} \right.. $$(A.4)F max is a correction factor to reflect the effect of K max under variable amplitude fatigue loading. It was applied for tests with K max higher or lower than 33\( {\text{MPa}}\sqrt {\text{m}} \). As shown in Figure A1(a)), the measured crack growth rate under variable amplitude fatigue loading is much higher than the predicted crack growth rate using Eq. [A.3],[23] which has not considered the effect of loading interactions.[47] Based on the results shown in Figure A1(b)), an acceleration factor, which is the ratio of the crack growth rate under variable amplitude fatigue loading over the crack growth predicted using Eq. [A.3], can be determined (black square symbol). From this, F max is defined as the ratio of the acceleration factor over the acceleration factor obtained from tests under K max = 33\( {\text{MPa}}\sqrt {\text{m}} \) (red circular symbol). The value of F max obtained was curve-fitted to yield the expression below.
$$ F_{\hbox{max} } = \left\{ \begin{aligned} 0.02667 \cdot K_{\hbox{max} ul} + 0.12,\;if\;K_{\hbox{max} ul} { < }33\;MPa\sqrt m \hfill \\ 1,\;if\;K_{\hbox{max} ul} \ge 33\;MPa\sqrt m \hfill \\ \end{aligned} \right.. $$(A.5)Fig. A1 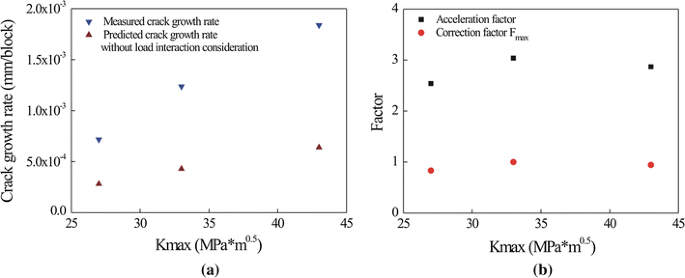
Dependence of crack growth rate on K max: (a) Measured and predicted crack growth rates[47]; (b) Crack growth acceleration caused by variable amplitude fatigue loading and the determination of F max
From Eq. [A.5], it is obvious that the correction factor is minimal and is needed only for tests with K max is less than 33 \( {\text{MPa}}\sqrt {\text{m}} \).
\( F_{af}^{i} \left( {\Delta K_{ul} ,\Delta K_{mc} ,n} \right) \), an acceleration factor related to the effect of ΔK ul, ΔK mc, and n for the ith of underload-minor cycle block, can be calculated as
$$ F_{af} \left( {\Delta K_{ul} ,\Delta K_{mc} ,n} \right)_{{f = 10^{ - 3} }} = \frac{{F_{af} \left( {\Delta K_{ul} ,\Delta K_{mc} } \right)_{n = 300} \cdot \left( {0.05553 \cdot n^{0.6335} + 0.9258} \right)}}{{F_{af} \left( {\Delta K_{ul} = 16,\Delta K_{mc} = 3.3} \right)_{n = 300} }} $$(A.6)$$ \begin{aligned} F_{af} \left( {\Delta K_{ul} ,\Delta K_{mc} } \right)_{n = 300} & = 0.286 \cdot \left( {1 + 0.8591 \cdot \left( {0.716 \cdot \Delta K_{mc} + 0.6136} \right)^{1.41} } \right) \\ & \cdot \left( {1 + 0.1608 \cdot \left( {29.82 \cdot \Delta K_{ul}^{( - 0.8645)} } \right)^{1.693} } \right). \\ \end{aligned} $$(A.7) -
(b)
If loading frequency f is higher than \( 10^{ - 3} \;Hz \)
F(cp), F max, and \( F_{af}^{i} (\Delta K_{ul} ,\Delta K_{mc} ,n) \) are calculated in the same way as in (a).
-
(a)

Rights and permissions
About this article

Cite this article
Zhao, J., Chen, W., Yu, M. et al. Crack Growth Modeling and Life Prediction of Pipeline Steels Exposed to Near-Neutral pH Environments: Stage II Crack Growth and Overall Life Prediction. Metall Mater Trans A 48, 1641–1652 (2017). https://doi.org/10.1007/s11661-016-3939-z
Received:
Published:
Issue Date:
DOI: https://doi.org/10.1007/s11661-016-3939-z