
Abstract
Security devices produce huge number of logs which are far beyond the processing speed of human beings. This paper introduces an unsupervised approach to detecting anomalous behavior in large scale security logs. We propose a novel feature extracting mechanism and could precisely characterize the features of malicious behaviors. We design a LSTM-based anomaly detection approach and could successfully identify attacks on two widely-used datasets. Our approach outperforms three popular anomaly detection algorithms, one-class SVM, GMM and Principal Components Analysis, in terms of accuracy and efficiency.
1 Introduction
The running state of the system is usually recorded in a log file, used for debugging and fault detection, therefore the log data is a valuable resource for anomaly detection. Log data is natural time series data, contents and types of events recorded by the log file also tend to be stable. Except for some highly covert apt attacks, most of the attacks are not instantaneous and have a fixed pattern, the log data will produce a pattern when recording malicious behaviors, which provides the possibility to detect anomaly from the log sequence.
The traditional methods rely on the administrator to manually analyze the log text. This kind of processes lead to a large number of human power costs, and requires the system administrator to understand the network environment and be proficient in system architecture.
However, in order to avoid tracking by the security administrator, the logs generated by attacks are getting similar to the logs generated by the normal access behaviors. In addition, because of the large variety of applications and services, each web node will generate a large number of logs, which results in the log data file becoming extremely large. It may not be possible to directly process these logs manually. These logs may contain signals of malicious behaviors, so it is necessary to use some anomaly detection methods for analysis.
The existing automatic methods of anomaly detection based on log data can be divided into two categories: supervised learning methods relying on tags, such as decision tree, LR, SVM and unsupervised learning methods based on PCA, clustering and invariant mining. Supervised learning has a very good effect in detecting known malicious behavior or abnormal state, but it cannot detect unknown attacks, as it depends on prior knowledge. Unsupervised method can be used to detect unknown exceptions, but most of the methods need to improve the accuracy.
A exists research introduced use concept of the longest common subsequence to reduce the number of matching patterns obtained during the calculation [1], enabling simple classification of logs. Besides, Xu et al. uses association rules, which are generated by trust scores, to mine frequent item sets, and then detects attack behavior based on the association rules [2]. Zhao et al. used a method based on character matching to study the classification of system log, and determined the correspondence between log type and character [3]. Seker. S.E et al. took the occurrence frequency of letters as key elements to recognize log sequence, abstracting different types of logs into different characters, and selects adaptive k-value according to their characteristics [4]. The existing research shows that there is a strong correlation between logs and their character composition.
This model is based on LSTM sequence mining, through data-driven anomaly detection method, it can learn the sequence pattern of normal log, and detect unknown malicious behaviors, identify red team attacks in a large number of log sequences. The model performs character-level analysis of the log text directly, so there is no need to perform excessive log processing, such as log classification, matching, etc., which greatly simplifies the calculation complexity.
However, there are still some problems in the current model. For instance, it only performs character level analysis, which may ignore some high-level features. A natural idea is to analyze the logs hierarchically, but research founds that this measure has not improved its performance [5], thus the relevant methods need further study. In addition, since no log correlation matching is performed, only abnormal log lines can be alerted, and the anomaly level of each user cannot be detected directly. A possible solution is to trace users through log entries that are determined to be abnormal, but obviously it is slightly verbose.
Contribution
Through joint efforts, after discussing the experimental together, Wenhao ZHOU completed the modification of LSTM code and training of the model, Jiuyao ZHANG completed the comparative experiments, and Ziqi YUAN completed the writing of the article.
The first section of this paper introduces the background, the goal of the model and the existing problems. The second section introduces the methods used in the model, including data processing methods, the specific structure of the LSTM network, and the adjustment of parameters. The third section compares this model with the methods in [5, 6] and illustrates the advantages. The fourth section introduces the experiment, including a detailed description of the data set, test indicators, and comparison results compared with other methods such as one-class SVM, GMM and PCA.
2 Anomaly Detection Approach
Our approach learns character-level behaviors for normal logs, processing a stream of log-lines as follows:
-
(1)
Initialize weights randomly
-
(2)
Train the model with log data of the first n days
-
(3)
For each day k (k > n) in chronological order, firstly based on model Mk − 1, which is trained by with log data of the first k-1 days, produce anomaly scores for all events in day k. Secondly, record per-user-event anomaly scores in rank order to analysts for inspection. Thirdly, update model Mk − 1 to Mk, as logs in day k are used.
2.1 Log-Line Tokenization
The network log cloud be obtained from many sources. The logs obtained from different sources are naturally generated in different formats and record different information. In order to expand the application scope of the model as much as possible, we consider each line of the logs as a string directly, and take the character-level data as the input of LSTM directly.
Since only printable characters are considered, whose range is from 0 × 20 to 0x7e, there are 95 characters in total. Convert each word into its corresponding ASCII and subtract 30, so we get 0 for the beginning and 1 for the end. Then fill the space with −1 to ensure the same length of each sequence for training. An example is shown in Fig. 1.

Example of processed features of LSTM model.
2.2 LSTM Model
In order to calculate the anomaly score of each record, we consider a calculation model for a single log line. RNN is a common tool to deal with that kind of data. Specifically, we use an LSTM network, whose input is the characters of each log line, so as to predict the probability distribution of the next character and infer the abnormal possibility of this log line, or the user account.
Bidirectional Event Mode (BEM)
For a log line with a character length of K, let x(t) be the character in position t, and h(t) be the hidden representation of the corresponding position of the character. According to the relevant theory of LSTM [7], we have the following relations
Among them, initial state h(0) and initial cell state c(0)are preset as zero vectors, bullet symbol denotes element-wise multiplication, and sigma represents logistic function with standard parameters, that is
Vector g represents the hidden value inferred from the current input and the previous hidden state. Vectors f, i, o are the standard forgetting gate, input gate and output gate in the LSTM model. Matrix W and deviation vector b are the parameters used in the model.
In addition, since we can get all the contents of a log line directly, and the characters in a certain position in a log line are obviously related to their context content, we build a bidirectional LSTM, or BiLSTM, which infers the character probability distribution in each position from the back to the front meanwhile. For this reason, we add a new set of hidden vectors hb(K + 1), hb(K)…hb(1), so the model could run the LSTM equations in reverse at the same time. The superscript b of reverse LSTM parameters shows its parameter matrix W.
The hidden value h is used to predict the characters in the new position, and the result is p, specifically, we have
Compared with the ordinary one-way LSTM, it is obvious that the hidden value h and matrix W of the reverse LSTM are added to the prediction function, which enables us to predict the character in a certain position through the positive and negative directions at the same time.
Finally, the cross-entropy loss is defined as
to update the weights. We train this model using stochastic mini-batch (non-truncated) back-propagation through time.
3 Related Work
The most relevant works are [5, 6].
Among them, [5] constructs a double-layer LSTM model for Knet2016 dataset. Its lower layer is composed of a LSTM network. On this basis, the hidden state of each token can be used as the feature of this line to get the type of log-line, and a LSTM model is constructed to complete the prediction of the next log-line type. However, the experimental results show that the double-layer structure does not improve the prediction performance, its metrics are lower than the simple single-layer model.
Due to the limitation of computing power, we have to used less data, so we did not build a double-layer LSTM model, but used a single-layer BiLSTM model, through which the characters that may appear can be predicted bidirectionally at the same time. On the one hand, this ensures the detection effect to a certain extent, on the other hand, it reduces the demand for computing power directly.
[6] discusses the value and potential problems of many logs in detail, and gives a new, comprehensive, real network security data overview. This paper enumerates some kinds of logs and counts word frequency and other information, but does not give a detailed and feasible processing method. Each kind of log has different format and reserved words. Even if we can make a detailed analysis, it is difficult to find a common and rapid method to make exception detection for different kinds of logs.
Therefore, it is necessary for us to conduct character level analysis and prediction, which can directly avoid the great differences between different logs, and because the normal log-line and anomaly log-line are obviously different in character level, it is guaranteed that this kind of method is correct.
4 Experimental Results
4.1 Data
We used the Los Alamos National Laboratory (LANL) cyber security dataset (Kent 2016), which collected event logs of LANL’s internal computer network for 58 consecutive days, with more than 1 billion log lines, including authentication, network traffic and other records. Fields involving privacy have been anonymous. Besides normal network activities, 30 days of red team attacks were recorded.
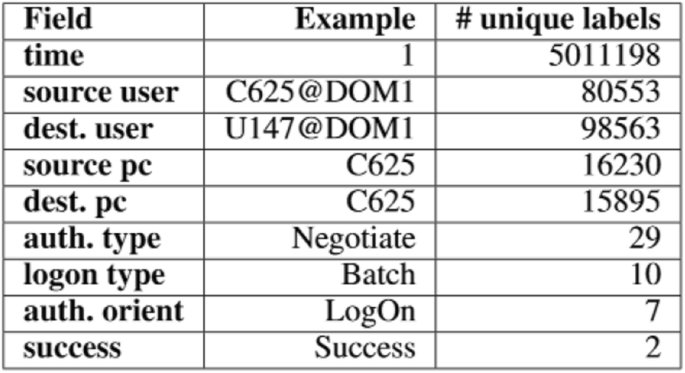
[5] gives some statistical descriptions, and the parts we use, which are the authentication event logs, are shown Table 1. We used 3,028,187 loglines in 20 days, the first 14 days for training, and the rest 6 days for testing, with 51 anomalous loglines and 26 anomalous user-days.
After tokenization, the length of all log lines is filled to 112.
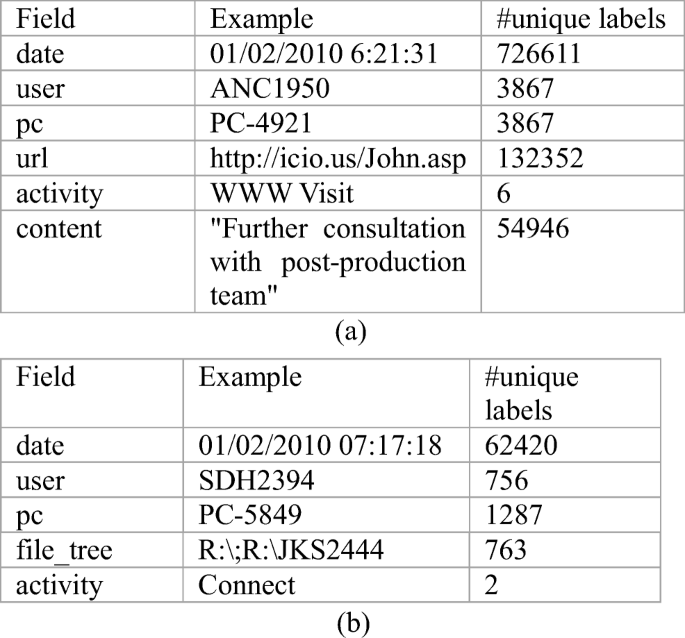
We also used insider thread test dataset (R6.2), which is a collection of synthetic insider thread test datasets that provide both background and malicious actor synthetic data. It covers device interaction, e-mail, file system and other aspects of the log content. We choose device access log and net access log to use in the experiments. The fields and statistics of net access log are summarized in Table 2a, while those of device access log are shown in Table 2b.
We used 1,676,485 loglines in 21 days, the first 14 days for training, and the rest 7 days for testing, with 530 anomalous loglines and 530 anomalous user-days.
In the process of tokenization, it is found that length of the loglines of net access dataset is up to 2500 characters. If all the lines are filled to such a long sequence, it will undoubtedly cost a very large amount of computation. Therefore, the URL column only extracts domain name, and the introduction column of the page extracts its key phrases through rake algorithm [8]. Finally, the length of the sequences is determined to be 830.
Timescale
For this work, we consider the following timescales.
First of all, each line of the log records a relatively independent action, for example, a user makes an identity authentication, and the result is success or failure, so line is regarded as a set of independent input. We call this timescale logline level. As its name, logline level analysis will calculate the anomaly score of each line.
Secondly, in order to compare with the baseline experiments, we integrate all the actions recorded by the log of each user in each day, the anomaly score of each logline of a user in each day is aggregated to calculate the anomaly score for the user in that day. As we use the maximum anomaly score of a user, it is called user-day-max level. This level indicates the possibility of anomaly of a user in a specific day.
In addition, we use a normalization strategy. For the anomaly score of each line, it first subtracts the average exception score of the corresponding user on the same day, and then be calculated normally, so as to realize the normalization of the original score. This normalized calculation method is known as diff, so it is called user-day-diff level, marking the difference between maximum anomaly score and average score of a user in a specific day.
4.2 Metric
We use AUC as the evaluation metric, which represents the area under the receiver operator characteristic curve. It characterizes the trade off in model detection performance between true positives and false positives.
The AUC value will not be greater than 1,the higher the value, the better the performance of the model.
4.3 Baselines
According to [5], for the data we used, we define a multidimensional aggregate feature vector for each user, as the basis of comparative experiments.
We consider three baseline models, which are one class SVM, GMM and PCA.
Data Processing
In terms of data, we first filter out the abnormal logs in the data set, keep only the normal logs, and take 70% as the training set; then take all the remaining 30% in the original data set as the test set.
Specifically, the possibility of field value occurrence is divided into common and uncommon, the object is divided into single user and all users. Source PC name, target PC name, target user, process name and the PC name of the process are taken as the key fields of statistical information. The time is divided into all day, 0–6, 6–12, 12–18 and 18–24.
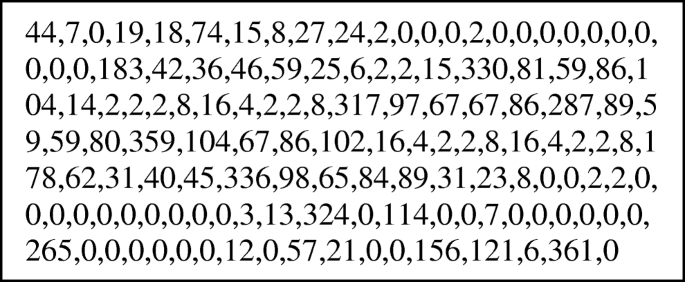
Make Cartesian product on the probability, object-oriented, key fields and time to get 100 features of statistical information, and then the fields that often appear in the log, such as login result, which is success or failure, are taken as the features to get 134-dimensional feature vector in the end.
The daily log of each user is summarized. If there are only a few different values in a certain field, such as login result, the frequency of these values will be counted. If there are a large number of different values in a certain field, such as PC name, user name, etc., these values will be divided into common or uncommon.
For a user, if the frequency of a value is less than 5%, it will be classified as uncommon; otherwise, it will be classified as common. For all users, if the frequency of a value is less than the average in its field, it will be classified as uncommon; otherwise, it will be classified as common. The information of each dimension of the feature vector is counted to get the feature vector of each user every day.
An example is shown in Fig. 2.
Example of processed features of baselines.
-
A.
principal components analysis
PCA is used to learn the position representation of the extracted feature vector, project the original data from the original space to the principal component space, and then reconstruct the projection to the original space. If only the first principal component is used for projection and reconstruction, for most data, the error after reconstruction is small; but for outliers, the error after reconstruction is still relatively large.
-
B.
one class SVM
In the detection of logs, there are only two categories: normal and abnormal, and the normal data is much more than the other. Therefore, one class SVM can be used to classify the extracted features and complete the exception detection.
-
C.
Gaussian Mixture Model
Gaussian Mixture Model (GMM) is one of the most prevalent statistical approaches used to detect anomaly by using the Maximum Likelihood Estimates (MLE) method to perform the mean and variance estimates of Gaussian distribution [9]. Several Gaussian distributions are joint together to express the extracted eigenvectors and find out the outliers.
5 Results and Analysis
Table 3a summarizes the detection performance on Knet2016 dataset, while the ROC curves are shown in Fig. 3.
ROC curves for dataset Knet2016.
Among all the methods, the best one is log-line level detection of BEM, and that of user-day level are also satisfactory. The feature vectors used by baselines can be equivalent to user-day level detection, it is shown that performance of BEM model is better than that of baselines.
For baselines, the used feature vectors determine their performance. At present, the vectors focus on the statistics of log generated by a user in a day in different time periods [5]. If this statistical method can’t directly reflect the pattern of anomalous logs, the baselines trained with these vectors will not get satisfactory results.
For BEM, it has achieved much better performance at logline level than user-day level. A good performance in logline level is easy to achieve, because the number of normal logs is hundreds of thousands of times that of anomalous logs, a few false positives will not make reduce the score too much. That is also the reason why the AUC score of logline level in [5] is so high.
In the calculation process at user-day level, we aggregate the anomaly score of each logline as the anomaly score of a user in a day. Proportion of normal and abnormal is reduced to several thousand times after the aggregation, which makes it more difficult to achieve higher AUC score. Besides, it may be the aggregation of anomaly scores which causes the performance. A better computing method of users’ anomaly score needs to be explored.
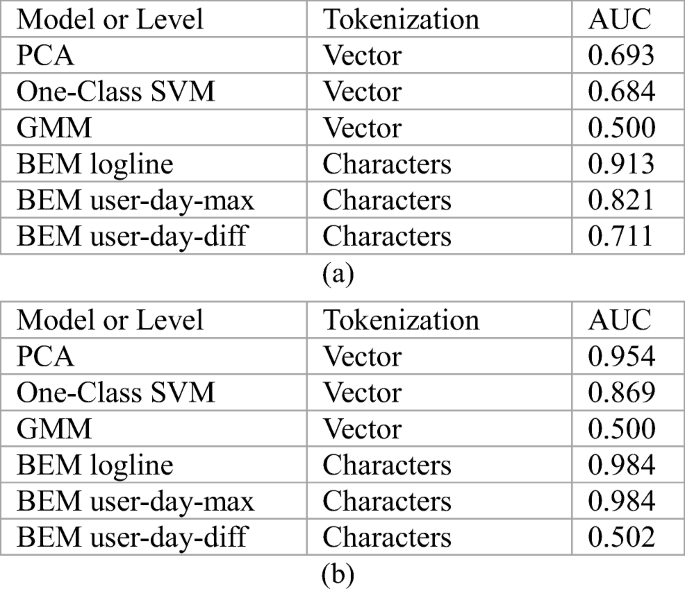
Table 5b summarizes the detection performance on R6.2 dataset, while the ROC curves are shown in Fig. 4. Notice that several curves are completely coincident. So we recognize the dataset used in this experiment is too small.
ROC curves for dataset R6.2.
The result of user-day-diff method is not satisfactory. One of the reasons may be that the proportion of normal and abnormal is too small.
Compared with the results of [5], we also come to the conclusion that the effect of the model at logline level is better than user-day level. However, [5] did not find the significant difference between logline level and user-day level when using the same data for training. This may be caused by the large difference in the amount of training data. Due to the limitation of computing power, we only use a small part of the dataset to train the model, so only methods with lR6.2le demand for data can maintain the best effect.
The two kinds of logs are also analyzed respectively, and the results are shown in Fig. 5. It can be seen that the results of user-day-diff method are not caused by the combination of the results of different logs.
Separate ROC curves for dataset R6.2: (a) Device data and (b) http data.
6 Conclusion
Based on the analysis of the logs content in datasets, we build an anomaly detection model based on LSTM. Processing the logs in Knet2016 and R6.2 datasets, training and testing the model on the extracted log-line text, the results show that it can correctly detect exceptions. Trough contrast experiments we can say that its effect is better than other models, including PCA, one class SVM and GMM.
However, the comparison between this model and other classical model still needs further testing. On one hand, training and testing should be carried out on datasets with wider sources and larger amount to obtain results which are more general; on the other hand, isolation forest should be introduced as a baseline for comparative experiments, because it is not as the best performing anomaly measurement algorithm in the recent DARPA insider thread detection program [10].
For the BEM itself, the use of dataset still needs to be adjusted. For each user in a day, a fixed number of logs could be selected for training to avoid oversized influence of any single user. At present, there are only 64 cells in the LSTM layer, more cells could be used in the next step.
A better calculation method of the anomalous score of a user needs to be explored. Anomalous loglines contain information of anomalous users, so a better integration method could improve the detection effect of the model on user-day level.
Through theoretical analysis, we give up the construction of multi-layer model. This enables the model to work at a lower computational power level. However, this does not mean that multi-layer model has no significance.
[11] propose another training and prediction method for log-line level, which also uses LSTM model. Through the drain approach proposed by [12], the log-line is parsed to obtain the category, which is used in sequence to predict the distribution of the next log-line category after training by LSTM.
Obviously, that kind of anomaly detection mode works in log-line level, which is different from the model in this paper. These two levels of prediction do not interfere with each other, so it can be considered to a certain extent. For example, directly weight the results of the two, or use any resolution method which is different from relying on the hidden value of BiLSTM to extract log-line features to parse the log. In the training of log-line feature sequence, this training can also be conducted through BiLSTM.
Due to the limitation of computing power, the datasets are not fully used, so the scale of the training data should be expanded to obtain better results. In addition, in R6.2 dataset, besides device access log and net access log, which are used, there are also logon log, file access log, etc. The comprehensive use of these logs will enhance the ability to detect anomalous users, and especially useful for identifying red team users.
However, the comprehensive use of logs from different sources requires further research. Obviously, logs from different sources have different structures. Mixing these logs directly and training through character-level models may not yield a good result. A natural idea is to detect these logs separately, and then integrate these anomaly scores after obtaining the anomaly scores of each user; another idea is to parse the logs to category code [12], sort these codes by time, then use several models to make predictions on the sequence. Obviously, this method will lose part of the information.
In some sense, this is also a kind of hierarchical structure. Whether calculating anomaly score of users by log category and then integrate, or parsing by logline and then detect, it is to synthesize existing information at a certain level, and then use the comprehensive result to detect anomaly at a higher level.
All in all, the way of building hierarchical structure model is worth further study.
References
Y. Zhao, X. Wang, H. Xiao and X. Chi, Improvement of the Log Pattern Extracting Algorithm Using Text Similarity, 2018 IEEE International Parallel And Distributed Processing Symposium Workshops (IPDPSW), Vancouver, BC, 2018, pp. 507–514.
Xu, K. Y., Gong, X. R., & Cheng, M. C. (2016). Audit log association rule mining based on improved Apriori algorithm. Computer Application, 36(7), 1847–1851.
Y. Zhao and H. Xiao, Extracting Log Patterns from System Logs in LARGE, 2016 IEEE international parallel and distributed processing symposium workshops (IPDPSW), Chicago, IL, 2016, pp. 1645–1652.
Seker, S. E., Altun, O., Ayan, U., & Mert, C. (2014). A novel string distance function based on Most frequent K characters. International Journal of Machine Learning & Computing, 4(2), 177–183.
Tuor A, Baerwolf R, Knowles N, et al. Recurrent neural network language models for open vocabulary event-level cyber anomaly detection. 2017.
Kent and Alexander D. Cyber security data sources for dynamic network research, Dynamic Networks and Cyber-Security. 2016.
Hochreiter S. and Schmidhuber J.. Long Short-Term Memory, Neural computation 9(8):1735–1780.
Rose S, Engel D, Cramer N, et al. Automatic keyword extraction from individual documents, Text Mining: Applications and Theory. John Wiley & Sons, Ltd, 2010, Automatic Keyword Extraction from Individual Documents.
W. Contributors. Maximum Likelihood Estimation, available: https://en.wikipedia.org/w/index.php?title=Maximum_likelihood_estimation&oldid=857905834, (2015).
Gavai, G., Sricharan, K., Gunning, D., Hanley, J., Singhal, M., & Rolleston, R. (2015). Supervised and unsupervised methods to detect insider threat from en-terprise social and online activity data. Journal Of Wireless Mobile Networks, Ubiquitous Computing, and Dependable Applications, 6(4), 47–63.
Du M, Li F, Zheng G, et al. DeepLog: Anomaly Detection and Diagnosis from System Logs through Deep Learning, Acm Sigsac Conference on Computer & Communications Security ACM, 2017.
He P, Zhu J, Zheng Z, et al. Drain: An online log parsing approach with fixed depth tree, 2017 IEEE international conference on web services (ICWS). IEEE, 2017.
Author information
Authors and Affiliations
Corresponding author
Additional information
Publisher’s Note
Springer Nature remains neutral with regard to jurisdictional claims in published maps and institutional affiliations.
Rights and permissions
Open Access This article is licensed under a Creative Commons Attribution 4.0 International License, which permits use, sharing, adaptation, distribution and reproduction in any medium or format, as long as you give appropriate credit to the original author(s) and the source, provide a link to the Creative Commons licence, and indicate if changes were made. The images or other third party material in this article are included in the article's Creative Commons licence, unless indicated otherwise in a credit line to the material. If material is not included in the article's Creative Commons licence and your intended use is not permitted by statutory regulation or exceeds the permitted use, you will need to obtain permission directly from the copyright holder. To view a copy of this licence, visit http://creativecommons.org/licenses/by/4.0/.
About this article

Cite this article
Zhao, Z., Xu, C. & Li, B. A LSTM-Based Anomaly Detection Model for Log Analysis. J Sign Process Syst 93, 745–751 (2021). https://doi.org/10.1007/s11265-021-01644-4
Received:
Revised:
Accepted:
Published:
Issue Date:
DOI: https://doi.org/10.1007/s11265-021-01644-4