
Abstract
Knowledge monitoring is a component of metacognition which can help students regulate their own learning. In adaptive learning software, the system’s model of the student can be presented as an open learner model (OLM) which is intended to enable monitoring processes. We explore how presenting alignment, between students’ self-assessed confidence and the system’s model of the student, supports knowledge monitoring. When students can see their confidence and their performance (either combined within one skill meter or expanded as two separate skill meters), their knowledge monitoring and performance improves, particularly for low-achieving students. These results indicate the importance of communicating the alignment between the system’s evaluation of student performance and student confidence in the correctness of their answers as a means to support metacognitive skills.
1 Introduction
Knowledge monitoring (the ability to distinguish between what one knows or does not know) is a required component of metacognitive skills. Students who lack knowledge monitoring skills spend more time on learning concepts that they have already mastered than they do on concepts yet to be mastered (Tobias and Everson 2009), which is inefficient. Students with good knowledge monitoring skills can accurately align their confidence in the correctness of their answers to their actual performance. High-achieving students assess their knowledge more accurately than low-achieving students (DiFrancesca et al. 2016; Mitrovic and Martin 2007; Kay et al. 2007). Giving low-achieving students additional opportunities to practice knowledge monitoring skills can improve their monitoring accuracy (Koriat 1997).
Monitoring of student knowledge can be performed by students, their teachers, or software. Intelligent tutoring systems (ITSs) are a type of software that includes this monitoring functionality to enable the adaptation of learning materials and experiences to students’ individual needs (Woolf 2009). ITSs rely on a specific type of user model, which is often called a learner model, to drive this adaptation. The learner model holds the system’s inferences about a student’s performance and is updated each time the student interacts with the system (VanLehn 2006). The learner model in an ITS is typically hidden, which means that students cannot access their own learner model. To support students in evaluating their own learning, researchers have argued that the system should open the learner model and make it accessible to students (Kay 1999). The main reasons for opening the learner model are to promote metacognitive behaviour, support students with self-regulated learning, and promote reflection (Bull and Kay 2013): the goal being to help students with knowledge monitoring by having them use open learner models (OLMs). OLMs can be accessed by students through visualisations, such as skill meters, graphs, word clouds, and network diagrams (Bull et al. 2016). These visualisations give students an overview of the progress and the state of their knowledge, allowing them to take responsibility for their own learning (Bull and Kay 2016). Skill meters, which resemble bar charts, are the most commonly employed form of OLM visualisation (Demmans Epp and Bull 2015; Mitrovic and Martin 2007; Weber and Brusilovsky 2001). They also tend to be the most used visualisation when students can choose how their model will be visualised (Bull et al. 2013, 2014a, b).
ITSs and other forms of adaptive learning environments more effectively support student learning when metacognitive components are included in the interface (Kay et al. 2013). Systems that include these features have been used to scaffold students’ self-regulated learning. For example, MetaTutor allowed students to set their goals and monitor their learning which positively influenced student learning achievement (Duffy and Azevedo 2015). Although adding components to represent metacognition could increase the complexity of the learning system, including simple student self-assessments in OLMs has been shown to improve student learning (Long and Aleven 2013; Hartley and Mitrovic 2002). For example, students could judge their knowledge following a single question (local monitoring) or may assess their level of confidence about the correctness of their answers for the whole task (global monitoring). As might be expected, the system’s evaluation of the students’ performance for an assigned task may not align with students’ confidence about their performance on that task. One reason for this lack of alignment could be a student having poor knowledge monitoring skills (assuming that the system evaluation is based on complete and correct information). The degree to which students are under- or overconfident can be considered a form of bias (Schraw 2009). This type of bias represents the alignment of a student’s self-assessed confidence, which we call confidence judgement, to the system’s evaluation.
Misalignment occurs when there is a disagreement between data sources. That is, when the system shows that the student understands the task but the student is not confident of having answered correctly, or when the system evaluation shows that the student lacks the necessary knowledge but the student is confident in his or her knowledge of the material. When a misalignment is detected, the system becomes uncertain about the state of the learner model. This uncertainty in learner models can be represented through the OLM (Demmans Epp and Bull 2015).
In this paper, misalignment is indicated using colour opacity: the more opaque the colour of the skill meter, the more aligned the system evaluation is with student confidence judgements, and the less opaque (i.e. higher the transparency) the skill meter’s colour, the more misaligned these two measures are. Kulhavy and Stock (1989) argue that when misalignment is detected between students’ confidence and their performance, the student may seek to resolve this misalignment. Thus, visualising alignment between the system’s evaluation of the correctness of the answers and student confidence in their answers may have implications for students’ metacognitive skills and use of OLMs.
Prior work showed that using a “chatbot” to allow the learner to negotiate with the system to reduce misalignment increased their self-assessment accuracy (Kerly and Bull 2008). Previously, we have shown (Al-Shanfari et al. 2017) that visualising alignment increases students’ confidence.
In this paper, we expand our research to focus on the effect of visualising alignment on student knowledge monitoring. In this case, knowledge monitoring is the act of students judging their confidence on each answer they provide. We focus on whether knowledge monitoring skills and OLM usage behaviours are influenced by students’ ability level (high- or low-achieving).
Using a mixed-methods design, a quasi-experimental study was conducted in a real-class setting. The study investigates how students’ confidence in what they know can be supported by visualising alignment. We test the following hypotheses:
H1
Presenting alignment will affect confidence judgement.
H2
Presenting alignment will affect students’ question answering and OLM viewing behaviour.
The results can help us design OLMs, in terms of what information to include and how to present this information to support metacognitive skills.
2 OLMs: aligning multiple belief sources
Representing students’ knowledge in the learner model, by including the degree of confidence, can allow students to see valuable information that may influence their decision making (Jackson and Kleitman 2014). Providing students with the opportunity to practice their knowledge monitoring skills may help students to improve their ability to assess their own knowledge.
Self-assessment in OLMs has helped improve students’ learning outcomes and self-assessment accuracy, especially for low-performing students (Long and Aleven 2013; Mitrovic and Martin 2007; Hartley and Mitrovic 2002). Some OLMs promote learner reflection by giving students the ability to compare confidence judgments across two data sources: student and teacher (e.g. reflectOLM; Kay et al. 2007) or the student and system (e.g. Mr. Collins, CALMSystem, and ViSMod; Bull and Pain 1995; Kerly et al. 2008; Zapata-Rivera and Greer 2004).
In Mr. Collins (Bull and Pain 1995), the learner model shows two separate models: one representing the system’s evaluation of the student’s performance and the other the student’s confidence in the answers for the questions solved. The learner model in Mr. Collins is presented using text-, with a four-point scale (very unsure, unsure, almost sure, and very sure). Students were able to compare directly the two presentations to check for alignment between the learner model and their confidence judgement. In this case, both the system and the student could initiate a discussion to resolve differences between the models with the aim of enabling the system to maintain a more accurate learner model.
Another example is the CALMSystem (Kerly et al. 2008), which was a negotiated learner model that used smiley faces and text to communicate the learner model. The OLM in CALMSystem showed the system’s evaluation and the student’s confidence separately. Students could compare these two models and initiate a negotiation if they disagreed with the system’s evaluation of their level of knowledge. Both Mr. Collins (Bull and Pain 1995) and CALMSystem (Kerly et al. 2008) used separate models to indicate alignment, and the papers discuss how negotiation to resolve misalignment impacted students’ self-assessment and the accuracy of the learner model.
In ViSMod (Zapata-Rivera and Greer 2004), nodes were used to represent the system evaluation of the students’ level of knowledge and the students’ confidence judgement for specific concepts. ViSMod uses different visual elements, such as colour and size of nodes, to show the students’ level of knowledge. Students could directly compare nodes to identify misalignments. When the system detected a misalignment in the data sources for some concept, the system asked the learner to clarify those concepts to resolve the misalignment.
In the above studies, both the system and the student tried to reduce the misalignment between the system evaluation and student confidence judgement using interactive maintenance mechanisms. Combining evidence from students’ self-assessment with evidence from the system or teacher could produce an accurate aggregated model that can be viewed through the OLM (Zapata-Rivera and Greer 2003). This type of aggregation and negotiation has supported student reflection over their learning through the processes used to resolve misalignment (Bull and Pain 1995; Kerly et al. 2008; Zapata-Rivera and Greer 2003). Rather than focusing on methods for resolving this misalignment, our work investigates the influence of how this alignment is presented on student confidence judgement.
3 Method
3.1 System design and architecture
OLMlets is an open learner modelling system that uses student answers to questions to provide adaptive feedback to students based on the correctness of their answers. This correctness information is used to infer student knowledge, which then informs the representation shown to users. OLMlets does not adapt questions based on students’ level of knowledge; rather it adapts the feedback they are given based on a learner model. OLMlets shows aspects of the underlying learner model to students so that they can monitor their knowledge (as measured by the correctness of the questions). This approach to adaptation is consistent with a recent review that argues presenting information about the correctness of student answers to questions is a core element of OLMs which can impact student learning (Bodily et al. 2018).
OLMlets has been used extensively in real-class settings and is hosted by the School of Electronic, Electrical and Systems Engineering at the University of Birmingham. OLMlets was first used in 2006 (Bull and Mabbott 2006) and has been used to support student learning across a variety of domains that include engineering (Bull and Gardner 2010) and the mechanics of adaptive learning environments (Alotaibi and Bull 2012). We modified this established learner modelling, educational system by extending its features to include a visualisation of the alignment between system assessments and student self-assessments to fulfil the aims of this research.
3.1.1 The OLMlets interface
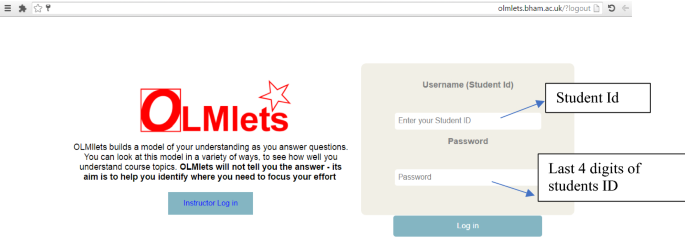
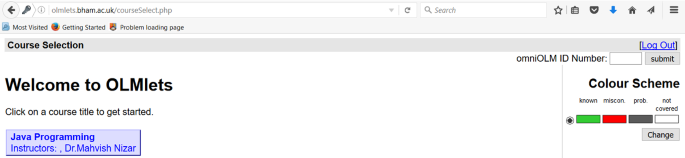
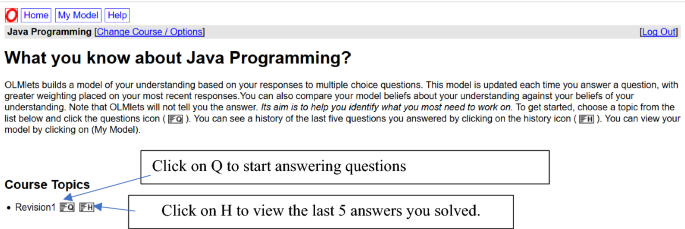
OLMlets can be accessed through the URL http://olmlets.bham.ac.uk. When students log into the system, they can select the course and topic that they want to study (Fig. 1). Once students have selected a course, they can click on the Q button (located next to the tabs “Revision 1” and “Revision 2” in the lower window) to go to the systems’ automated assessment of their knowledge for a specific topic. Students also can view the history of the last five questions and answers they provided by clicking the H button.

Screenshot of OLMlets interface: selecting the course (top) and selecting the topic (bottom)
In this study, OLMlets provided two sets of review questions, each including 25 multiple-choice questions that cover the course curriculum, to encourage students to use the system in preparation for their class tests. Students could attempt questions more than once. However, every time a student completed a set of 25 questions, the system provided a message to the student that “You have now answered all the questions on the topic. If you choose to proceed, you will be presented with questions you have seen before. If you do not wish to do this, choose another topic”.
3.1.2 OLMlets base system
In a manner consistent with overlay models (Carr and Golstein 1977), OLMlets uses student answers to multiple-choice questions to create a model that represents students’ weaknesses, strengths, or misconceptions (Bull et al. 2010). OLMlets has a misconception library that maps each individual question to the answer that provides evidence of a student misconception. These misconceptions are entered by instructors based on their experience and knowledge of the domain. Each question may or may not have a misconception associated with one of its answers.
OLMlets uses an algorithm that weights student responses based on when the question was answered. OLMlets models students’ level of knowledge based on the count of the last five questions answered for each topic. This weighting mechanism keeps the learner model current, as long as the learner continues to actively use the system. It is assumed that the previous five questions are sufficient to provide a snapshot of the students’ current performance, although we accept that limiting this to the five recent is somewhat arbitrary and that the k-previous (with k being different values) might have an impact on how the system operates or on the confidence judgement. However, we would question whether students would be able to interpret the output if k was large (i.e. 10 or more previous questions). Other adaptive learning systems take into account additional parameters when weighting student performance (e.g. initial learning parameter, slip parameter, guess parameter, and learning parameter) (Corbett and Anderson 1995), but they typically do not address issues of temporality in student modelling.
Questions in OLMlets are assumed to have similar difficulty levels; thus, the weighting mechanism is not influenced by the difficulty of the question. Having said this, the questions in OLMlets are not created following the more traditional ITS approach of deep domain modelling. In OLMlets, teachers are responsible for creating questions and associating them with knowledge components. This provides great flexibility and makes porting the system from one educational domain to another relatively easy. In this study, we liaise with the course instructor to evaluate the question difficulty (see Sect. 3.2).
A flowchart (Fig. 2) shows how learner model values are calculated within the base system, i.e. OLMlets (Bull and Mabbott 2006). Figure 2 shows the weight calculation for a single question. Every time the student answers a question, the system retrieves the number of questions answered and divides them by 5 to calculate how many questions are remaining to fill the skill meter (number of questions = 5). It then updates the state of the learner model based on the last five questions regardless of when they were answered.

Flowchart of the calculation of the weighted mechanism for a single question
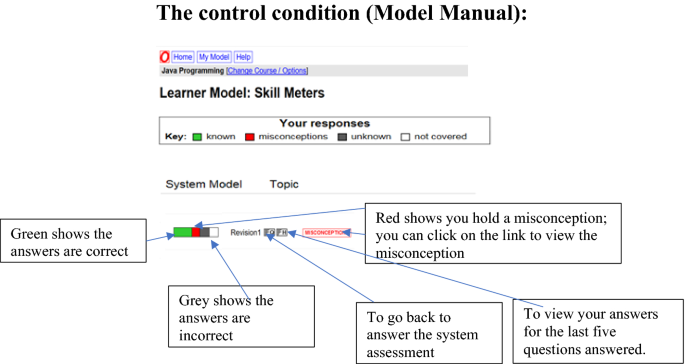
OLMlets uses skill meters to communicate the underlying learner model to students (Fig. 3). Initially, the skill meter is empty, showing that the student had not answered the questions associated with that skill meter. When the student starts answering questions, the learner model represents the student level of knowledge based on the system’s evaluation of their answers to questions. For example, in Fig. 3, the student has answered only one question in Revision 2 and this answer was incorrect. The skill meter (at the bottom of Fig. 3) shows that a segment has been filled in grey based on how much weight the question holds; the remaining portion of the skill meter remains empty (not covered). A green segment within a skill meter indicates that the student answered the questions correctly. Students who answered the last five questions correctly will have a skill meter that is completely green, and this represents that the learner model has a score of 1.

The standard skill meter within OLMlets showing a misconception details in the course of Java Programming
If the student selects an answer that indicates a specific misconception from the misconception library, a red segment is filled in the skill meter and additional information is provided to students. This information is intended to explain the misconception held by the student. For example, Fig. 3 shows the statement of the misconception in red “You may believe that string concatenation is added as integers”. Seeing a specific misconception (e.g. the concept of adding strings in a programming language in Fig. 3) may encourage students to do more activities in order to understand the concept correctly. Misconceptions are not a focus in this study, as the instructor was not concerned about them. Grey segments show that the student has provided incorrect answers (unknown in Fig. 3).
3.1.3 Modelling alignment
For this study, OLMlets was modified to allow students to assess their confidence in the correctness of their answer to each question using a four-option scale (“very sure”, “sure”, “unsure”, and “very unsure”). Students can inspect their learner model by clicking “My Model” any time while answering the questions (Fig. 4).

An example of a question and a self-assessment in the extended OLMlets
As noted previously, OLMlets evaluates students’ answers based on the correctness of the answers, and students assess their confidence of having entered a correct answer for that question. To construct the learner model, the system models the student level of knowledge as a continuous value between 0 and 1. A value of 0 indicates that the student currently has no knowledge, and a value of 1 represents full knowledge or mastery. Students’ confidence judgement is represented as a continuous value between 0 and 1. The confidence model uses the same weighting algorithm as the computer evaluation.
The confidence judgement options “very unsure” and “unsure” both represent that the student is unconfident that the answer is correct. When the student selects the confidence judgement option “very unsure”, this is weighted more heavily; it accounts for the full weight of the question (100%). If “unsure” is selected, the confidence judgement will be estimated using 75% of the weighting as unconfident and 25% of the weighting as confident. Similarly, confidence judgement of “very sure” shows that the student is 100% confident. This option is therefore weighted as such. The confidence judgement “sure” is represented as 75% confident and 25% unconfident.
The alignment between the two models is represented as a level where alignment values range between 0 and 1. Model alignment has four levels that show the degree of alignment: low (when the value of model alignment lies between .0 and .3), medium (when the value lies between .3 and .7), high (when the value is between .7 and 1.0), and aligned (when the value equals 1.0).
Table 1 shows the calculation after a student has answered seven questions. In each answered question, the learner model (known, unknown, or misconception) and the skill meter calculated. The alignment value is initially assigned to 1 and decreases, by the weight of the question, every time a misalignment is detected. For example, when the student answers the first question, the weight calculated based on the flowchart in Fig. 2 is .2. The skill meter is filled completely when the total sum for each segment (known, misconception, and unknown) is 1.
3.1.4 Visualising alignment
Students get feedback about the correctness of their answers and about their self-confidence rating (i.e. confidence judgment). Each time a student answers a question and assesses their confidence judgement, the system updates the learner model for performance and confidence. The visualisation of alignment (between performance and confidence judgement) enables students to understand both their performance and their knowledge monitoring ability. While it is possible that a low confidence judgement indicates that a student guessed, it may simply indicate that a student does not have confidence in his or her abilities. So, in the absence of additional information, it would be difficult to reliably integrate student self-perceptions into the assessment of their knowledge.
Figure 5a shows that the skill meter is filled with a portion of 1/5 in green, showing that the student answered the first question correctly. In this example, the student selected “unsure” as the self-assessment option, which is calculated as 75% of the weighted question as unconfident and 25% of the weighted question as confident. In Fig. 5a, the combined view shows that the skill meter is filled with green (1/5 known, see Table 1), and in the expanded view, the system evaluation (your knowledge) is filled by .2 with green and the student’s own confidence is filled with .15 unconfident (grey − .2 * .75) and .05 confident (green − .2* .25). In this example, there was a misalignment between the system evaluation about the correctness of the answer and the student’s own confidence that the answer was correct. Thus, the alignment value is reduced for the known concept by the weight of the student’s unconfidence (.15) which resulted in an alignment value of (.85). The alignment value affects the transparency of the colour in the combined view. The lower the alignment value, the higher the transparency of the colour and the higher the misalignment.

How the skill meter (expandable model) is affected while the student answered seven questions based on Table 1
When the student answers the second question, the newer question has more weight: the second question’s weight is calculated as .23, and the first question’s weight is reduced from .2 to .17. Figure 5b represents the student model when two questions were answered. The second question was answered incorrectly while the student assessed their confidence as “sure”. The student answered the next five questions correctly but student confidence that the answers were correct ranged between very unsure to very sure (Fig. 5c–g). Figure 5g shows the last five questions answered, where the first two answers are now not included in the learner model.
3.1.4.1 Representation of alignment using the combined view
In the combined view, students’ confidence judgement is shown with the system evaluation of the correctness of questions (Fig. 6).

Combined version
Each level of model alignment is represented by the opacity of the colour with each level having a certain degree of colour transparency that indicates the level of alignment: low (alpha = .2), medium (alpha = .4), high (alpha = .6), and aligned (alpha = 1, fully opaque). The system represents the alignment (i.e. agreement) in the learner model using four levels, because most people can effectively distinguish between four levels of opacity (Boukhelifa et al. 2012), which are shown in the skill meter legend (Fig. 6).
In the first skill meter of Fig. 6 (Use-Case Modelling—Revision 1), the transparency of the grey colour shows that the student answered the questions incorrectly while he or she was confident that the answer was correct, showing that the student was overconfident. In the second topic (Use-Case Modelling—Revision 2), the transparency of the green colour shows that the student was under-confident where the answers were correct.
3.1.4.2 Representation of alignment using the expanded view
Students had to click on the OLM to expand it. Specifically, students needed to click on “show models” within the OLM to expand it. In the expanded view, the skill meter “Your confidence” is represented by confident (green) and unconfident (grey). Students can compare directly between the correct answer represented by the green colour in the system’s model “your knowledge” with the green colour represented by confidence from the second skill meter “your confidence” (Fig. 7). Similarly, students can compare their lack of knowledge represented by the system using the colour grey “your knowledge” with the unconfident represented by the grey colour in “your confidence”. Thus, students can compare directly between the two colours from the two skill meters to explore the alignment.

Expanded view
3.1.5 Calculating bias in confidence judgement
Bias of student’s confidence judgement was used as a proxy for students’ knowledge monitoring skills, where it shows the direction of the individual’s ability to accurately estimate their performance. Bias was calculated as a unitised difference of the confidence judgement and the performance across all questions answered in each of Set 1 and Set 2, using Eq. (1) (Schraw 2009). The bias score is always between -1 and 1. The sign magnitude for the bias score is negative for under-confidence and positive for overconfidence, and a score of 0 indicates that students’ performance was aligned with their confidence judgement.
Based on Eq. 1, a bias score of 1 is obtained when the student fails to answer his or her knowledge assessment correctly but he or she is confident that the answer is correct. Conversely, a bias score of − 1 is obtained when the student never fails in his or her knowledge assessment but he or she is unconfident that the answer is correct for the whole assessment. The score of 0 (null score) is obtained when the student aligns their confidence to their performance.
3.2 OLMlets question design
Prior research has shown that question difficulty can affect student confidence judgments, with students tending to be overconfident when questions are more difficult (Nietfeld et al. 2005; Schraw and Dennison 1994). To help control for this effect, we used Bloom’s taxonomy as a proxy for question difficulty because questions requiring knowledge of specific principles or facts are answered correctly more than questions requiring both knowledge of the principles and how to apply them in a new situation (Bloom et al. 1956). While this proxy is imperfect, it provides a reasonable estimate in the absence of large norming studies.
The questions were categorised, according to Bloom’s taxonomy, from the simple recall of information and concept understanding to more complex questions that need evaluation skills (Bloom et al. 1956). The taxonomy contains six categories (Bloom et al. 1956):
Knowledge: the recall of major principles and theories.
Comprehension: the ability to understand basic statements.
Application: the ability to remember and apply principles, theories, and ideas.
Analysis: the ability to breakdown the statement for clarification.
Synthesis: the ability to put together elements to form a whole.
Evaluation: the ability to assess and judge for a given purpose.
To improve upon this categorisation, we had the course instructor (fourth author) rate the difficulty of each question on a scale from 1 (very easy) to 5 (most difficult). This rating was performed independently of the Bloom’s taxonomy categorisation.
These two ways of categorising the questions meant that all questions had been labelled with a category from Bloom’s taxonomy and an instructor-determined difficulty level.
There were two sets (Set 1, Set 2) of 25 questions. These questions covered 6 topics related to Java Programming. However, the number of questions is too small to evaluate students’ level of knowledge in each sub-concept separately. Instead, the aim was to encourage students to use the system to prepare for their actual class test by covering the course curriculum using two sets of review questions.
The researcher (first author) created the questions to make sure that students had not seen the exact same questions during class.
Table 2 describes the categories of the questions based on Bloom’s taxonomy and the instructor’s difficulty rating. Questions in Set 1 and Set 2 included the four lower levels of Bloom’s taxonomy with the majority of questions falling under the first level of Bloom’s taxonomy. There were no questions from the two top levels (Synthesis and Evaluation) because they were seen as being outside the scope of using multiple-choice questions to perform assessment.
3.3 Participants
Participants were students in the second year of an undergraduate programme in a school of engineering at a research-intensive university in the UK. There were 46 students in the class. Each student was assigned an identifier that ranged from S1 to S46.
The study was conducted in a course called “Introduction to Java Programming”. Use of the system was voluntary and students used it on their own time. Of these 46 students enrolled in the course, 37 logged into the system.
Students who did not view the model or attempted less than 10 questions were excluded. In the study, 32 students had valid logs.
Students were split into groups, based on the median score of their performance at the time of solving the first set of questions in OLMlets (Mdn = 62%). Those below the median were classified as low-achieving students and those at or above the median were classified as high-achieving students. Table 3 shows the number of students in each condition grouped by their ability level for both studies.
3.4 Study design
The study investigated the impact of visualising alignment on students’ bias of confidence judgement and the students’ behaviour in viewing the model and the number of questions answered.
To explore students’ perception of the learner model communication approach, a mixed-methods explanatory design was used (Creswell and Plano Clark 2007), where quantitative data of student behaviours, self-perception, and knowledge were complemented with more open-ended data about student experiences.
The study was conducted in the first semester of the second year of undergraduate study and took place over a two-week period near the end of term when students used the system to prepare for their course tests.
There were two sets of revision questions. Set 2 was uploaded to OLMlets one week after uploading Set 1. This was done to explore the practise effect on students’ confidence judgments from Set 1 to Set 2.
The study had two conditions, and students from each condition were divided into two groups based on their ability level (low- or high-achieving students).
3.4.1 System training
The lead author was given 15 min of class time at the start of the study to explain the use of OLMlets and its benefit to students. All students got the same 15-min presentation, so every group got to see each of the OLM study conditions. This time was used to explain system features to students and a user manual was distributed to all students based on the condition to which the student was assigned. The manual contained a visual step-by-step guide to system features that included screenshots to help students understand the system (see “Appendix 4” for exact direction given to participants). Each student had a username and password.
3.5 Study procedures
The study had two conditions:
Control: the standard system skill meter was used so the alignment information was hidden (see Fig. 3 for an example), and
Expandable model: this treatment condition allowed students to see the alignment between the system’s evaluation of their performance and their confidence in the correctness of their answers (see Fig. 7 for an example).
Students assessed their confidence after answering each multiple-choice question regardless of condition. Students were randomly assigned to each condition. Students in each condition were later classified into two levels (low- or high-achieving students).
3.5.1 Measures and quantitative analysis procedures
Both students’ confidence and performance were derived from the logs of the first attempt at a question (N = 25) for each question set.
Students’ performance was calculated based on the answer being correct or incorrect and their bias in confidence judgement calculated using the method described in Sect. 3.1.5.
Two independent variables are used: visualisation condition (control, expandable model) × students’ ability level (low-achieving, high-achieving).
Four dependent variables were measured. The first is the bias of students’ confidence judgement for Set 1 and Set 2 (denoted by bias 1 and bias 2). The second is student performance on Set 1 and Set 2. This performance is based on the correctness of the answers students gave (performance 1 and performance 2). The two dependent variables used to capture system use were the number of questions answered and number of times the model was viewed.
For statistical analysis, a mixed ANOVA was applied to explore the effects of all independent variables on the dependent variable (bias of confidence judgment, performance, questions answered, and OLM views) for both Set 1 and Set 2. Post hoc testing was then used to explore the direction of any effects. Prior to post hoc testing, the data were examined to see whether they met the assumptions of parametric testing and, if they did not, then a nonparametric test was applied. Nonparametric tests were also used when the sample size became small. An independent t test was used to identify significant differences between conditions (i.e. control and treatment). Mann–Whitney U tests were used to identify differences between conditions when the use of nonparametric statistics was more appropriate. The threshold for statistical significance was .05. Bonferroni correction was employed to control for multiple comparisons, when needed.
In this paper, we report effect size based on eta squared (η2) for ANOVA tests. Partial η2 was calculated and reported using Cohen’s guidelines for effect size (Cohen 1988). An effect size of .01 indicates a small effect, .06 a medium effect, and .138 a large effect. The effect size of Cohen’s d was calculated for t tests and followed the guidelines of .2 as small effect, .5 for medium effect, and .8 for large effect (Cohen 1988). The effect size of nonparametric tests (r) indicates .1 as a small effect, .3 as a medium effect, and .5 as a large effect (Cohen 1988).
3.5.2 Qualitative analysis procedures
Qualitative data were collected through semi-structured interviews. During these interviews, students were asked questions such as: Can you describe for me how you used the system? You were asked to assess your confidence after each question, what did you think of this? How did you use the information that was given to you about your confidence and performance in solving the questions?
These interviews were used to understand student experiences and explain the behaviours that were observed in the system log files. We, thus, use quotes to augment the quantitative results (using the identifiers noted in Sect. 3.3). We do not correct grammatical errors in participant quotes.
4 Results
4.1 Students’ confidence judgment over time: potential practice effects on alignment
To analyse the joint effects of condition (control, expandable model), prior knowledge (low and high-achieving students) and question set (Set 1 and Set 2) on student bias, a mixed ANOVA was conducted. This showed a small, main effect of question set on student confidence (F(1,26) = 6.083, p = .021, η2 = .190). There was a medium, interaction effect between question set and condition (F(1,26) = 5.811, p = .023, η2 = .183).
A post hoc, paired sample t test was conducted to explore these changes in student confidence for each condition classified by low- and high-achieving students. We also explored changes in their performance by condition and question set.
Table 4 presents a Bonferroni-corrected paired sample t test which showed a large difference in bias from Set 1 to Set 2 for low-achieving students in the control condition, equal variance assumed. This shows that students from the control condition had a large change in their tendency to be overconfident in Set 1 to being slightly under-confident in Set 2 (see Table 4). However, there was one low-achieving student from the control group whose behaviour in assessing his confidence (i.e. bias of confidence judgement) seemed substantially different from that of the others for both question Set 1 (bias = .43) and Set 2 (bias = .32). Unfortunately, this student was not among those interviewed so it is hard to interpret why the bias remained strong when the students’ system usage resembled that of others. This student completed the whole question set two times for both Set 1 and Set 2 (see student S1 in Fig. 9 of Appendix 2).
For the high-achieving students, there was no measurable change in the bias of their confidence judgement from Set 1 to Set 2 in both conditions.
Students from the expandable model condition had a stable confidence judgement while answering the questions from both Set 1 and Set 2, as shown by the non-significant difference in their confidence judgments (see Table 4). This stability in students’ confidence judgment indicates that those in the expandable model condition tried to accurately align their confidence with their performance while answering both Set 1 and Set 2.
There was a medium, main effect of question set on student performance (F(1,26) = 29.144, p < .001, η2 = .529). The post hoc analysis using the corrected Wilcoxon signed-rank test revealed a significant increase in performance for low-achieving students from the control group from Set 1 to Set 2 (see Table 5). This large increase in student performance from Set 1 to Set 2 indicates students were able to use feedback about their performance while answering the first set of questions to support their learning.
There was a medium interaction effect of Question × Prior Knowledge [F(1,26) = 22.365, p = .001, η2 = .462]. This was reinforced by the small, significant main between-subjects effect of prior knowledge [F(1,26) = 10.811, p = .003, η2 = .294]. We also found a small, significant interaction between Question set and prior knowledge on student confidence [F(1,26) = 4.490, p = .044, η2 = .147], suggesting that low-ability students increased confidence on the second question set. Further analysis suggests that, low-achieving students in the expandable model group improved their performance substantially from Set 1 to Set 2 with their low bias of confidence judgment remaining stable (Tables 4 and 5), thus viewing the model alignment was beneficial to them.
Low-achieving students clearly benefited from viewing model alignment, which was associated with positive changes in their performance. This change might be from students identifying their weaknesses while answering Set 1 questions, making them aware of their knowledge. This awareness could then be used to review the unknown concepts identified by OLMlets before they answered the second set of questions.
Low-achieving students from the control condition claimed that First I start going to revise whatever it was in OLMlets covered. If I got stuff wrong, I will go back and I will read all the stuff and if I got the stuff right then I will not worry about it (S26). They also used OLMlets to know how much I know (S20), and students from the expandable model condition thought that OLMlets was beneficial to support their learning because I can understand what I know and what I didn’t know (S33), and it helped me to get the knowledge I was missing (S18).
4.2 Students’ bias of confidence judgment
To address hypothesis 1 that visualising alignment affects students’ bias of confidence judgment, we analysed students’ bias from both revision sets (Set 1 and Set 2).
Table 6 displays an independent t test, equal variance assumed, which showed a significant difference between the control condition and the expandable model condition across all students. Students from the control group judged their confidence less accurately than those from the expandable model condition. This shows that visualising alignment benefited students by helping them align their confidence with their performance.
The significant difference was not observed in Set 2 where students from both groups had a similar ability to accurately estimate their confidence with respect to their performance (see Table 6). This shows that practising confidence judgement during question Set 1 may have impacted positively the control group who showed more accurate confidence judgement in Set 2 (as indicated by the bias scores). The stability and accuracy of the expandable model group’s confidence judgement in both Set 1 and Set 2 suggest that the practice of performing self-assessments alongside the representation of the alignment of their confidence and the system’s beliefs helped students to more quickly adjust how they viewed their own abilities.
Table 6 shows the potential difference in students’ confidence judgement between the expandable model group who were more accurate in assessing their confidence for Set 1 than students from the control group, who showed overconfidence.
The potential difference in student bias between the two conditions in Set 1 could be because students from the expandable model condition, who can inspect the alignment between their confidence and their performance, were taking their self-confidence assessment more seriously and trying to align their confidence to their performance. This interpretation is supported by students’ perspectives on their use of the system. A low-achieving student from the control condition claimed that: I did [accurate self-assessment] the first few times and then afterwards I just wanted to do the questions so I didn’t actually pay attention to that [confidence assessment] (S20). The log data for this student, S20, showed accurate confidence judgements (i.e. bias approaching the ideal of zero at − .01) while answering the first set of questions. S20’s bias then decreased to − .28 for the second set, which is consistent with what he reported during the interview. Also, some high-achieving students from the control condition did not take the confidence assessment seriously, e.g. I think most of the time I will click very sure, just click that (S30). Student reports of this nature match the system logs. For example, S30 had an average confidence score of 3.36 which is between the two scores (“sure” and “very sure”) and a bias score of .14, indicating that her self-confidence rating was higher than her actual ability. Similarly, another high-achieving student from the control condition (S12) had an average confidence of 3.8, a bias of .29, and claimed that “most of the time, I will choose very confident or just in the middle”. Allowing students to assess their confidence when answering the system automated assessment allowed us to have an overview of students’ behaviour in assessing their knowledge and visualise the alignment between students’ performance in the answers given and students’ confidence in the correctness of the answers.
On the other hand, students from the expandable model condition were trying to do more activities to help align their performance with their confidence level. A low-achieving student from the expandable model condition claims that seeing your knowledge and then you get to see what the system thinks of your knowledge and then that’s really helps (S33). Another low-achieving student from the expandable model group claimed that I didn’t do the questions one time, I did it multiple times as I am going to the topic, I was using the self-confidence more seriously… whichever questions I was not confident I was noted down and then I will do another go until I get right (S18). Comparing the log data against the qualitative evidence, S18 redid all questions four times and stopped redoing questions when they were all solved correctly. This student’s bias score also reduced through the study process, from − .11 the first time through the questions to − .05 on his fourth and final round of studying.
Also, high-achieving students from the expandable model condition were paying attention to their confidence judgements with the aim of aligning their confidence with their performance or, at a minimum, they did not want to be wildly overconfident in their self-assessments. For example, S21 didn’t want to answer very sure in case I got wrong or completely not sure… I went for the middle ones most of the time. This student’s log data show an average confidence score of 2.96 and a bias score of .01, showing that reflection over one’s abilities can occasionally induce self-doubt.
This indicates that visualising alignment could support students’ ability to align their confidence with their performance. We argue that students who were assessing their confidence judgement in the first set of questions were more aware of their knowledge in Set 2, potentially explaining the lack of difference in the Set 2 data, suggesting that practicing self-confidence assessment may help students to become more aware of their knowledge and eventually become more accurate in assessing their confidence judgement.
4.3 System usage by condition
Both high- and low-achieving students employed a similar system usage strategy. Their logged activities showed them accessing the learner model, which indicates that students took responsibility for their learning and reacted to the OLM by doing more questions or reviewing material in the area that needed improvement. See Table 8 in Appendix 2 for more information about the number of times students viewed their model and the number of questions they answered.
Students from the expandable model condition had two options to view the alignment between their models: viewing them as a single, combined skill meter or as separate skill meters. To view the separate, expanded skill meters students had to click to expand the model. Based on the system logs, low-achieving students from the expandable model condition were expanding the model more than high-achieving students. However, there were some students from both the low- and high-achieving student groups who did not expand the model (see Table 9 in Appendix 2).
The system usage logs and interview data reveal that the employed strategy includes students from each condition redoing the full question set multiple times: see Figs. 9 and 10 in Appendix 2. This behaviour was explained by one of the low-achieving students from the control condition saying that If I got stuff wrong then I will go back and I will read all the stuff (S26). Another of these students claimed that If it was wrong I look for the answers straight away I look at the topic in the book and then do the questions again (S20). This quote also suggests that students revisited questions to improve their understanding of the topic as indicated by S26 and S20.
Like these students, low-achieving students from the expandable model condition enacted the same strategy (see Fig. 10 in Appendix 2). For example, S9 visited all of question Set 1 five times. The student claimed to do OLMlets to see where I roughly was and then normally the green bar was quite low, and then I did some revision on the kind questions asked and then I go back and do it. Student S18 also visited the whole question set four times while solving Set 1 and five times while solving Set 2. This student believed that using OLMlets was strategic in preparation for the class test: good for revising for the test.
With the exception of two students (S12, S24), the high-achieving students who were in the control condition attempted the whole question set only once (see Fig. 11 in Appendix 2). S12 claimed that OLMlets is a good learning resource and explained that he used OLMlets before I revise for one topic and then after I revised the whole booklet.
High-achieving students from the expandable model condition used the same strategy as their peers from the control condition. Figure 12 in Appendix 2 shows students were motivated to solve the first set of questions but not all students were motivated to solve all of the questions in Set 2. One of these students (S37) solved both question sets four times and stated that, doing OLMlets really helped with like gaining new knowledge and consolidating the old knowledge. This student also thought that OLMlets supported examination preparation because it allowed him to practise for the class test.
Two students from the expandable model condition claimed that they did not experience problems distinguishing among levels of transparency, even with a slight change you can see the difference (S21) and I think it was easy to see the transparent green bar (S12). One student had a different opinion: S37 said the transparency wasn’t as obvious, would be clear to have two bars instead of one. Although this student claimed that the two bars (expanded skill meter) were preferable to one (combined skill meter), the log data showed that the student expanded the model only one time even though this student attempted all questions (N = 25) from both Set 1 and Set 2 four times (see Fig. 12 in Appendix 2).
A comparison of the question completion behaviour of low-achieving students across conditions to that of high-achieving students across conditions (see Figs. 9, 10, 11, and 12 in Appendix 2) may indicate that the open learner model motivated low-achieving students to perform learning activities within the system. This suggests student behaviours were influenced by their reflection on their learning, by viewing the alignment between their knowledge and beliefs, and by using that information to understand the topic and feel confident, particularly for low-achieving students before entering their final course examination.
5 Discussion
We examined students’ bias in their confidence judgement while students were interacting with the open learner model in the OLMlets system. In this section, we discuss the implications of our results for supporting students’ monitoring tasks as they regulate their learning.
5.1 Effect of OLMS and visualising alignment on students’ confidence judgment
In the absence of information about students’ confidence in the correctness of the answers, uncertainty about whether the student guessed the answer or had solid knowledge would not exist within the model and we would not be able to study the impact of visualising alignment on student confidence judgment.
Requiring students to assess their confidence when answering questions allowed us to provide them with the visualisation of the alignment between their performance in the answers given and their confidence in the correctness of the answers. This had a positive impact on the confidence judgment of students from the expandable model condition.
The findings from the study showed that visualising alignment supported more accurate confidence judgements (d = 1.02). This effect was not found for those in the control condition, where students used standard skill meters. This result suggests that providing students with separate information about their confidence judgments and their performance makes students more aware of the alignment between their performance and their confidence, thus supporting the development of their knowledge monitoring skills. This result is consistent with prior research where the OLM showed both knowledge and confidence ratings, which promoted learner reflection (Kerly and Bull 2008; Bull and Pain 1995) and helped students reduce the number of discrepancies (misalignment) between their performance and their confidence (Kerly and Bull 2008). The result is also consistent with prior research where students who received feedback about their performance and their confidence had more accurate confidence than those who only received feedback about their performance (Renner and Renner 2001; Callender et al. 2016).
Low-achieving students from the expandable model condition sought to align their confidence with their performance, which led to their confidence being more stable across question sets and a large increase (r = .81) in their performance from Set 1 to Set 2. This shows the importance of visualising alignment for low-achieving students to reflect on their learning.
Students in the control group were less accurate in their knowledge monitoring, with overconfidence in question Set 1. This could be due to the absence of information about their confidence in the correctness of their answers. However, the large improvement (d = 2.27) in the accuracy of confidence judgement for low-achieving students’ in the control group from question Set 1 to Set 2, suggests that the simple act of deliberately practicing self-assessment could be beneficial. This is an aspect of the work that would be interesting to follow up within subsequent studies.
Self-assessment (through confidence judgement) demonstrates reflection in action which is expected to positively impact on performance (Schon 1983). This process may provide internal feedback that supports student monitoring of their knowledge. In this study, improvement in students’ knowledge monitoring was also accompanied by a large increase (r = .9) in their learning performance. This result is in line with the theory suggested by Koriat (1997) that practising confidence judgment may improve students’ ability to monitor their knowledge. The result also confirms prior findings that practising confidence judgement and using internal feedback can enhance self-regulated learning (Butler and Winne 1995) in a new instructional domain. Our finding is consistent with research where overconfidence reduces when students assess their confidence level after each question and receive feedback about their performance (Renner and Renner 2001). These findings suggest that visualising the alignment between a student’s confidence and abilities may provide additional support for this process, further benefitting students.
Visualising alignment in OLMlets was associated with more accurate confidence judgments when students could view the alignment either combined in one skill meter or shown in two separate skill meters. This study showed the importance of visualising alignment to support students’ confidence judgment and how this support benefits students’ learning particularly for low-achieving students. Prior findings show that OLMs improved students’ self-assessment accuracy (Mitrovic and Martin 2007; Kerly and Bull 2008). We provide additional evidence of this effect at a time when a need for the replication of previous findings across contexts is growing.
Our findings expand on these previous findings by implying that adding information to the OLM about how student beliefs and performance are aligned can raise student awareness of specific aspects of their metacognitive skills (i.e. knowledge monitoring and self-assessment) and encourage students to engage more in the activities provided in the OLM when misalignment is detected. Thus, this suggests that visualising alignment benefits students to self-regulate their learning more than when students practice self-assessment on its own.
5.2 Limitations
We were limited to the number of students who enrolled in the course and who volunteered to use the system. A post hoc power analysis revealed the study was sufficiently powerful to detect large and medium effects, but that sample sizes would need to be more than doubled to detect small effects. However, the moderate sample size does not hinder our ability to obtain an initial understanding of how students respond to these new approaches to representing information in open learner models. Rather, it provides a base from which others can expand our understanding because we establish the potential effect sizes so that others can recruit appropriately sized samples.
Although the results show that low-achieving students benefited from visualising alignment as shown through the large increase in their performance from question Set 1 to Set 2, the lack of improvement observed among high-achieving students may be a result of their having no room for improvement in their performance.
We were also limited to the number of questions per topic where each set included 25 questions that covers the course curriculum to help students prepare for their final examination and questions were not presented to move from one difficulty level to the other, where results may vary based on different difficulty levels presented in a different order. Thus, different constraints such as limited number of participants, limited number of questions per topic, the difficulty level of the question, and type of domain, all could limit the generalisability of the findings.
In spite of these limitations, this study provides a stepping-stone to understanding how we can support students’ knowledge monitoring skills, especially for low-achieving students who need more differentiated support (VanZile-Tamsen and Livingston 1999).
6 Conclusions
This paper investigated how visualising the alignment between the system’s evaluation of student answer correctness and the student’s assessment of their own confidence in their answer affected knowledge monitoring skills. To do this, we explored how adding alignment information may have influenced the confidence judgements of those in both the treatment (expandable model) and control condition (standard skill meter). We then further analysed these factors based on student performance level (low- and high-achieving students).
Our study showed the benefit of adding the alignment information to an OLM to support students in regulating their learning. Those who could see the alignment between their performance and their confidence experienced greater consistency between these two measures earlier in the study for both low- and high-achieving students. Adding the confidence judgment to individual questions and having access to a standard open learner model also supported changes in student confidence in the correctness of their answers.
The results illustrate the potential benefits of visualising alignment in open learner models and aid students in their knowledge monitoring. These findings can inform the development of open learner models within intelligent tutoring systems or other similar forms of reporting when trying to support the development of students’ knowledge monitoring skills.
References
Alotaibi, M., Bull, S.: Combining Facebook and open learner models to encourage collaborative learning. In: International Conference on Computers in Education, Asia-Pacific Society for Computers in Education, Singapore, pp. 197–201. (2012)
Al-Shanfari, L., Demmans Epp, C., Baber, C.: Evaluating the effect of uncertainty visualisation in open learner models on students’ metacognitive skills. In: André E., Baker R., Hu X., Rodrigo M., Boulay B. (eds). Artificial Intelligence in Education. Lecture Notes in Computer Science. Springer, Wuhan, pp. 15–27. (2017)
Bloom, B.S., Englehart, M.D., Furst, E.J., Hill, W.H., Krathowohl, D.R.: Taxonomy of Educational Objectives: The Classification of Educational Goals. Handbook 1: Cognitive domain. McKay, New York (1956)
Bodily, R., Kay, J., Aleven, V., Davis, D., Jivet, I., Xhakaj, F., Verbert, K.: Open Learner models and learning analytics dashboards: a systematic review. In: Proceedings of the Eight International Conference on Learning Analytics and knowledge, ACM, (2018)
Boukhelifa, N., Bezerianos, A., Isenberg, T., Fekete, J.D.: Evaluating sketchiness as visual variable for the depiction of qualitative uncertainty. IEEE Trans. Vis Comput Graph 18(12), 2769–2778 (2012)
Bull, S., Gardner, P.: Raising learner awareness of progress towards UK-SPEC learning outcomes. J. High. Educ. Acad. Eng. Subj. Center 5(1), 11–22 (2010)
Bull, S., Kay, J.: Open learner models as drivers for metacognitive process. In: International Handbook for Metacognition and Learning Technologies. pp. 349–365. Springer, New York, (2013)
Bull, S., Kay, J.: SMILI☺: a framework for interfaces to learning data in open learner models, learning analytics and related fields. Int. J. Artif. Intell. Educ. 26(1), 293–331 (2016)
Bull, S., Mabbott, A.: 20000 inspections of a domain-independent open learner model with individual and comparison views. In: International Conference on Intelligent Tutoring Systems, Jhongli, Taiwan, pp. 422–432. (2006)
Bull, S., Pain, H.: “Did I Say what I Think I Said, and Do You Agree with Me?” inspecting and questioning the student model. In: Greer J. (ed.) Proceedings of World Conference on Artificial Intelligence and Education. Charlottesville VA, USA: Association for the Advancement of Computing in Education, pp. 501–508, (1995)
Bull, S., Mabbott, A., Gardner, P., Jackson, T., Lancaster, M.J., Quigley, S., Childs, P.A.: Supporting interaction preferences and recognition of misconceptions with independent open learner models. Adaptive Hypermedia and Adaptive Web-Based Systems, pp. 62–72. Springer, Berlin (2008)
Bull, S., Jackson, T., Lancaster, M.: Students’ interest in their misconceptions in first-year electrical circuits and mathematics courses. Int. J. Electr. Eng. Educ. 47(3), 307–318 (2010)
Bull S., Johnson M.D., Alotaibi M., Byrne, W., Cierniak, G.: Visualising multiple data sources in an independent open learner model. In: Lane H.C., Yacef K., Mostow J., Pavlik P. (eds.) Artificial Intelligence in Education. AIED 2013. Lecture Notes in Computer Science, vol. 7926, pp. 199–208. Springer, Heidelberg, (2013)
Bull, S., Johnson, M.D., Demmans Epp, C., Masci, D., Alotaibi, M., Girard, S.: Formative assessment and meaningful learning analytics. In: International Conference in Advanced Learning Technologies (ICALT), (2014a)
Bull, S., Johnson, M.D., Demmans Epp, C., Masci, D., Alotaibi, M., Girard, S.: Formative assessment and meaningful learning analytics: an independent open learner model solution. In: IEEE International Conference on Advanced Learning Technologies (ICALT), pp. 327–329. Athens, Greece: IEEE, (2014b)
Bull, S., Ginon, B., Boscolo, C., Johnson, M.D.: Introduction of learning visualisations and metacognitive support in a persuadable open learner model. In: Gasevic D., Lynch G. (eds.). Proceedings of LAK16 6th International Conference on Analytics and Knowledge, pp. 30–39, (2016)
Butler, D.L., Winne, P.H.: Feedback and self-regulated learning : a theoretical synthesis. Rev. Educ. Res. 65(3), 245–281 (1995)
Callender, A.A., Franco-Watkins, A.M., Roberts, A.S.: Improving metacognition in the classroom through instruction, training, and feedback. Metacognit. Learn. 11(2), 215–235 (2016)
Carr, B., Goldstein, I.: Overlays: a theory of modelling for computer aided instruction (AI Memo 406). Massachusetts Institute of Technology, AI Laboratory, Cambridge (1977)
Cohen, J.: Statistical Power Analysis for the Behavioural Sciences. Erlbaum, Hillsdale (1988)
Corbett, A.T., Anderson, J.R.: Knowledge tracing: modeling the acquisition of procedural knowledge. User Modell. User Adapt. Interact. 4, 253–278 (1995)
Creswell, J.W., Plano Clark, V.L.: Designing and Conducting Mixed Methods Research. Sage, Thousand Oaks (2007)
Demmans Epp, C., Bull, S.: Uncertainty representation in visualizations of learning analytics for learners: current approaches and opportunities. IEEE Trans. Learn. Technol. 1382(3), 242–260 (2015)
DiFrancesca, D., Nietfeld, J.L., Cao, L.: A comparison of high and low achieving students on self-regulated learning variables. Learn. Individ. Differ. 45, 228–236 (2016)
Duffy, M.C., Azevedo, R.: Motivation matters: interactions between achievement goals and agent scaffolding for self-regulated learning within an intelligent tutoring system. Comput. Hum. Behav. 52, 338–348 (2015)
Hartley, D., Mitrovic, A.: Supporting learning by opening the student model. In: Cerri S.A., Gouardères G., Paraguaçu F. (eds.) Intelligent Tutoring Systems. Biarritz, France and San Sebastian, Spain, Springer, Berlin, pp. 453–462. (2002)
Jackson, S.A., Kleitman, S.: Decision-making tendencies in a medical paradigm: the role of individual differences in feelings of confidence and its calibration. Metacognit. Learn. 9, 25–49 (2014)
Kay, J.: A scrutable user modelling shell for user-adapted interaction (Ph.D.). Department of Computer Science, University of Sydney, (1999)
Kay, J., Li, L., Fekete, A.: Learner reflection in student self-assessment. In: Mann, S. (ed.) Proceedings of Ninth Australasian Computing Education Conference, Australian Computer Society, Inc., Darlinghurst, pp. 89–95. (2007)
Kay, J., Kleitman, S., Azevedo, R.: Empowering teachers to design learning resources with metacognitive interface elements. In: Luckin R., Puntambekar S., Goodyear P., Grabowski B., Underwood J., Winters N. (eds): Handbook of Design in Educational Technology, Taylor and Francis Group, New York, (2013)
Kerly, A., Bull, S.: Children’s interactions with inspectable and negotiated learner models. In Woolf B., Aimeur E., Nkambou R., Lajoie S. (eds.) Intelligent Tutoring Systems, vol. 5091, pp. 132–141. Springer, Montreal, (2008)
Kerly, A., Ellis, R., Bull, S.: CALMsystem: a conversational agent for learner modelling. In: Knowledge-Based Systems, pp. 238–246. (2008)
Koriat, A.: Monitoring one’s own knowledge during study: a cue-utilization approach to judgments of learning. J. Exp. Psychol. Gen. 126(4), 349–370 (1997)
Kulhavy, R.W., Stock, W.A.: Feedback in written instruction: the place of response certitude. Educ. Psychol. Rev. 1(4), 279–308 (1989)
Long, Y., Aleven, V.: Supporting students’ self-regulated learning with an open learner model in a linear equation tutor. In: Lane, H.C., Yacef, K., Mostow, J., Pavlik, P. (eds.) Artificial Intelligence in Education, pp. 219–228. Springer, Berlin (2013)
Mitrovic, A., Martin, B.: Evaluating the effect of open student models on self-assessment. Int. J. Artif. Intell. Educ. 17(2), 121–144 (2007)
Nietfeld, J.L., Cao, L., Osborne, J.W.: Metacognitive monitoring accuracy and student performance in the postsecondary classroom. J. Exp. Educ. 74(1), 7 (2005)
Renner, C.H., Renner, M.J.: But I thought I knew that: using confidence estimation as a debiasing technique to improve classroom performance. Appl. Cognit. Psychol. 15(1), 23–32 (2001)
Schon, D.: The Reflective Practitioner. Basic Books, USA (1983)
Schraw, G.: A conceptual analysis of five measures of metacognitive monitoring. Metacognit. Learn. 4(1), 33–45 (2009)
Schraw, G., Dennison, R.S.: Assessing metacognitive awareness. Contemp. Educ. Psychol. 19(4), 460–475 (1994)
Tobias, S., Everson, H.T.: The importance of knowing what you know: a knowledge monitoring framework for studying metacognition in education. In: Hacker, D.J., Klosy, J., Graesser, A.C. (eds.) Handbook of Metacognition in Education, pp. 107–127. Routledge, New York (2009)
VanLehn, K.: The behaviour of tutoring systems. Int. J. Artif. Intell. Educ. 16(3), 227–265 (2006)
VanZile-Tamsen, C., Livingston, J.: The differential impact of motivation on the self-regulated strategy use of high- and low-achieving college students. J. Coll. Stud. Dev. 40(1), 54–60 (1999)
Weber, G., Brusilovsky, P.: ELM-ART: an adaptive versatile system for web-based instruction. Int. J. Artif. Intell. Educ. 12(4), 351–384 (2001)
Woolf, B.: Building Intelligent Interactive Tutors: Student-Centred Strategies for Revolutionizing e-Learning, pp. 49–94. Morgan Kaufmann, Burlington (2009)
Zapata-Rivera, J.D., Greer, J.E.: Student model accuracy using inspectable bayesian student models. In: Hoppe U., Verdejo F., Kay J. (eds.) Proceedings of AI-Ed’2003, Amsterdam, IOS Press, pp. 65–72. (2003)
Zapata-Rivera, J.D., Greer, J.E.: Interacting with inspectable bayesian student models. Int. J. Artif. Intell. Educ. 14, 127–163 (2004)
Acknowledgement
This study was funded by University of Birmingham.
Author information
Authors and Affiliations
Corresponding author
Additional information
Publisher's Note
Springer Nature remains neutral with regard to jurisdictional claims in published maps and institutional affiliations.
Appendices
Appendix 1: Statistical analysis
The Shapiro–Wilk test for the bias of students’ confidence judgement measures (bias 1 and bias 2) for both student ability levels in each condition shows that data were normally distributed (p > .05). Student performance in Set 1 and Set 2 were also normally distributed (p > .05) except for that of Set 2 low-achieving students from the control condition (p = .005). The number of times students viewed the model in Set 1 and Set 2 was also normally distributed (p > .05). The number of questions answered was normally distributed for low-achieving students and not normally distributed for high-achieving students for both groups.
Two-way ANOVA tests revealed no interaction between the two independent variables: visualisation condition and students’ ability level on bias 1 [F(1,26) = .332, p = .569, η2 = .012] or bias 2 [F(1,26) = .015, p = .904, η2 = .001]. The interaction graph for bias 1 shows that the graphs intersect (Fig. 8). However, the p value of the interaction shows the interaction is not significant (visualisation condition * ability level > .05). The apparent intersection is due to high variability in the data. The result shows that there was a main effect on the independent variable visualisation condition on the dependent variable with respect to students’ bias of confidence judgement (bias 1) [F(1,26) = 6.625, p = .016, η2 = .191] (see Table 7).

Two-way ANOVA interaction graphs between the two independent variables for bias 1 (a) and bias 2 (b)
Appendix 2: System usage statistics
To analyse the joint effects of condition (control, expandable model), prior knowledge (low and high-achieving students), and question set (Set 1 and Set 2) on number of questions solved and number of model views, a mixed ANOVA was conducted. There was no significant main effect detected on number of questions answered (F(1,26) = .681, p = .417, η2 = .026) or on number of times students viewed the OLM (F(1,26) = .086, p = .772, η2 = .003). There was also no interaction effect between question set and condition on number of questions solved (F(1,26) = .002, p = .965, η2 = .026) or model views (F(1,26) = .009, p = .926, η2 = .000) (see Tables 8, 9; Figs. 9, 10, 11, 12).

Number of times the low-achieving control group students visited the whole question Set

Number of times the low-achieving students from the expandable model condition visited each question Set in its entirety

Number of times the question sets were completed for the high-achieving students from the control condition

Number of visits to question sets for high-achieving students from the expandable model condition
Appendix 3: Sample questions
Here are examples of the questions uploaded to OLMlets for each of the levels that are represented in the taxonomy for the course Java Programming:
Knowledge:
What is the return type if a method does not return any value?
- (a)
int
- (b)
float
- (c)
void
- (d)
double
- (a)
Comprehension:
Which statement is true from the following:
- (a)
only protected elements can be inherited.
- (b)
only private elements can be inherited.
- (c)
only protected and public elements can be inherited.
- (d)
all elements can be inherited.
- (a)
Application:
Which of the following commands will set a layout manager that divides the container into 3 rows and 4 columns?
- (a)
SetLayout (new GridLayout(3,4));
- (b)
SetLayout (new GridLayout(4,3));
- (c)
SetLayout (4,3);
- (d)
SetLayout (new FlowLayout(4,3));
- (a)
Analysis:
What will be the output of the following code?
String s1 = “85”;
String s2 = “95”;
String s3 = “90”;
System.out.println (s1 + s2 + s3);
- (a)
270
- (b)
“859590”
- (c)
“909585”
- (d)
“958590”
- (a)
Appendix 4: User manual
Java Programming
Department of Electronics, Electrical and Systems Engineering
University of Birmingham
Project Manual Information: OLMlets
OLMlets is an adaptive teaching system that aims to help students become independent in their learning. OLMlets can identify students’ weaknesses, strengths, or misconceptions. The learner model in OLMlets is constructed based on students’ responses to multiple-choice questions for the last five questions attempted. OLMlets offers a skill meter visualisation that uses different colours to indicate the students’ weaknesses (grey), misconceptions (red), or strengths (green). A fully green skill meter shows that the student has mastered the topic. A skill meter that is half green and half grey shows that the student has mastered 50% of the topic and the remaining 50% comprise the incorrect answers. The incorrect answers show that the learner has some weakness in the topic and needs to put some effort in his or her learning. The skill meter can have a red colour for a misconception. A misconception link can be clicked to show a description of the misconception that the learner had.
Kindly follow the below steps:
- 1.
Go to the URL http://olmlets.bham.ac.uk.
- 2.
Sign in with your ID number.
- 3.
Choose your course.
- 4.
Choose the topic.
- 5.
Answer the questions.

- 6.
Check your performance.


Rights and permissions
Open Access This article is licensed under a Creative Commons Attribution 4.0 International License, which permits use, sharing, adaptation, distribution and reproduction in any medium or format, as long as you give appropriate credit to the original author(s) and the source, provide a link to the Creative Commons licence, and indicate if changes were made. The images or other third party material in this article are included in the article's Creative Commons licence, unless indicated otherwise in a credit line to the material. If material is not included in the article's Creative Commons licence and your intended use is not permitted by statutory regulation or exceeds the permitted use, you will need to obtain permission directly from the copyright holder. To view a copy of this licence, visit http://creativecommons.org/licenses/by/4.0/.
About this article

Cite this article
Al-Shanfari, L., Demmans Epp, C., Baber, C. et al. Visualising alignment to support students’ judgment of confidence in open learner models. User Model User-Adap Inter 30, 159–194 (2020). https://doi.org/10.1007/s11257-019-09253-4
Received:
Accepted:
Published:
Issue Date:
DOI: https://doi.org/10.1007/s11257-019-09253-4