
Abstract
Previous research revealed that students who are overestimated in their ability by their teachers experience school more positively than underestimated students. In the present study, we compared the socio-emotional experiences of N = 1516 students whose cognitive abilities were overestimated, accurately judged, or underestimated by their teachers. We applied propensity score matching using students’ cognitive ability, gender, language, parental education, and teacher’s acquaintance with them as covariates for building the three student groups. Matching students on these variables, reduced the original sample size to subsamples with n1 = 348, and n2 = 312 with exact matching including classroom. We compared overestimated, accurately judged, or underestimated students in both matching samples in their socio-emotional profiles (comprised of academic self-concept, joy of learning, attitude towards school, willingness to make an effort, social integration, perceived class climate, and feeling of being accepted by the teacher) by linear discriminant analyses. Groups significantly differed in their profiles. Overestimated students had the most positive socio-emotional experiences of school, followed by accurately judged students. Underestimated students experienced school most negatively. Differences in experiences were most pronounced for the learning environment (medium to large effects for academic self-concept, joy of learning, and willingness to make an effort; negligible effect for attitude towards school) and less for the social environment (medium effects for feeling of being accepted by the teacher; negligible effects for social integration and perceived class climate).
1 Theoretical background
1.1 Introduction
How students experience school influences their socio-emotional and personal development. A positive attitude towards school and good social integration at school foster students’ socio-emotional and personal growth (Aviles et al., 2006) and academic success (Lam et al., 2018). Teachers are heavily involved in students’ socio-emotional experiences of school (SEES); they are central reference persons for students and influence the class’s academic and social climate. Accordingly, students’ positive SEES are associated with teacher support and their relationship with the teacher (Aviles et al., 2006; Heller et al., 2012; Rucinski et al., 2018), teachers’ early childhood specialization (Nocita et al., 2020), and teachers’ classroom management skills (Korpershoek et al., 2016).
Several studies have investigated the relation between students’ SEES and whether they are over- or underestimated by their teachers. The results consistently show that students who are underestimated in their achievement are at a disadvantage compared to students who are overestimated. For example, underestimated students have a more negative self-concept, enjoy school less, and feel less supported by their teachers and peers (e.g., Rubie-Davies & Peterson, 2016; Urhahne, 2015). Most studies in this research field have focused on teacher judgments of students’ achievement. However, examining teacher judgments of students’ cognitive ability—rather than academic achievement—in relation to students’ SEES is important because teachers tend to make larger misjudgments for students’ cognitive abilities compared to their academic achievement (Machts et al., 2016; Südkamp et al., 2012). There is initial evidence supporting the idea that students’ SEES is related to their teachers’ judgments of their cognitive ability. A longitudinal study with primary school students by Baudson (2011) found that children who were underestimated by their teachers in terms of cognitive ability developed less positively in their academic self-concept, interest, and attitude towards school one year later compared to students who were overestimated. However, other factors could be responsible for the observed differences in the students’ development in this study and more research is needed with matched student samples. In addition, most studies in this area have only investigated students in Grade 4 and above. However, positive experiences in school are particularly relevant in the early school years, and they are a crucial starting point for further learning and socio-emotional development (Aviles et al., 2006). Therefore, there is a need for studies with younger students in their primary school years.
In the present study, we add to the literature by investigating a large sample of primary school students in Grades 1 to 4. We assessed multiple dimensions of students’ SEES and teacher judgments of students’ cognitive ability, and controlled for potential confounding variables by matching underestimated, accurately judged, and overestimated students on these variables using propensity score matching (PSM). Our findings may serve to heighten the awareness of possible positive and negative associations between teacher judgments of students’ abilities and students’ SEES.
1.2 Students’ socio-emotional experiences of school
Students’ SEES constitute mental representations of the school environment gained from their experiences. It is a collective term for a multitude of constructs related to the experience of school. De Fruyt et al. (2015) defined students’ SEES rather broadly as thoughts, feelings, and behaviors developed through learning experiences. Primi et al. (2021) proposed more specific skills covering socio-emotional functioning in adolescents (i.e., self-management, engaging with others, amity, negative emotion regulation, and open-mindedness). Rauer and Schuck (2003) defined SEES as the perception and evaluation of the school environment, one’s social relationships and integration, school- and learning-related climate, and one’s own competency. The different dimensions of students’ SEES can broadly be grouped into relationships (with other students and the teacher) and characteristics of the classroom and the school (Eder, 2018; Grewe, 2017). Similarly, Gnas et al. (2022a) distinguished between the experience of the learning environment and the experience of the social environment. The experience of the learning environment includes students’ academic self-concept, their joy of learning, their attitude towards school, and their willingness to make an effort; the experience of the social environment includes students’ perceptions of their social integration, their feeling of being accepted by the teacher, and the class climate (see Rauer & Schuck, 2003; for definitions, see Table 1).
Several factors are associated with students’ SEES. First, girls experience school more positively than boys on average (Bergold et al., 2020; Likhanov et al., 2020; Van Rossem & Vermande, 2004). Secondly, positive SEES are related to a positive working atmosphere at school (e.g., high levels of teacher acquaintance with the student, existence of rules in the classroom, low performance goals and competitive pressure; Hofmann & Siebertz-Reckzeh, 2008; Johns, 2020). Thirdly, social support from peers or adults, such as parents, caregivers, or teachers, promotes positive SEES (Aviles et al., 2006). Since students spend a significant part of their lives in school, teachers play a particularly important role. Students’ SEES are associated with their relationship with the teacher (Heller et al., 2012; Rucinski et al., 2018), teachers’ classroom management (Korpershoek et al., 2016), and teachers’ specialization in early childhood education and care, which might be explained by the fact that they gain specialized knowledge and skills that enable them to interact with children in ways that are effective at supporting their future development (Nocita et al., 2020). Moreover, teacher judgments of students’ achievement or ability are related to students’ SEES (Wang et al., 2018).
1.3 Teacher judgments and students’ socio-emotional experiences of school
In the following, we introduce teacher judgments and their accuracy, and present findings on teacher judgments of students’ achievement and ability. Below, we summarize methods for studying over- and underestimation. We then review findings of studies comparing the SEES of students who are overestimated and underestimated by their teachers.
1.3.1 Teacher judgments of students’ achievement and ability
One central part of teachers’ professional competency is their diagnostic competency (Baumert & Kunter, 2011). It can be defined as the competency to correctly judge a student or task concerning a specific characteristic (Urhahne & Wijnia, 2021). In research, the term is used interchangeably with teacher judgment accuracy (TJA; Urhahne & Wijnia, 2021). Teachers high in this competency can judge task characteristics, such as the demands that certain learning tasks make for students, and student characteristics, such as their cognitive ability. Teachers who are low in judgment accuracy, to various extents, over- or underestimate student or task characteristics. Research distinguishes between relative and absolute TJA (Urhahne & Wijnia, 2021). Relative TJA concerns the relation (e.g., the correlation) between the teacher judgment of task or student characteristics and the actual characteristics of the task or student. Absolute TJA concerns the difference between the judged and actual task or student characteristic and allows consideration of both the magnitude and direction of judgment inaccuracies (i.e., over- and underestimation).
To date, most of the studies on TJA have focused on relative TJA concerning judgments of students’ academic achievement and cognitive abilityFootnote 1. Three meta-analyses examined TJA by correlating teacher judgments with students’ actual achievement or cognitive ability. The results demonstrate that teachers are more accurate in judging students’ achievement (r =.66 in 16 studies with 55 effect sizes, Hoge & Coladarci, 1989; r =.63 in 75 studies with 73 effect sizes, Südkamp et al., 2012) than students’ cognitive ability (r =.43 in 33 studies with 106 effect sizes; Machts et al., 2016).
1.3.2 Studying overestimated versus underestimated students: methodological considerations
Absolute TJA allows researchers to investigate over- and underestimation. The literature reports two ways of operationalizing absolute TJA: residuals and the level component. Residuals are derived from regressing teacher judgments on student characteristics or vice versa. They display the share of variance in teacher judgments not explained by the actual student characteristic (e.g., Gentrup et al., 2020). The level component represents the difference between the values of teacher judgments and the actual student values (e.g., Zhou & Urhahne, 2013)
For studying over- and underestimation, the residuals or the level component can be used either as continuous variables or by using cut-offs to build groups of underestimated, overestimated, or accurately judged students. Both approaches have been used for the comparison of over- and underestimated students and their SEES (see Table 2). The comparison has been conducted by using TJA as a cut-off variable (e.g., binary: overestimated vs. underestimated students) or as a continuous variable (e.g., increasing residuals for decreasing TJA). Furthermore, for studying the relation of over- and underestimation with SEES, the studies either conducted group comparisons (e.g., comparing overestimated and underestimated students in their SEES) or analyzed relations (e.g., TJA served as a predictor for/was correlated with students’ SEES).
1.3.3 Overestimated versus underestimated students’ socio-emotional experiences of school
Table 3 summarizes the findings from studies on students’ SEES in relation to teachers’ over- and underestimation. Most of the findings are related to the experience of the learning environment, and only a few are related to the experience of the social environment. In five studies, students’ achievement was the characteristic judged by the teachers; in two studies, it was students’ cognitive or mathematical ability. Six studies reported actual TJA, and one study by Gniewosz and Watt (2017) reported students’ perception of TJA. Four studies took place in primary school, and three took place in secondary school. Half the studies did not include any control variables; the other half included only a few (mostly student achievement). Five studies were carried out cross-sectionally, whereas two studies investigated the long-term effect of over- and underestimation on students’ SEES using a longitudinal design. The samples varied between 144 and 1271 students; however, six of eight studies had samples with N < 300. Finally and most importantly, most of the findings were significant and all were in favor of overestimated students. That is, overestimated students perceived their learning and social environment more positively than underestimated students.
Furthermore, Table 3 shows the effect sizes by which over- and underestimated students differed in various dimensions of the experience of the social and learning environmentFootnote 2. More specifically, effects for the experience of the social environment were either small or not significant. Small effects were found for perceived teacher support and behavior as well as perceived peer support (Rubie-Davies & Peterson, 2016; Stang & Urhahne, 2016; Urhahne, 2015); nonsignificant effects were found for changes in feelings of being accepted, social integration, and perceived class climate (Baudson, 2011). Effects for the experience of the learning environment were heterogeneous. Looking at the dimensions more closely, it becomes clear that the largest effects (medium to large effect sizes) were consistently present for academic self-concept and enjoyment (Baudson, 2011; Urhahne, 2015; Urhahne et al., 2010, 2011). Furthermore, (consistently) small effects were found for changes in academic interest and attitude towards school, as well as students’ self-efficacy and test anxiety (Baudson, 2011; Rubie-Davies & Peterson, 2016; Urhahne, 2015; Urhahne et al., 2010, 2011). The remaining dimensions were more heterogeneous: small, medium, and large effects were found for expectancy of success and attribution for success/failure (Urhahne et al., 2010, 2011; Urhahne, 2015; Zhou & Urhahne, 2013); and nonsignificant, small, and medium effects were found for motivational variables (i.e., students’ learning motivation, learning goals, level of aspiration, and changes in utility and intrinsic values; Gniewosz & Watt, 2017; Rubie-Davies & Peterson, 2016; Urhahne, 2015; Urhahne et al., 2010; Urhahne et al., 2011). Altogether, overestimated and underestimated students descriptively differed more in their experience of the learning environment compared to their experience of the social environment. However, the findings mainly concern the TJA of academic achievement and there are more findings for the experience of the learning environment than for the social environment.
Relations between TJA and socio-emotional experiences of school are often explained by the relationship—or more specifically the interaction—between teachers and their students. In general, research shows that the relationship between teachers and their students is highly relevant for the socio-emotional experiences, development, and learning at school. The large-scale meta-study by Hattie (2009) with over 800 meta-analyses showed that, among various factors related to the teacher, the teacher-student interaction (e.g., allowing the experiences of the child to be recognized in the classroom, listening or empathy) had one of the strongest effects on student learning. Moreover, several recent meta-analyses showed small to moderate correlations between teacher-student relationships and student outcomes in (primary) school (e.g., motivation, well-being, engagement, learning participation, academic emotions; Emslander et al., 2023; Lei et al., 2018; Li & Xue, 2023).
In this context, relations between TJA and socio-emotional experiences of school are often explained by a teacher-student interaction model by Brophy and Good (1970) and Brophy (1983). In their 6-step model, the authors elaborated the processes of interaction between students and the teacher: (1) The teacher has different expectations regarding students’ performance or ability. (2) Consistent with these expectations, the teacher behaves differently toward his or her students. (3) The students react differently to the teacher because they have been treated differently by him or her. (4) If teacher behavior remains stable over time and if students do not change their behavior over time, it is likely to affect their experiences in the classroom, such as their self-concept, motivation, and social interactions. (5) These effects then confirm and reinforce teacher expectations, and students conform more to these expectations than they would have done otherwise. (6) Finally, this will lead to differences in students’ performance and other outcomes such as their SEES.
1.4 The present study
Previous research has shown that overestimated and underestimated students systematically differ in their SEES—always in favor of overestimated students (e.g., Urhahne, 2015). Most of this research deals with the TJA of academic achievement, and rarely with cognitive ability. However, especially in primary school, it is relevant to focus more on judging academic ability than achievement, since primary school students have relatively short learning histories in which they have received formalized instruction. Differences between overestimated and underestimated students seem to be stronger for the experience of the learning environment compared to the experience of the social environment. However, there are very few findings for the social environment. Thus, our research goal is to describe and compare students who are overestimated, underestimated, or accurately assessed by their teachers in terms of their cognitive abilities in their SEES in both the learning and social environment. Based on our literature review, our hypotheses were as follows:
-
1.
Students’ SEES of school differ depending on the TJA of the teachers judging their cognitive ability, such that: (a) overestimated students experience school more positively than accurately judged and underestimated students, and (b) accurately judged students experience school more positively than underestimated students. That is, the three TJA groups differ in their experiences of the learning environment and of the social environment in school with overestimated students reporting the best experiences, followed by accurately judged students, and underestimated students reporting the worst experiences.
-
2.
Differences in SEES between overestimated, accurately judged, and underestimated students are stronger for the experience of the learning environment than for the experience of the social environment.
For our research design, we used group comparisons (see Table 2) because the present study focuses on the description of different student groups. Group comparisons are more consistent with the person description approach whereas regression models are consistent with a variable-centered approach. Controlling the potential confounds in group comparisons can be achieved by matching students on relevant variables with statistical methods like PSM. The PSM approach has several strengths regarding our study aims: as overestimated, underestimated, and accurately judged students cannot be randomly assigned to these groups, PSM allows for a quasi-experimental design. Further, instead of comparing all students, PSM compares only those that are particularly similar, which reduces biased estimates. Finally, PSM overcomes potential weaknesses in the regression approach: First, a causal direction has to be chosen, which is only partially suitable for cross-sectional data and, moreover, does not fit the student description approach of the present study. Second, in a regression, only the variance in the dependent variable (e.g., SEES) that has not already been explained by other covariates can be explained by the predictor variables. That is, when including possible confounds in regression models as covariates, we would only explain partial variability in students’ SEES. This problem can be circumvented by PSM through matching students with regard to their teacher, classroom, cognitive ability, gender, parental background, and their teacher’s acquaintance with them. Matching for cognitive ability is crucial in order to only investigate relations with TJA and students’ SEES without potential cognitive ability differences between students. Further, several studies have found that teacher judgments vary by student gender (e.g., Bergold et al., 2021; Golle et al., 2023; Lavrijsen & Verschueren, 2020), level of parental education, and language background (Alvidrez & Weinstein, 1999; Baudson et al., 2016a; Bergold et al., 2021; Gnas et al., 2022b; Golle et al., 2023; Wollschläger, 2016), and teachers’ acquaintance with a student (Baudson et al., 2016a; Gnas et al., 2022b), which can all be matched with PSM. The matched groups were then compared using linear discriminant analyses, which allowed the investigation of students’ SEES as a multidimensional profile of their experiences of the learning environment and the social environment.
2 Method
2.1 Sample
The sample originated from Project THINK, which is associated with the chair of giftedness research and education at the University of Trier, Germany. Within the project, an intelligence test for primary school students was developed (THINK 1–4; Baudson et al., 2016). The norm sample of THINK 1–4 included N = 2850 students (Grades 1 to 4) from 209 classrooms in 70 German schools, as well as their teachers and parents. They constitute a quasi-representative cross-sectional sample of students at public primary schools in Germany. Data collection was conducted between September 2012 and February 2014. In addition to the assessment of cognitive abilities, the students, teachers, and parents filled out self-report questionnaires. Detailed information on data collection and the composition of the sample can be found in the THINK 1–4 manual (Baudson et al., 2016). Since the analyses of this study represent secondary analyses of the data, approval by the University of Trier IRB was not required.
After the data preparation (see below), the full sample included N = 1516 students (12.7% in Grade 1, 21.8% in Grade 2, 19.0% in Grade 3, and 46.4% in Grade 4) from 32 schools and 119 classrooms. Of the students, 48.8% were girls and 51.2% were boys, with an average age of M = 8.50 years (SD = 1.28).
In addition to the student sample, data from 119 teachers were used, of whom 89.4% were female and 10.6% were male, with an average age of M = 41.88 years (SD = 11.56) and an average work experience of M = 14.26 years (SD = 11.18). The teacher sample is representative in terms of age and gender distribution of the German teacher population (88.5% female primary school teachers; Statista, 2023a; 68% teachers between 30 and 54 years; Statista, 2023b).
2.2 Propensity score matching
To minimize the impact of relevant covariates (i.e., students’ cognitive ability, gender, language, parental education, and teacher acquaintance with them), we balanced these variables between the three TJA groups (i.e., overestimated, accurately judged, and underestimated students) using PSM (Rosenbaum & Rubin, 1983, 1984). In the process, original group subsamples are compared and matched on relevant covariates (i.e., matching variables), reducing original group sample sizes. The goal is to create a selected constellation of grouped triplets showing high equivalence in a composite measure representing all matching variables. The propensity score (PS), a person’s conditional probability of belonging to one of the index groups given their individual set of matching variable scores, has proven to be a reliable composite measure for matching procedures (Gu & Rosenbaum, 1993; Li, 2013).
Our PSM procedure consisted of three steps. In step one, we estimated boosted regression PSs (cf., McCaffrey et al., 2004) representing individual conditional probabilities pertaining to Group 1 (overestimated students) for all study participants given their cognitive ability, gender, language, parental education, as well as a score indicating teacher acquaintance with the student. This was achieved by using the twang-package (version 2.5; Ridgeway et al., 2015) in R statistics (4.2.0; R Core Team, 2021).
In step two, we applied a matching algorithm called the MAny-Group-MAtching-algorithm (MAGMA; Urban et al., 2023, 2024), which is uniquely capable of matching individuals from two or more groups. With previously estimated PSs as input, MAGMA iteratively matches triplets that have the lowest Mahalanobis distance scores regarding these PSs. This iterative procedure is repeated until all cases from the group with the lowest sample size (in this case Group 2, accurately judged students, n = 286) are matched. Meanwhile, MAGMA extracts the iteration of matching, the respective distance, and a weight for inclusion. We conducted step two a second time, adding the restriction of matching only individuals in the same classroom (i.e., exact matching) to acknowledge potential class-level context influences (i.e., to control for the nested data structure of students grouped in the same classes and, accordingly, judged by the same teacher).
In step three, continuous and binary covariates (ν = 4; language was dismissed from the balance assessment, as it only has nominal measurement properties) formed the input for balance estimation. Using the extracted step-variable and starting with a minimum sample size of n = 20 per group, we increased the sample size iteratively to find the optimal model considering balance and sample size. To do this, we compared the balance of all possible models with 20 \( \le \)n\( \le \)286 per group. Balance estimation builds on pairwise standardized mean differences (Cohen’s d), Pillai’s trace from a MANOVA across all covariates, and an average effect of absolute standardized mean differences (mean g) extracted with meta-analytical techniques (Fisher et al., 2017; Viechtbauer, 2010). The number of effects (Cohen’s d) smaller than a conventionally small effect (i.e., d < 0.20; Cohen, 1988) served as our main criteria for judging the models. For Pillai’s trace and mean g, smaller values indicate a better balance.
The PSM process was conducted for both matching variants—(1) matching without restrictions and (2) exact matching including classroom. We applied the R packages psych (version 2.2.9.; Revelle, 2022) and robumeta (version 2.0; Fisher et al., 2017) for balance estimation.
2.2.1 Matched sample 1
In the first matched sample, we did not consider the nested data structure resulting from classroom membership (i.e., matching without restrictions model). Matched Sample 1 included n = 348 students (13.8% in Grade 1, 26.4% in Grade 2, 16.4% in Grade 3, and 43.4% in Grade 4) from 32 schools and 109 classrooms. Of the students, 53.3% were girls and 49.7% were boys with an average age of M = 8.44 years (SD = 1.28).
2.2.2 Matched sample 2
In the second matched sample, we considered the nested data structure (i.e., exact matching including classroom). Matched Sample 2 included n = 312 students (10.6% in Grade 1, 21.2% in Grade 2, 21.2% in Grade 3, and 47.1% in Grade 4) from 28 schools and 69 classrooms. Of the students, 56.4% were girls and 43.6% were boys with an average age of M = 8.60 years (SD = 1.24).
2.3 Measures
2.3.1 Socio-emotional experiences of school
Students’ SEES were measured by the FEESS-K (Baudson & Preckel, 2015) which comprises a short-version of the FEESS (Fragebogen zur Erfassung emotionaler und sozialer Schulerfahrungen von Grundschulkindern; in English ‘Questionnaire for the Assessment of Emotional and Social School Experiences of Primary School Children’) by Rauer and Schuck (2003, 2004). The validity of the FEESS has been demonstrated in Baudson et al. (2016), Rauer and Schuck (2003, 2004), Scherrer et al. (2016), and Schmidt et al. (2017). The validity of the FEESS-K was shown in Gnas et al. (2022a).
Experiences of the learning environment were assessed with the following scales: academic self-concept (e.g., ‘I do well in school’), joy of learning (e.g., ‘I enjoy learning’), attitude towards school (e.g., ‘I like to go to school’), and willingness to make an effort (e.g., ‘I do my best in school’). Experiences of the social environment were assessed with the following scales: social integration (e.g., ‘My classmates are nice to me’), class climate (e.g., ‘In the class, we all stick together’), and feeling of being accepted (e.g., ‘My teachers have time for me’). Each scale had 3 items, which were answered on a 3-point visual scale with a laughing smiley (= 2), a neutral smiley (= 1), and a sad smiley (‘frowny face’; = 0). Additionally, the scale points were verbally anchored as ‘yes, that’s actually always true’, ‘that’s sometimes true, sometimes not’, and ‘no, that’s not quite true’.
2.3.2 Teacher judgments of cognitive ability
The scale for measuring teacher judgments of students’ cognitive ability was developed within the THINK project. The validity of the scales has been demonstrated in prior studies (Baudson et al., 2016a; Bergold et al., 2021; Gnas et al., 2022b). Teachers judged their students’ cognitive ability on a rating scale with six items which describe student behaviors as indicators of general cognitive ability. The items are translated from the original German wording, for example: ’understands new learning content quickly’, ‘can remember most things the first time’, ‘recognizes connections very quickly’. The items were rated on a six-point Likert scale (1 = not correct at all, 6 = fully correct).
2.3.3 Teacher judgment accuracy
Absolute TJA was measured by the z-standardized residuals of the regression of students’ cognitive ability (see below) on teachers’ judgment of students’ cognitive ability. While some other studies on TJA calculated the regression in the opposite direction (e.g., Gentrup et al., 2020), the regression in this study was calculated in the direction described because it corresponds to the content of the construct TJA (i.e., how predictive are teachers’ judgments of students’ cognitive ability of students’ actual cognitive ability?). This further ensured the comparability of our findings with previous studies of TJA using the same dataset (Gnas et al., 2022a, b; Wollschläger, 2016). A residual of 0 corresponds to an accurate judgment, residuals > 0 indicate underestimation (i.e., higher cognitive ability than predicted by the teacher judgment) and residuals < 0 indicate overestimation (i.e., lower cognitive ability than predicted by the teacher judgment).
2.3.4 Cognitive ability
Students’ cognitive ability was measured by the THINK 1–4 (Baudson et al., 2016). The test estimates the general cognitive ability of children in Grades 1 to 4 and consists of 36 items. There are three subdimensions: figural reasoning (e.g., recognizing and applying regularities in graphic figures; three subscales), verbal reasoning (e.g., selecting an image that matches a word; two subscales) and numerical reasoning (e.g., completing incomplete number series; three subscales). The internal consistency in the norm sample was α = 0.77 to 0.82 (depending on the grade level). It is standardized and provides an IQ score (M = 100, SD = 15) for overall test performance. The factor structure could be confirmed by confirmatory factor analyses. Moreover, the test has good internal validity (strong correlation with other intelligence tests, e.g., Wechsler Intelligence Scale for Children, Petermann, F. & Petermann, U., 2011) and criterion-related validity (e.g., positive relations to school grades and their development).
2.3.5 Language and parental educational attainment
Students’ native language was assessed in the parents’ questionnaire, differentiating between three categories: ‘only German’, ‘German and another language’, and ‘only another language’. Furthermore, parents’ highest educational attainment was assessed with 1 = ‘no graduation from secondary school’, 2 = ‘graduated from lowest secondary level’, 3 = ‘graduated from intermediate secondary level’, 4 = ‘graduated from highest secondary level’, 5 = ‘degree in tertiary education’, 6 = ‘doctoral degree.’ Only the highest educational attainment within each parent couple was reported.
2.3.6 Teacher acquaintance with the student
Teacher acquaintance with the student was measured in the teacher questionnaire by a single item (‘How well do you know the child?’) on a five-point Likert scale (1 = virtually not, 5 = very well).
2.3.7 Gender
The students provided information on their gender during the testing process. It was collected binarily (1 = girl, 2 = boy).
2.4 Data analyses
2.4.1 Data preparation
To prepare the data, we used SPSS version 25.0 (IBM, 2021) and Mplus version 8.4 (Muthén & Muthén, 1998–2019). First, we calculated scale scores when at least 70% of the items for that scale were answered. After this step, only cases without missing values on the main variables necessary to calculate TJA (i.e., ‘cognitive ability’ and ‘teacher judgment of student cognitive ability’) were retained within the sample. Furthermore, we deleted cases with missing values on the covariates for PSM.
2.4.2 Reliability estimation
We estimated reliability for our scales measuring the socio-emotional experiences of school and for the scale measuring the teacher judgments of cognitive ability. As a first indicator, we estimated Cronbach’s alpha (α). Cronbach’s alpha has some prerequisites such as tau equivalence, uncorrelated residuals, and normally distributed items (McNeish, 2018). Therefore, we also estimated the greatest lower bound (GLB; McNeish, 2018; Trizano-Hermosilla & Alvarado, 2016) and Raykov’s omega (ω; Raykov, 1997) as reliability indicators with less stringent assumptions. We used confirmatory factor analysis (CFA) to estimate Raykov’s omega and to test whether essential tau equivalence holds. Further model information and the results of the CFA are included in Appendix B (supplementary materials).
2.4.3 Underestimated, accurately judged, and overestimated students
In previous studies, different cut-offs were chosen for accurate vs. inaccurate teacher judgments. Some researchers argued that any value different from the actual cognitive ability constitutes inaccurate judgments (e.g., Urhahne et al., 2011; Zhou & Urhahne, 2013). Others specified specific cut-off values, for example, inaccuracies of at least 0.25 SD (e.g., De Boer et al., 2010) or 0.5 SD (e.g., Urhahne, 2015). We set the cut-off at 0.25 SD, as, on the one hand, teachers cannot be expected to always judge their students perfectly (Urhahne, 2015); on the other hand, slight inaccuracies need to be treated as such (De Boer et al., 2010). Hence, our three TJA groups were z < -0.25 (overestimated students), z = − 0.25 to 0.25 (accurately judged students), and z > 0.25 (underestimated students).
2.4.4 Linear discriminant analyses
We used the matched data to calculate linear discriminant analyses in SPSS version 25.0 (IBM, 2021). The method has the advantage of examining students’ SEES in the form of a multidimensional profile of student experiences rather than comparing students on individual dimensions. First, the results show the extent to which the linear combination of all SEES dimensions discriminates between n = 3 TJA groups (overestimated students, accurately judged students, underestimated students)—in other words, the extent to which the groups differ in their experiences related to the learning and social environment (Hypothesis 1). Secondly, the results show the relative importance of each dimension within the linear combination for the discriminant function—in other words, the contribution of each dimension to the differentiation of underestimated vs. accurately judged vs. overestimated students (Hypothesis 2). Altogether, n-1 discriminant functions are calculated in each analysis (i.e., 2 functions). The second function explains the variance that is not explained by the first function and therefore does not necessarily have to be significant to interpret the results (see Rudolf & Buse, 2020).
We carried out the discriminant analysis for each PSM sample. The quality of the linear discriminant analyses was tested by the following parameters (Backhaus et al., 2015): The Eigenvalue 𝛾 indicates the relation of explained to unexplained variance. The canonical correlation c indicates how much of the total variance of the discriminant values can be explained by the discriminant function. Both values (𝛾 and c) are to be as large as possible. Wilks-Lambda (Λ) describes the relation of unexplained variance to total variance; subsequently, small values correspond to high discriminant qualities of the discriminant function. The inferential statistical χ2 test demonstrates whether the linear combination significantly determines the group differences between overestimated versus accurately judged versus underestimated students. Finally, the overall classification rate reveals the assignment accuracy to the three TJA groups by the linear combination of students’ SEES.
3 Results
3.1 Descriptive statistics
Missing values for the dimensions of SEES were ≤ 2.50%, with the exception of joy of learning (4.12%) and feeling of being accepted (4.19%). Descriptive statistics of the continuous variables can be found in Table 4. There were no meaningful differences from the overall norm sample (see last column in Table 4). Data were normally distributed, except for willingness to make an effort, which was left-skewed. Reliability was acceptable to excellent for most of the scales (except for two scales: willingness to make an effort and class climat
Bivariate correlations with corrected standard errors for all analysis variables for the full study sample are reported in Table 5. All dimensions of the SEES correlated positively with each other (r = .18 to .71, p < .01). Teacher judgments of students’ cognitive ability positively correlated with almost all variables. TJA correlated weakly or not significantly with the dimensions of the SEES (all correlations < .10). Moreover, TJA strongly correlated with students’ cognitive ability (r = .82, p < .01) and slightly correlated with parental education (r = .17, p < .01). This means that low cognitive ability and lower parental education was more likely associated with overestimation, whereas high cognitive ability and higher parental education was more likely associated with underestimation.
3.2 Propensity score matching
3.2.1 Balance estimation
Relative influences of matching covariates on the PSs were 95.86% for students’ cognitive ability, 2.89% for parental education, 0.94% for teacher acquaintance with the student, 0.23% for students’ gender, and 0.07% for students’ native language. Table 6 shows balance criteria for the different matching solutions. For both the unrestricted (Sample 1) and the exact matching approach (Sample 2), the best d/max d model was preferable. This model reduced (almost) all pairwise effects below the threshold of a small effect size (d < 0.20), showed comparable balance on other estimates, but excelled in having a considerably larger sample size per group compared to the best mean g or the best Pillai’s trace solutions. Thus, the selected analytic sample consisted of n = 348 for matching without restrictions and n = 312 for exact matching. Further statistics regarding the sample and the balance are reported in Appendix A.
3.2.2 Subsample comparisons
Table 7 shows the central tendency and dispersion for all matching covariates, including subsample comparisons using appropriate standardized difference values according to the respective scale of measurement (Sedlmeier & Renkewitz, 2013). In the full study sample, students in the three TJA groups differed in their cognitive ability, with large effect sizes (d = -1.34 to -2.47). Underestimated students on average had the highest cognitive ability (M = 114.86, SD = 10.69), accurately judged students were in the middle (M = 102.17, SD = 8.58), and overestimated students had the lowest cognitive ability (M = 89.54, SD = 9.77). Moreover, students differed in their native language and their parental education, with small effect sizes (w = 0.24 to 0.25, d = -0.38). Overestimated students showed a lower proportion of German native speakers compared to other languages (73.9%) than accurately judged (81.1%) or underestimated students (80.7%). Furthermore, overestimated students had a lower parental education (M = 3.66, SD = 1.14) compared to underestimated students (M = 4.11, SD = 1.21).
Overall, appropriate balance was achieved by PSM. In matched Sample 1, all differences in students’ cognitive ability were smaller than 0.10. We found some small differences in students’ native language (w = 0.29): accurately judged students were more often German native speakers compared to underestimated students. In matched Sample 2, two pair comparisons exceeded the target value for Cohen’s d: underestimated students had a higher cognitive ability than accurately judged (d = -0.55) and overestimated (d = -0.73) students.
3.3 Linear discriminant analyses
3.3.1 Assumptions
We tested the assumptions of linear discriminant analyses by bivariate correlations (independence), boxplots (outliers), and histograms (normal distribution) of the dimensions of SEES (Büyüköztürk & Çokluk-Bökeoğlu, 2008). There was no multicollinearity in either matched sample (r ≤.65Sample 1, r ≤.71Sample 2). Furthermore, in both samples, three dimensions had no outliers (academic self-concept, attitude towards school, class climate), and the other dimensions had one to ten outliers. Finally, all distributions visually appeared skewed to the left. However, we only identified critical skewness and kurtosis values for willingness to make an effort both in Sample 1 (skewness = -2.15, SE = 0.13; kurtosis = 5.52, SE = 0.26) and Sample 2 (skewness = -2.15, SE = 0.14; kurtosis = 4.78, SE = 0.28).
3.3.2 Main analyses
Due to their low reliability, we conducted the linear discriminant analyses with and without (see Appendix C, supplementary materials) the variables willingness to make an effort and class climate. There were no meaningful statistical differences in the findings: in both cases, the χ2 test was significant for discriminant function 1 but not for discriminant function 2. Further, the correlations within the structure matrix were very similar (see Table 10 and Table C.2). Finally, the quality parameters of both analyses (see Table 8 and Table C.1) were very similar (i.e., 𝛾 = Eigenvalue, which indicates the ratio of explained to unexplained variance; c = canonical correlation, which indicates how much variance can be explained by the discriminant function; Λ = Wilks-Lambda, which describes the ratio of unexplained to total variance; % correct classification, which indicates the assignment accuracy to the groups). In the following, we therefore report the results of the analyses calculated with all variables.
Table 8 shows that the linear combination of all dimensions of SEES significantly determined differences between the three TJA groups for both matched samples (Hypothesis 1). Only discriminant function 1 was significant. Quality parameters were acceptable and very similar in both matching samples, with a slightly higher correct classification rate in Sample 1 compared to Sample 2 (45.0 vs. 42.0%). Within the three TJA groups, overestimated and underestimated students had the highest classification rates (Sample 1: 61.5 and 56.3%; Sample 2: 51.5 and 46.5%).
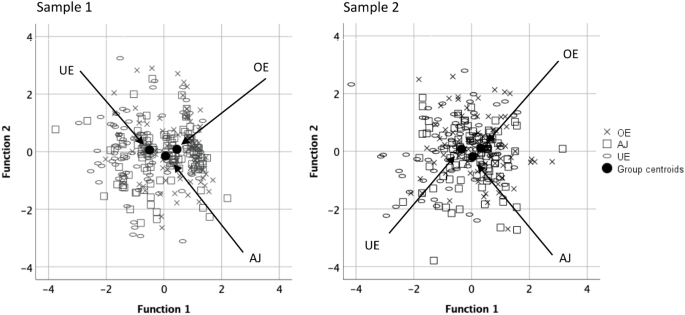
Discriminant functions at group centroids and discriminant values for the three TJA groups. Note OE = overestimation, AJ = accurate judgment, UE = underestimation
In order to take a closer look at differences between the three TJA groups, we calculated discriminant function 1 at group centroids (i.e., the mean of the discriminant function scores by group; see Table 9; Fig. 1). Greater differences in values represent greater differences between the groups. Discriminant values and the group centroid of discriminant function 1 were on the negative side for underestimated students, in the middle for accurately judged students, and on the positive side for overestimated students. In both matched samples, differences between accurately judged students and overestimated students were similar to those for accurately judged students and underestimated students. In contrast, there were substantially larger differences between overestimated and underestimated students. To examine the direction of differences, we calculated the structure matrix (see Table 10). It shows the correlation of each dimension with discriminant function 1. All dimensions showed positive correlations, implying that more positive scores on the dimensions of SEES were associated with more positive scores on discriminant function 1—this means that positive scores were closest to overestimation, less close to accurate judgments, and least close to underestimation (see Fig. 1). Given the significant difference between the three TJA groups (see Table 8), the SEES of school were more positive for overestimated compared to accurately judged students and underestimated students (Hypothesis 1a) and more positive for accurately judged students compared to underestimated students (Hypothesis 1b).
The next step was considering the relative importance of the dimensions of SEES for the discriminant function (i.e., dimensions on which students differed; Hypothesis 2). High correlations within the structure matrix (see Table 10) indicate a high relative importance of the dimension for the classification. In line with the effect size classification used to present the studies in Table 3, we considered medium and large correlations (r ≥.3 or close to 0.3) as important for the classification (Cohen, 1988). Students’ academic self-concept was most important in determining differences between the three groups of TJA (both samples; r = .965 or .740). Willingness to make an effort also considerably contributed to the group discrimination (both samples; r = .406 or .577). Furthermore, in both samples, joy of learning and feeling of being accepted made an important contribution, however, with some slight differences between the samples. In Sample 1, the joy of learning had a higher relative importance than the feeling of being accepted (r = .407 vs .277); in Sample 2, the reverse pattern was present (r = .297 vs .413). The other variables (i.e., attitude towards school, social integration, and class climate) did not contribute meaningfully.
Figure 2 shows the characteristic profiles (based on z-standardized group means) for students in the three TJA groups (compact bars = experience of the learning environment, striped bars = experience of the social environment). In both samples, overestimated students experienced school more positively than the average of all students, whereas accurately judged students lay in the middle, and underestimated students experienced school more negatively than the average of all students. This pattern was also evident for the individual dimensions that emerged as particularly important within the linear discriminant analyses (academic self-concept and willingness to make an effort). For the joy of learning, differences descriptively existed between overestimated and accurately judged or underestimated students but less between accurately judged and underestimated students. Overestimated students had an above-average enjoyment of learning, whereas accurately judged and underestimated students lay near the average. For the feeling of being accepted, differences descriptively existed between underestimated and accurately judged or overestimated students but less between overestimated and accurately judged students. Underestimated students felt less accepted by their teachers than the average, whereas accurately judged and overestimated students lay near the average. Altogether, the results show that differences between overestimated, accurately judged, and underestimated students are stronger for dimensions of the experience of the learning environment (differences for the academic self-concept, willingness to make an effort, and joy of learning) than for dimensions of the experience of the social environment (differences found only for the feeling of being accepted; Hypothesis 2).
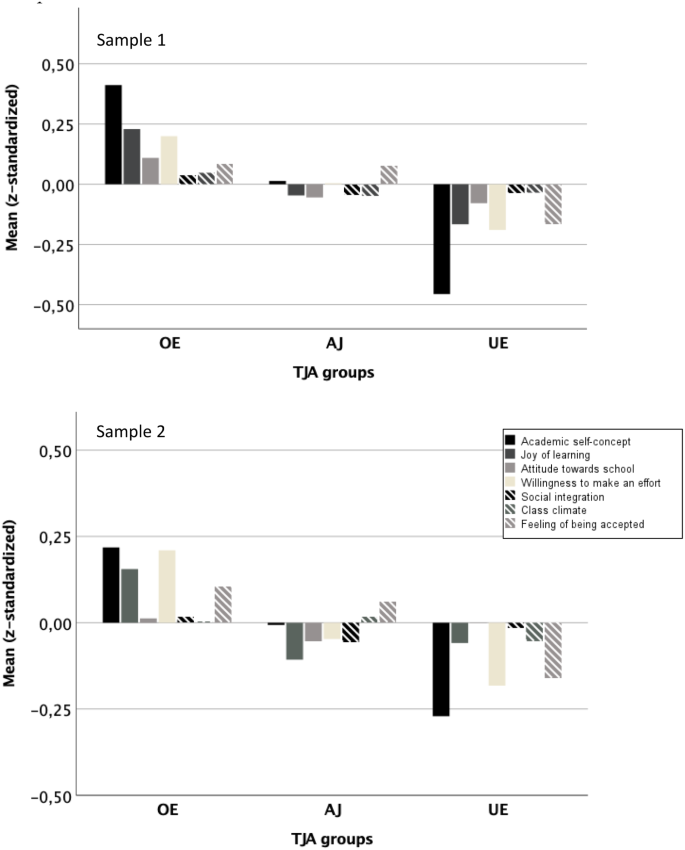
Characteristic profiles (based on z-standardized group Means) for students of the three TJA groups. Note OE = overestimation, AJ = accurate judgment, UE = underestimation
4 Discussion
4.1 Summary
In the present study, we investigated whether students differed in their SEES depending on the TJA of their cognitive ability. Furthermore, within the characteristic profile of various dimensions of SEES, we investigated whether possible differences were stronger for the experience of the learning environment compared to the experience of the social environment. We controlled possibly confounding variables by using PSM, which enables building groups of students who are comparable regarding these variables. Groups of overestimated, accurately judged, and underestimated students were then compared by linear discriminant analyses.
In line with Hypothesis 1, we found that students who were overestimated in their cognitive ability had more positive SEES than students who were accurately judged or underestimated (Hypothesis 1a), and students who were accurately judged had more positive SEES compared to students who were underestimated (Hypothesis 1b). In line with Hypothesis 2, we found that the three TJA groups especially differed in their academic self-concept, their willingness to make an effort, and their joy of learning (which are dimensions of the experience of the learning environment), but also, and not as expected, in their feeling of being accepted by teachers (which relates to the experience of the social environment). We found no substantial differences in students’ attitude towards school, social integration, and perceived class climate.
4.2 Matching samples
We compared overestimated, accurately judged, and underestimated students who were comparable in their cognitive ability, gender, parental background, and their teachers’ acquaintance with them. We used PSM to match students on these potentially confounding factors. In research on over- and underestimated students, PSM has not been used before. In general, few studies have (systematically) controlled for confounding factors (e.g., Gniewosz & Watt, 2017; Urhahne, 2015; see Table 3). Compared to regression analysis or analysis of variance, PSM has the particular strength that information on common variance of covariates is preserved.
Two samples were created, with one that ignored the nested structure of the data (Sample 1) and one that additionally matched students based on their classroom (Sample 2). Both of the resulting matching samples had strengths and limitations. There were no relevant differences between students of the three TJA groups in almost all matching covariates in Sample 1. However, the process did not control for the possible influence of the class context or the judging teacher. By contrast, Sample 2 considered this limitation, but students of the three TJA groups still differed in their cognitive ability with underestimated students having higher cognitive abilities than accurately judged or overestimated students.
4.3 How are students’ socio-emotional experiences of school related to teachers’ judgment accuracy?
There were no differences in findings between the matching samples with regard to Hypothesis 1. That is, findings were robust, with and without controlling for the nested data structure. Our findings with respect to Hypothesis 1 are well aligned with previous studies on SEES depending on TJA. Most studies compared students who were overestimated and underestimated in their achievement. The studies robustly suggest that overestimated compared to underestimated students are at advantage with respect to their SEES (e.g., Rubie-Davies & Peterson, 2016; Urhahne, 2015; Urhahne et al., 2010). Our findings are also well aligned with findings showing that overestimation is not only more beneficial than underestimation, but also more beneficial than accurate judgments— and that accurate judgments are more beneficial than underestimation for students’ SEES (Baudson, 2011; Gentrup et al., 2020). The findings are also consistent with studies showing a relation between students’ achievement and TJA, which demonstrated that overestimated compared to underestimated students have a higher academic achievement (Baudson, 2011; Gentrup et al., 2020; Rubie-Davies et al., 2014; Rubie-Davies & Peterson, 2016; Urhahne, 2015) and develop more positively in their achievement (De Boer et al., 2010; Stang & Urhahne, 2016). Furthermore, in a longitudinal study by Rubie-Davies et al. (2020), TJA at class level predicted students’ academic achievement and their perceived teacher support (higher values for students in overestimated compared to underestimated classrooms).
One plausible explanation for these findings is the self-fulfilling prophecy—a false definition of the situation evoking a behavior which makes the original false expectation come true (Merton, 1948). This explanatory approach relates to the so-called expectation effects, which have often been studied in connection with achievement outcomes. In their systematic review, Wang et al. (2018) found that in primary and secondary schools, positive teacher expectations for students’ achievement were mostly associated with positive concurrent and future student outcomes. This included achievement outcomes, psychosocial outcomes such as students’ self-concept and academic motivation, and other school-related behavioral outcomes. The findings on the relation between teacher expectations and psychosocial outcomes are also in line with the above described 6-step teacher-student interaction model by Brophy and Good (1970) and Brophy (1983).
Teacher expectation effects imply reciprocal effects between TJA and students’ SEES over time. Findings of two longitudinal studies found that initial TJA influenced change in students’ SEES (Baudson, 2011; Gniewosz & Watt, 2017). At the same time, a teacher’s perception of a student’s SEES might affect the teacher’s judgment of that student’s abilities. In line with this assumption, Gnas et al. (2022a) found that teachers judged comparable students’ cognitive abilities higher for those students who had higher academic self-concepts. Similarly, in their review, Wang et al. (2018) found that socio-psychological factors such as self-concept, self-efficacy, and self-expectations partially mediated teacher expectation effects on academic achievement.
Overall, our results imply that, similar to TJA of achievement (e.g., Urhahne, 2015;Urhahne et al., 2010, 2011), students differ depending on whether they are overestimated, accurately judged, or underestimated in their cognitive ability by their teachers. Our findings support the assumption that overestimation is more beneficial than accurate judgments and that underestimation has the most negative effects.
4.4 Experience of the learning versus social environment
The results of the present study revealed that students who were overestimated, accurately judged, and underestimated in their cognitive ability, especially differed in their academic self-concept, willingness to make an effort, joy of learning, and feeling of being accepted by their teachers. That is, and in accordance with Hypothesis 2, TJA was primarily related to the experience of the learning environment and less related to the experience of the social environment. Students differed most in their academic self-concept compared to other dimensions of the learning environment (for similar findings, see Baudson, 2011; Urhahne, 2015; Urhahne et al., 2010; Urhahne et al., 2011). These findings might be explained by the fact that the teacher judgments referred to an achievement- and learning-related construct (i.e., cognitive ability) and not to social variables such as social competence or popularity. Therefore, possible effects of TJA should be seen more strongly in students’ achievement- and learning-related experiences.
However, and not as expected, overestimated or accurately judged and underestimated students also differed in their feeling of being accepted by their teacher among students in Sample 2, but not in Sample 1. In Sample 2, students who were underestimated felt less accepted by their teachers than the other groups. These students also had higher cognitive abilities than the other groups. How can one explain the different findings between the two matching samples for the feeling of being accepted by the teacher? In Sample 1, differences between teachers in their individual propensity to give their students the feeling of being accepted—independently of over- or underestimating individual students’ cognitive ability—might have masked differences between the three TJA student groups. When controlling for this between-teacher variability, more cognitively able students who were underestimated by their teachers felt less accepted. This finding might indicate that for more cognitively able students, the acknowledgement of their cognitive ability is especially important for their feeling of acceptance by others. However, this interpretation has to be treated with caution as it is only done a posteriori and the finding could alternatively be explained by statistical differences (e.g., larger variability of cognitive abilities in Sample 2). A more complex explanation could be derived from Self-Determination Theory (Deci & Ryan, 1985), according to which the needs for competence, autonomy, and relatedness determine individuals’ motivation and actions. Students who feel accepted by their teachers are more likely to engage in actions that they believe will be evaluated positively by the teacher. For example, they exert themselves, participate in lessons, and work conscientiously. This might tempt teachers to overestimate these students’ abilities. In contrast, students who feel less accepted by their teacher might engage less in actions that are positively evaluated by their teachers. This might tempt teachers to underestimate these students. However, these assumptions are rather speculative and need further testing with longitudinal data.
4.5 Practical implications
Our findings clearly demonstrated that primary school students who were underestimated in their cognitive ability were at a disadvantage in terms of their SEES compared to primary school students who were accurately judged and those who were overestimated. Although no causal effects of TJA on students’ SEES can be tested by the present cross-sectional findings, the link between TJA and SEES implies that there is a need to pay closer attention to underestimated students and to support and encourage them in their SEES if necessary.
To become aware of misjudgments in the first place, an important implication for teachers is to reflect on one’s own judgment accuracy. A procedure based on a 5-step diagnostic cycle by Wahl et al. (2007) is one option for this. (1) In a first step, teachers choose a student characteristic they want to judge (e.g., achievement in mathematics). (2) Next, they predict this characteristic for their students (e.g., predicting their grade in the next mathematics test). (3) In a third step, they measure the chosen characteristic (e.g., grading the mathematics test). (4) Next, teachers compare their prediction with the result of the measurement. (5) In a final step, teachers reflect on the result, particularly with respect to discrepancies. In the event of misjudgments, teachers should ask themselves about reasons for these misjudgments. Are misjudgments (especially underestimation), for instance, due to student characteristics (e.g., their gender or native language)? Or, which assessment standards did I use (e.g., social vs. criterial reference norm)? A repeated use of this 5-step diagnostic cycle can also help to indicate improvements in TJA. The use of this tool should be accompanied by information on typical judgment errors, teacher expectation effects, and basic information on educational assessment.
In the present study, we used a primary school sample. This focus is relevant, as the primary school years are an important starting point for future academic and socio-emotional development (Aviles et al., 2006). Overall, the pattern of findings seems to be the same in primary and secondary school (see Table 3). Previous studies, however, mostly examined only Grade 4 in primary school (Urhahne et al., 2010, 2011; Zhou & Urhahne, 2013). Our findings suggest that TJA might play an important role for students’ SEES not only at this point in time but throughout the entire primary school years. Therefore, teachers should reflect on their own TJA as early as Grade 1.
Another important implication of the present study is that students should be supported in their SEES. The findings suggest that in particular underestimated students may need this support. The present findings specifically imply interventions for fostering students’ academic self-concept. Students’ experience of school and feedback with regard to their performance or achievement—especially from important reference persons such as teachers—influence the development of their academic self-concept (Moschner & Dickhäuser, 2018). Teachers can support their students’ academic self-concept by using an individual reference norm. For example, they can provide feedback on individual developmental progress, and they can adapt requirements to individual student competencies (e.g., providing tasks of varying difficulty). Furthermore, they can provide positive performance feedback related to effort rather than abilities, thus creating a sense of achievement. At the class level, teachers can support their students’ academic self-concept by establishing a positive classroom climate (e.g., through clear rules, a calm working atmosphere, and an appreciative culture of dealing with mistakes; Langenkamp, 2018; Trautwein & Möller, 2016). Prior research shows that social support and positive teacher-student interactions (Aviles et al., 2006; Hofmann & Siebertz-Reckzeh, 2008) contribute to more positive perceptions of the classroom climate as well as the development of socio-emotional competencies. A positive teacher-student relationship starts with the teacher and manifests in behaviors such as closeness, warmth, care, and support (Bouchard & Smith, 2017; Inman, 2019), as well as quantitative indicators, such as the amount of interaction with a specific student, and qualitative indicators, such as type and tone of feedback a teacher provides (see Endedijk et al., 2022).
It can be summarized that the present findings indicate on the one hand a need for action in terms of teachers’ reflection of their judgment accuracy and its improvement in the event of systematic underestimation. On the other hand, a practical implication for teachers is the importance of supporting students in their SEES, paying special attention to underestimated students.
4.6 Limitations
Although the present study has clear strengths, such as the large sample covering students in Grades 1 to 4, the assessment of multiple dimensions of students’ SEES, and the use of PSM that allowed us to compare the three TJA groups within a quasi-experimental design, our study also has limitations. One limitation concerns the cross-sectional analysis of the data. Although some of the findings are discussed causally, an actual causal interpretation of the findings is not possible. Another limitation concerns the fact that students’ school grade could not be added as a matching covariate, as it was not available in Grades 1 and 2. Furthermore, there was limited variance in students’ cognitive ability in the matched samples, because of the difficulty in finding matches for students from the more extreme cognitive ability groups who are also similar in all other matching covariates. In addition, two out of three Cohen’s d’s (for differences in students’ cognitive ability) in our creation of the three TJA groups in Sample 2 exceeded the desired value of 0.2, as it is unlikely to find overestimated, accurately judged, and underestimated students with similar cognitive abilities within one classroom. Nevertheless, PSM was able to considerably reduce the large Cohen’s d’s representing differences between overestimated, accurately judged and underestimated students of the full Sample (dfull sample = -1.34 to -2.47 vs. dSample 2 = -0.19 to -0.73). Furthermore, the strength of Sample 2 lies in accounting for the nested data structure. A further limitation relates to the rather moderate classification rate within linear discriminant analyses, which would probably have been larger if only overestimated and underestimated students were compared.
Moreover, two scales had low reliabilities (i.e., willingness to make an effort and class climate). Such low reliabilities are a known issue of short scales (Rammstedt & Beierlein, 2014; Ziegler et al., 2014), which often include comparatively heterogeneous items to retain content validity (Loevinger, 1954). However, reliabilities of the other short scales used in this study were acceptable to excellent. For the willingness to make an effort scale, its deviation from normality may result in Cronbach’s alpha underestimating the reliability (Sheng & Sheng, 2012; Xiao & Hau, 2023). For the class climate scale, its lack of essential tau-equivalence (see Table B.1; supplementary materials) may explain its low Cronbach’s alpha. When we estimated reliability with indicators less prone to deviations from normality and that do not assume tau-equivalence (i.e., GLB and Raykov’s omega), reliabilities of both scales only slightly increased to .60. However, excluding the scales class climate and willingness to make an effort from the analyses did not change the pattern of results. Furthermore, lower internal consistencies are acceptable if group differences—and not individual differences—are investigated (Nunnally & Bernstein, 1994).
Two final limitations concern the secondary analyses of the data as well as the representativity of the present sample in terms of students’ educational background and native language. Children with a migration background and children whose parents had lower school leaving certificates were underrepresented in the present sample (migration background: 22.1% in the present sample vs. 40.4% of all German primary school students; Federal Statistical Office, 2019; higher education degree: 35.8% in the present sample vs. 17.6% in the population, Federal Statistical Office, 2020).
4.7 Outlook and conclusion
Given the cross-sectional data, we described students’ characteristic profiles with regard to their SEES depending on whether they were overestimated, accurately judged, or underestimated by their teachers. It would be interesting to investigate the presumed direction of the effect of TJA on SEES in a longitudinal study. Additionally, it would be interesting to investigate the reciprocal effects of TJA and SEES. It is possible that overestimation and underestimation in the long term manifest themselves in a positive and negative spiral, respectively.
Overall, the present results suggest that primary school students who are overestimated in their cognitive ability by their teachers socio-emotionally experience school most positively, followed by students who are accurately judged. Students who are underestimated in their cognitive ability experience school most negatively and, most importantly, below the average of all students. We conclude that teachers’ attention in terms of the support of SEES might be directed especially to underestimated students. This particularly applies with regard to the experience of the learning environment and the feeling of being accepted by the teacher. Furthermore, the present results imply that teachers should assess and reflect on their TJA of cognitive ability. Encouragingly, inaccuracy only seems to be negative when directed toward underestimation. This suggests that teachers and researchers should focus primarily on reasons for underestimating students.
Notes
Academic achievement can be defined as “performance outcomes that indicate the extent to which a person has accomplished specific goals that were the focus of activities in instructional environments, specifically in school, college, and university.” […] (Steinmayr et al., 2014). It is mostly operationalized by school grades or standardized test performance. Cognitive ability can be defined as “any ability that concerns some kind of cognitive task” as “any task in which correct and appropriate processing of mental information is critical to successful performance” (Carroll, 1993, p.10). The relation between cognitive ability and academic achievement is high but far from perfect. Meta-analyses reveal 29% common variance for school grades (Roth et al., 2015) and 54% common variance for standardized achievement tests (Zaboski et al., 2018).
The studies used the following effect parameters: d (Urhahne et al., 2011), β (Baudson, 2011; Gniewosz & Watt, 2017), r (Rubie-Davies & Peterson, 2016), and η2p (Stang & Urhahne, 2016; Urhahne, 2015; Zhou & Urhahne, 2013). The categorization into different effect sizes was based on Cohen’s (1988) classification, according to which d ≥ 0.2 is regarded as a small effect, d ≥ 0.5 as a medium effect, and d ≥ 0.8 as a large effect. β, r, and η2p were converted correspondingly (Lenhard & Lenhard, 2016).
References
Alvidrez, J., & Weinstein, R. S. (1999). Early teacher perceptions and later student academic achievement. Journal of Educational Psychology, 91(4), 731–746. https://doi.org/10.1037/0022-0663.91.4.731.
Aviles, A. M., Anderson, T. R., & Davila, E. R. (2006). Child and adolescent social-emotional development within the context of school. Child and Adolescent Mental Health, 11(1), 32–39. https://doi.org/10.1111/j.1475-3588.2005.00365.x.
Backhaus, K., Erichson, B., Weiber, R., & Plinke, W. (2015). Diskriminanzanalyse [Discriminant analysis]. In K. Backhaus, B. Erichson, W. Plinke, & R. Weiber (Eds.), Multivariate Analysemethoden: Eine Anwendungsorientierte Einführung [Multivariate analysis methods: An application-oriented introduction] (14th ed., pp. 215–282). Springer. https://doi.org/10.1007/978-3-662-46076-4_5.
Baudson, T. G. (2011). The (mis-)measure of children’s cognitive abilities [Dissertation]. University of Trier, Trier.
Baudson, T. G., & Preckel, F. (2015). Der FEESS-K. Eine Kurzversion des FEESS von Rauer und Schuck zum Einsatz in Klassenstufe 1 bis 4 [A short version of FEESS for grades 1 to 4 by Rauer and Schuck] [Unpublished instrument]. University of Trier.
Baudson, T. G., Fischbach, A., & Preckel, F. (2016a). Teacher judgments as measures of children’s cognitive ability: A multilevel analysis. Learning and Individual Differences, 52, 148–156. https://doi.org/10.1016/j.lindif.2014.06.001.
Baudson, T. G., Wollschläger, R., & Preckel, F. (2016b). THINK 1–4: Test zur Erfassung der Intelligenz im Grundschulalter [THINK 1–4: Test for assessing intelligence at primary school age (1st edition)] (1st ed.). Hogrefe Schultests.
Baumert, J., & Kunter, M. (2011). Das Kompetenzmodell von COACTIV [The COACTIV competence model]. In M. Kunter, J. Baumert, W. Blum, U. Klusmann, Krauss, s., & M. Neubrand (Eds.), Professionelle Kompetenz von Lehrkräften: Ergebnisse des Forschungsprogramms COACTIV [Professional competence of teachers: results of the research program COACTIV] (pp. 29–56). Waxmann.
Bergold, S., Kasper, D., Wendt, H., & Steinmayr, R. (2020). Being bullied at school: The case of high-achieving boys. Social Psychology of Education, 23(2), 315–338. https://doi.org/10.1007/s11218-019-09539-w.
Bergold, S., Weidinger, A. F., & Steinmayr, R. (2021). The big fish from the teacher’s perspective: A closer look at reference group effects on teacher judgments. Journal of Educational Psychology, 114(3), 656–680. https://doi.org/10.1037/edu0000559
Bouchard, K. L., & Smith, J. D. (2017). Teacher-student relationship quality and children’s bullying experiences with peers: Reflecting on the mesosystem. The Educational Forum, 81(1), 108–125. https://doi.org/10.1080/00131725.2016.1243182.
Brophy, J. E. (1983). Research on the self-fulfilling prophecy and teacher expectations. Journal of Educational Psychology, 75(5), 631–661. https://doi.org/10.1037/0022-0663.75.5.631.
Brophy, J. E., & Good, T. L. (1970). Teachers’ communication of differential expectations for children’s classroom performance: Some behavioral data. Journal of Educational Psychology, 61(5), 365–374. https://doi.org/10.1037/h0029908.
Brunner, M., Keller, U., Dierendonck, C., Reichert, M., Ugen, S., Fischbach, A., & Martin, R. (2010). The structure of academic self-concepts revisited: The nested Marsh/Shavelson model. Journal of Educational Psychology, 102(4), 964–981. https://doi.org/10.1037/a0019644.
Büyüköztürk, Ş., & Çokluk-Bökeoğlu, Ö. (2008). Discriminant function analysis: Concept and application. Eurasian Journal of Educational Research, 33, 73–92.
Carroll, J. B. (1993). Human cognitive abilities: A survey of factor-analytic studies. Cambridge University Press.
Cohen, J. (1988). Statistical power analysis for the behavioral sciences (2nd ed.). Erlbaum.
De Boer, H., Bosker, R. J., & van der Werf, M. P. C. (2010). Sustainability of teacher expectation bias effects on long-term student performance. Journal of Educational Psychology, 102(1), 168–179. https://doi.org/10.1037/a0017289.
De Fruyt, F., Wille, B., & John, O. P. (2015). Employability in the 21st century: Complex (interactive) problem solving and other essential skills. Industrial and Organizational Psychology, 8(2), 276–281. https://doi.org/10.1017/iop.2015.33.
Deci, E., & Ryan, R. M. (1985). Intrinsic motivation and self-determination in human behavior. Spinger.
Eder, F. (2018). Schul- und Klassenklima [School and class climate]. In D. H. Rost, J. R. Sparfeldt, & S. Buch (Eds.), Handwörterbuch pädagogische Psychologie [Handbook of educational psychology] (5th ed., pp. 696–707). Beltz.
Emslander, V., Holzberger, D., Ofstad, S., Fischbach, A., & Scherer, R. (2023). Teacher-Student Relationships and Student Outcomes: A Systematic Review of Meta-Analyses and Second-Order Meta-Analysis. https://doi.org/10.31234/osf.io/qxntb.
Endedijk, H. M., Breeman, L. D., van Lissa, C. J., Hendrickx, M. M. H. G., den Boer, L., & Mainhard, T. (2022). The teacher’s invisible hand: A meta-analysis of the relevance of teacher-student relationship quality for peer relationships and the contribution of student behavior. Review of Educational Research, 92(3), 370–412. https://doi.org/10.3102/00346543211051428.
Federal Statistical Office (2019). Population and employment: Population with a Migration Background– Results of the 2018 Microcensus. https://www.destatis.de/DE/Themen/Gesellschaft-Umwelt/Bevoelkerung/Migration-Integration/Publikationen/Downloads-Migration/migrationshintergrund-2010220187004.pdf?__blob=publicationFile.
Federal Statistical Office (2020). Educational level. https://www.destatis.de/EN/Themes/Society-Environment/Education-Research-Culture/Educational-Level/_node.html.
Fisher, Z., Tipton, E., & Zhipeng, H. (2017). Robust variance meta-regression [R package robumeta version 2.0]. Comprehensive R Archive Network (CRAN). https://cran.r-project.org/web/packages/robumeta/index.html.
Fredricks, J. A., Blumenfeld, P. C., & Paris, A. H. (2004). School engagement: Potential of the concept, state of the evidence. Review of Educational Research, 74(1), 59–109. https://doi.org/10.3102/00346543074001059.
Gentrup, S., Lorenz, G., Kristen, C., & Kogan, I. (2020). Self-fulfilling prophecies in the classroom: Teacher expectations, teacher feedback and student achievement. Learning and Instruction, 66, 101296. https://doi.org/10.1016/j.learninstruc.2019.101296.
Gnas, J., Mack, E., Matthes, J., Breit, M., & Preckel, F. (2022a). Sozio-emotionales Erleben von Schule bei Grundschülerinnen und -schülern: Zusammenhänge mit intellektueller Begabung und Schulleistung [Primary school students’ socio-emotional experiences of school: Relations with students’ intellectual ability and school achievement]. Zeitschrift für Erziehungswissenschaft, 25, 1095–1123. https://doi.org/10.1007/s11618-022-01115-x
Gnas, J., Mack, E., & Preckel, F. (2022b). When classmates influence teacher judgment accuracy of students’ cognitive ability: Studying frame-of-reference effects in primary school. Contemporary Educational Psychology, 69,, 102070. https://doi.org/10.1016/j.cedpsych.2022.102070
Gniewosz, B., & Watt, H. M. G. (2017). Adolescent-perceived parent and teacher overestimation of mathematics ability: Developmental implications for students’ mathematics task values. Developmental Psychology, 53(7), 1371–1383. https://doi.org/10.1037/dev0000332.
Golle, J., Schils, T., Borghans, L., & Rose, N. (2023). Who is considered gifted from a teacher’s perspective? A representative large-scale study. Gifted Child Quarterly, 67(1), 64–79. https://doi.org/10.1177/00169862221104026.
Götz, T., Frenzel, A. C., & Pekrun, R. (2008). Sozialklima in der Schule [Social climate in school]. In W. Schneider, M. Hasselhorn, & J. Bengel (Eds.), Handbuch der Psychologie: Vol. 10. Handbuch der pädagogischen Psychologie [Handbook of edcuational psychology] (pp. 503–514). Hogrefe. http://kops.uni-konstanz.de/handle/123456789/1662.
Grewe, N. (2017). Soziale Interaktion und Klassenklima [Social interaction and class climate]. In M. K. Schweer (Ed.), Lehrer-Schüler-Interaktion. Inhaltsfelder, Forschungsperspektiven und methodische Zugänge [Teacher-child interaction. Content areas, research perspectives and methodological approaches] (3rd ed., pp. 547–560). Springer Fachmedien Wiesbaden. https://doi.org/10.1007/978-3-658-15083-9_24.
Gu, X. S., & Rosenbaum, P. R. (1993). Comparison of multivariate matching methods: Structures, distances, and algorithms. Journal of Computational and Graphical Statistics, 2(4), 405–420. https://doi.org/10.1080/10618600.1993.10474623.
Hattie, J. (2009). Visible learning: A synthesis of over 800 meta-analyses relating to achievement. Routledge.
Heller, S. S., Rice, J., Boothe, A., Sidell, M., Vaughn, K., Keyes, A., & Nagle, G. (2012). Social-emotional development, school readiness, teacher-child interactions, and classroom environment. Early Education & Development, 23(6), 919–944. https://doi.org/10.1080/10409289.2011.626387.
Hofmann, H., & Siebertz-Reckzeh, K. (2008). Sozialisationsinstanz Schule: Zwischen Erziehungsauftrag und Wissensvermittlung [Socialization instance school: Between educational mission and knowledge transfer]. In M. K. W. Schweer (Ed.), Lehrer-Schüler-Interaktion. Inhaltsfelder, Forschungsperspektiven und methodische Zugänge [Teacher-child interaction. Content areas, research perspectives and methodological approaches] (2nd ed., pp. 13–38). VS Verlag für Sozialwissenschaften. https://doi.org/10.1007/978-3-531-91104-5_1
Hoge, R. D., & Coladarci, T. (1989). Teacher-based judgments of academic achievement: A review of literature. Review of Educational Research, 59(3), 297–313. https://doi.org/10.3102/00346543059003297.
IBM. (2021). SPSS statistics for Windows, Version 28.0. IBM Corp.
Inman, C. (2019). Examining teacher-student relationships: Moving from bullying to caring [Dissertation]. Southern Illinois University Edwardsville, Edwardsville, IL.
Johns, S. (2020). Social competence growth in preschool: Individual differences and the role of classroom context [Dissertation]. Arizona State University, Tempe, AZ.
Jung, W., Thompson, H. J., & Byun, E. (2022). Social integration: A concept analysis. Nursing Forum, 57(6), 1551–1558. https://doi.org/10.1111/nuf.12843.
Korpershoek, H., Harms, T., De Boer, H., van Kuijk, M., & Doolaard, S. (2016). A meta-analysis of the effects of classroom management strategies and classroom management programs on students’ academic, behavioral, emotional, and motivational outcomes. Review of Educational Research, 86(3), 643–680. https://doi.org/10.3102/0034654315626799.
Košir, K., & Tement, S. (2014). Teacher–student relationship and academic achievement: A cross-lagged longitudinal study on three different age groups. European Journal of Psychology of Education, 29(3), 409–428. https://doi.org/10.1007/s10212-013-0205-2.
Lam, C. S., Yeung, P. P., & Yuen, M. T. (2018). Personal and environmental factors affecting Hong Kong high-ability students’ school satisfaction. Journal of Psychologists and Counselors in Schools, 28(2), 166–184. https://doi.org/10.1017/jgc.2017.18.
Langenkamp, I. (2018). Das akademische Selbstkonzept [The academic self-concept]. In I. Langenkamp (Ed.), Stärkung des kindlichen Selbstkonzepts [Strengthening the child’s self-concept] (pp. 25–36). Springer Fachmedien Wiesbaden. https://doi.org/10.1007/978-3-658-10231-9_4.
Lavrijsen, J., & Verschueren, K. (2020). Student characteristics affecting the recognition of high cognitive ability by teachers and peers. Learning and Individual Differences, 78, 101820. https://doi.org/10.1016/j.lindif.2019.101820.
Lei, H., Cui, Y., & Chiu, M. M. (2018). The relationship between teacher support and students’ academic emotions: A meta-analysis. Frontiers in Psychology, 8, 2288. https://doi.org/10.3389/fpsyg.2017.02288.
Lenhard, W., & Lenhard, A. (2016). Computation of effect sizes. https://www.psychometrica.de/effektstaerke.html.
Li, M. (2013). Using the propensity score method to estimate causal effects. Organizational Research Methods, 16(2), 188–226. https://doi.org/10.1177/1094428112447816.
Li, J., & Xue, E. (2023). Dynamic interaction between student learning behaviour and learning environment: Meta-analysis of student engagement and its influencing factors. Behavioral Sciences, 13(1), 59. https://doi.org/10.3390/bs13010059.
Likhanov, M. V., Tsigeman, E. S., Papageorgiou, K. A., Akmalov, A. F., Sabitov, I. A., & Kovas, Y. V. (2020). Ordinary extraordinary: Elusive group differences in personality and psychological difficulties between STEM-gifted adolescents and their peers. The British Journal of Educational Psychology, 91(1), 78–100. https://doi.org/10.1111/bjep.12349
Loevinger, J. (1954). The attenuation paradox in test theory. Psychological Bulletin, 51(5), 493–504. https://doi.org/10.1037/h0058543
Machts, N., Kaiser, J., Schmidt, F. T., & Möller, J. (2016). Accuracy of teachers’ judgments of students’ cognitive abilities: A meta-analysis. Educational Research Review, 19, 85–103. https://doi.org/10.1016/j.edurev.2016.06.003.
McCaffrey, D. F., Ridgeway, G., & Morral, A. R. (2004). Propensity score estimation with boosted regression for evaluating causal effects in observational studies. Psychological Methods, 9(4), 403–425. https://doi.org/10.1037/1082-989X.9.4.403.
McNeish, D. (2018). Thanks coefficient alpha, we’ll take it from here. Psychological Methods, 23(3), 412–433. https://doi.org/10.1037/met0000144.
Merton, R. K. (1948). The self-fulfilling prophecy. The Antioch Review, 8(2), 193–210. https://doi.org/10.2307/4609267.
Moschner, B., & Dickhäuser, O. (2018). Selbstkonzept [Self-concept]. In D. H. Rost, J. R. Sparfeldt, & S. Buch (Eds.), Handwörterbuch pädagogische Psychologie [Handbook of educational psychology] (5th ed., pp. 750–756). Beltz.
Muthén, L. K., & Muthén, B. (1998–2019). Mplus user’s guide (Eighth ed.). Muthén & Muthén.
Nocita, G., Perlman, M., McMullen, E., Falenchuk, O., Brunsek, A., Fletcher, B., Kamkar, N., & Shah, P. S. (2020). Early childhood specialization among ECEC educators and preschool children’s outcomes: A systematic review and meta-analysis. Early Childhood Research Quarterly, 53, 185–207. https://doi.org/10.1016/j.ecresq.2019.10.006.
Nunnally, J. C., & Bernstein, I. H. (1994). Psychometric theory (3rd ed.). McGraw-Hill.
Peter, F., & Dalbert, C. (2010). Do my teachers treat me justly? Implications of students’ justice experience for class climate experience. Contemporary Educational Psychology, 35(4), 297–305. https://doi.org/10.1016/j.cedpsych.2010.06.001.
Petermann, F., & Petermann, U. (2011). Wechsler Intelligence Scale for Children - IV (WISC-IV, German edition). Pearson.
Primi, R., Santos, D., John, O. P., & de Fruyt, F. (2021). Senna inventory for the assessment of social and emotional skills in public school students in Brazil: Measuring both identity and self-efficacy. Frontiers in Psychology, 12, 716639. https://doi.org/10.3389/fpsyg.2021.716639.
R Core Team. (2021). R: A language and environment for statistical computing (4.1.0). R Foundation for Statistical Computing.
Rammstedt, B., & Beierlein, C. (2014). Can’t we make it any shorter? The limits of personality assessment and ways to overcome them. Journal of Individual Differences, 35(4), 212–220. https://doi.org/10.1027/1614-0001/a000141.
Rantala, T., & Määttä, K. (2012). Ten theses of the joy of learning at primary schools. Early Child Development and Care, 182(1), 87–105. https://doi.org/10.1080/03004430.2010.545124.
Rauer, W., & Schuck, K. D. (2003). FEESS 3–4: Fragebogen zur Erfassung emotionaler und sozialer Schulerfahrungen von Grundschulkindern dritter und vierter Klassen: Manual [Questionnaire to assess emotional and social school experiences of third and fourth grade elementary school children: Manual]. Beltz Test GmbH.
Rauer, W., & Schuck, K. D. (2004). FEESS 1–2: Fragebogen zur Erfassung emotionaler und sozialer Schulerfahrungen von Grundschulkindern erster und zweiter Klassen: Manual [Questionnaire to assess emotional and social school experiences of first and second grade elementary school children: Manual]. Beltz Test GmbH.
Raykov, T. (1997). Estimation of composite reliability for congeneric measures. Applied Psychological Measurement, 21(2), 173–184. https://doi.org/10.1177/01466216970212006.
Ready, D. D., & Chu, E. M. (2015). Sociodemographic inequality in early literacy development: The role of teacher perceptual accuracy. Early Education & Development, 26(7), 970–987. https://doi.org/10.1080/10409289.2015.1004516.
Revelle, W. (2022). Procedures for psychological, psychometric, and personality research [R package psych version 2.2.9]. Comprehensive R Archive Network (CRAN). https://cran.r-project.org/web/packages/psych/index.html.
Ridgeway, G., McCaffrey, D., Morral, A., Burgette, L., & Griffin, B. A. (2014). Toolkit for weighting and analysis of nonequivalent groups: A tutorial for the R TWANG package. RAND Corporation.
Ridgeway, G., McCaffrey, D., Morral, A., Burgette, L., & Griffin, B. A. (2015). twang: Toolkit for weighting and analysis of nonequivalent groups. Comprehensive R Archive Network (CRAN). https://cran.r-project.org/web/packages/twang/index.html
Rosenbaum, P. R., & Rubin, D. B. (1983). The central role of the propensity score in observational studies for causal effects. Biometrika, 70(1), 41–55. https://doi.org/10.1093/biomet/70.1.41.
Rosenbaum, P. R., & Rubin, D. B. (1984). Reducing bias in observational studies using subclassification on the propensity score. Journal of the American Statistical Association, 79(387), 516–524. https://doi.org/10.2307/2288398.
Roth, B., Becker, N., Romeyke, S., Schäfer, S., Domnick, F., & Spinath, F. M. (2015). Intelligence and school grades: A meta-analysis. Intelligence, 53, 118–137. https://doi.org/10.1016/j.intell.2015.09.002.
Rubie-Davies, C. M., & Peterson, E. R. (2016). Relations between teachers’ achievement, over- and underestimation, and students’ beliefs for Māori and Pākehā students. Contemporary Educational Psychology, 47, 72–83. https://doi.org/10.1016/j.cedpsych.2016.01.001.
Rubie-Davies, C. M., Weinstein, R. S., Huang, F. L., Gregory, A., Cowan, P. A., & Cowan, C. P. (2014). Successive teacher expectation effects across the early school years. Journal of Applied Developmental Psychology, 35(3), 181–191. https://doi.org/10.1016/j.appdev.2014.03.006.
Rubie-Davies, C. M., Meissel, K., Alansari, M., Watson, P. W., Flint, A., & McDonald, L. (2020). Achievement and beliefs outcomes of students with high expectation teachers. Social Psychology of Education, 23(5), 1173–1201. https://doi.org/10.1007/s11218-020-09574-y
Rucinski, C. L., Brown, J. L., & Downer, J. T. (2018). Teacher-child relationships, classroom climate, and children’s social-emotional and academic development. Journal of Educational Psychology, 110(7), 992–1004. https://doi.org/10.1037/edu0000240.
Rudolf, M., & Buse, J. (2020). Multivariate Verfahren: Eine praxisorientierte Einführung mit Anwendungsbeispielen [Multivariate methods: A practice-oriented introduction with application examples (3rd ed.). Hogrefe. https://doi.org/10.1026/02900-000.
Scherrer, V., Roberts, R., & Preckel, F. (2016). Parents’ assessment of circadian preference in elementary school-aged children: Validity and relations to educational outcomes. Chronobiology International, 33(9), 1188–1207. https://doi.org/10.1080/07420528.2016.1210618.
Schmidt, I., Brunner, M., Keller, L., Scherrer, V., Wollschläger, R., Baudson, T. G., & Preckel, F. (2017). Profile formation of academic self-concept in elementary school students in grades 1 to 4. PloS One, 12(5), e0177854. https://doi.org/10.1371/journal.pone.0177854.
Sedlmeier, P., & Renkewitz, F. (2013). Forschungsmethoden und Statistik für Psychologen und Sozialwissenschaftler [Research methods and statistics for psychologists and social scientists] (2nd ed.). Pearson Deutschland. https://elibrary.pearson.de/book/99.150005/9783863266837.
Şeker, H. (2011). Developing a questionnaire on attitude towards school. Learning Environments Research, 14(3), 241–261. https://doi.org/10.1007/s10984-011-9096-9.
Sheng, Y., & Sheng, Z. (2012). Is coefficient alpha robust to non-normal data? Frontiers in Psychology, 3, 34. https://doi.org/10.3389/fpsyg.2012.00034.
Stang, J., & Urhahne, D. (2016). Stabilität, Bezugsnormorientierung und Auswirkungen der Urteilsgenauigkeit [Stability, reference norm orientation, and effects of judgment accuracy]. Zeitschrift für Pädagogische Psychologie, 30(4), 251–262. https://doi.org/10.1024/1010-0652/a000190
Statista (2023b). Verteilung der Lehrkräfte an allgemeinbildenden Schulen in Deutschland im Schuljahr 2021/2022 nach Altersgruppen [Distribution of teachers at general education schools in Germany in the 2021/2022 school year by age group]. https://de.statista.com/statistik/daten/studie/1129882/umfrage/verteilung-der-lehrerinnen-in-deutschland-nach-altersgruppen/.
Statista (2023a). Anteil der weiblichen Lehrkräfte an allgemeinbildenden Schulen in Deutschland im Schuljahr 2021/2022 nach Schulart [Proportion of female teachers at general education schools in Germany in the 2021/2022 school year by school]. https://de.statista.com/statistik/daten/studie/1129852/umfrage/frauenanteil-unter-den-lehrkraeften-in-deutschland-nach-schulart/.
Steinmayr, R., Meißner, A., Weidinger, A. F., & Wirthwein, L. (2014). Academic achievement. In L. H. Meyer (Ed.), Oxford bibliographies Online: Education. Oxford University Press.
Südkamp, A., Kaiser, J., & Möller, J. (2012). Accuracy of teachers’ judgments of students’ academic achievement: A meta-analysis. Journal of Educational Psychology, 104(3), 743–762. https://doi.org/10.1037/a0027627.
Thoemmes, F. J., & Kim, E. S. (2011). A systematic review of propensity score methods in the social sciences. Multivariate Behavioral Research, 46(1), 90–118. https://doi.org/10.1080/00273171.2011.540475.
Trautwein, U., & Möller, J. (2016). Self-concept: Determinants and consequences of academic self-concept in school contexts. In A. A. Lipnevich, F. Preckel, & R. D. Roberts (Eds.), The Springer Series on Human Exceptionality. Psychosocial skills and school systems in the 21st century (pp. 187–214). Springer International Publishing. https://doi.org/10.1007/978-3-319-28606-8_8.
Trizano-Hermosilla, I., & Alvarado, J. M. (2016). Best alternatives to Cronbach’s alpha reliability in realistic conditions: Congeneric and asymmetrical measurements. Frontiers in Psychology, 7, 769. https://doi.org/10.3389/fpsyg.2016.00769.
Urban, J., Feuchter, M. D., Scherrer, V., Breit, M., & Preckel, F. (2023). Turn up the Heat! A Tutorial for the MAGMA R-package. https://doi.org/10.31234/osf.io/yfd7a
Urban, J., Feuchter, M. D., Scherrer, V., Breit, M., & Preckel, F. (2024). MAGMA.R: MAny-Group MAtching. R package version 1.0. https://CRAN.R-project.org/package=MAGMA.R.
Urhahne, D. (2015). Teacher behavior as a mediator of the relationship between teacherjudgment and students’ motivation and emotion. Teaching and Teacher Education, 45, 73–82. https://doi.org/10.1016/j.tate.2014.09.006
Urhahne, D., & Wijnia, L. (2021). A review on the accuracy of teacher judgments. Educational Research Review, 32, 100374. https://doi.org/10.1016/j.edurev.2020.100374.
Urhahne, D., Zhou, J., Stobbe, M., Chao, S. H., Zhu, M., & Shi, J. (2010). Motivationale und affektive Merkmale unterschätzter Schüler [Motivational and affective characteristics of underestimated students]. Zeitschrift für Pädagogische Psychologie, 24(3–4), 275–288. https://doi.org/10.1024/1010-0652/a000021
Urhahne, D., Chao, S. H., Florineth, M. L., Luttenberger, S., & Paechter, M. (2011). Academic self-concept, learning motivation, and test anxiety of the underestimated student. The British Journal of Educational Psychology, 81(1), 161–177. https://doi.org/10.1348/000709910X504500.
Van Rossem, R., & Vermande, M. M. (2004). Classroom roles and school adjustment. Social Psychology Quarterly, 67(4), 396–411. https://doi.org/10.1177/019027250406700405.
Viechtbauer, W. (2010). Conducting meta-analyses in R with the metafor Package. Journal of Statistical Software, 36(3). https://doi.org/10.18637/jss.v036.i03.
Wahl, D., Huber, G. L., & Weinert, F. E. (2007). Psychologie für die Schulpraxis: Ein handlungsorientiertes Lehrbuch für Lehrerinnen und Lehrer [Psychology for school practice: An action-oriented textbook for teachers] (2nd ed.). Edition Sozio-Publishing: Vol. 208. Sozio-Publishing.
Wang, S., Rubie-Davies, C. M., & Meissel, K. (2018). A systematic review of the teacher expectation literature over the past 30 years. Educational Research and Evaluation, 24(3–5), 124–179. https://doi.org/10.1080/13803611.2018.1548798.
Wollschläger, R. (2016). Diagnostic competencies of teachers. Accuracy of judgment, sources of bias, and consequences of (mis-)judgment [Dissertation]. University of Trier, Trier.
Xiao, L., & Hau, K. T. (2023). Performance of coefficient alpha and its alternatives: Effects of different types of non-normality. Educational and Psychological Measurement, 83(1), 5–27. https://doi.org/10.1177/001316442210882.
Zaboski, B. A., Kranzler, J. H., & Gage, N. A. (2018). Meta-analysis of the relationship between academic achievement and broad abilities of the Cattell-horn-Carroll theory. Journal of School Psychology, 71, 42–56. https://doi.org/10.1016/j.jsp.2018.10.001.
Zhou, J., & Urhahne, D. (2013). Teacher judgment, student motivation, and the mediating effect of attributions. European Journal of Psychology of Education, 28(2), 275–295. https://doi.org/10.1007/s10212-012-0114-9.
Ziegler, M., Kemper, C. J., & Kruyen, P. (2014). Short scales–five misunderstandings and ways to overcome them. Journal of Individual Differences, 35(4), 185–189. https://doi.org/10.1027/1614-0001/a000148.
Funding
Open Access funding enabled and organized by Projekt DEAL.
Author information
Authors and Affiliations
Corresponding author
Ethics declarations
Conflict of interests
The authors have no relevant financial or non-financial interests to disclose.
Additional information
Publisher’s Note
Springer Nature remains neutral with regard to jurisdictional claims in published maps and institutional affiliations.
Electronic supplementary material
Below is the link to the electronic supplementary material.
Appendix
Appendix
Rights and permissions
Open Access This article is licensed under a Creative Commons Attribution 4.0 International License, which permits use, sharing, adaptation, distribution and reproduction in any medium or format, as long as you give appropriate credit to the original author(s) and the source, provide a link to the Creative Commons licence, and indicate if changes were made. The images or other third party material in this article are included in the article’s Creative Commons licence, unless indicated otherwise in a credit line to the material. If material is not included in the article’s Creative Commons licence and your intended use is not permitted by statutory regulation or exceeds the permitted use, you will need to obtain permission directly from the copyright holder. To view a copy of this licence, visit http://creativecommons.org/licenses/by/4.0/.
About this article

Cite this article
Gnas, J., Urban, J., Feuchter, M.D. et al. Socio-emotional experiences of primary school students: Relations to teachers’ underestimation, overestimation, or accurate judgment of their cognitive ability. Soc Psychol Educ (2024). https://doi.org/10.1007/s11218-024-09915-1
Received:
Accepted:
Published:
DOI: https://doi.org/10.1007/s11218-024-09915-1