
Abstract
Informetrics with its frameworks and methods has long been playing a prominent role in the study of science–society communications. The aim of the present work is an exploratory study of this domain of research, via a scoping review based on enhanced bibliometric methods. The leading research questions concern the cognitive structure of the subject, its position in the broader context of science communication studies and social studies of science, and the role and contributions of informetrics in advancing the field. To overcome the difficulties stemming from the complex definition of the subject, we use an indirect, link-based search strategy for database construction. Our methodological framework consists of a combination of bibliographic coupling (identifying main research streams), various representations of semantic networks (analyzing the cognitive organization of individual research streams), and the systematic synthesis of the results we call quasi content analysis. Beyond uncovering the role and context of informetrics in the study of science–society communications, our results contribute to the conceptual clarifications on such timely issues as the meaning of altmetrics or the notion of social impact in recent informetrics paradigms.
Introduction
The relationship between science and society is an evergreen and heavily studied research topic, that has been addressed from a wide variety of methodological perspectives. The dawn of the era of computer-mediated global communication (basically, the internet) gave a vast momentum to research on this subject, for at least two interrelated reasons: firstly, internet platforms provided radically new channels and modes for the interaction of the research community and the public, and secondly, digital traces of these communications have become accessible in large amounts in the form of “Big data”. It seems natural then, that informetrics, as a methodological framework, gained prominence in the analysis of science–society communications, given that—among other things—it best suited the study of on-line channels and large-scale data. Indeed, in recent decades a great volume of papers has been published that employ an informetric toolkit or perspective in the study of research communications. Yet, while various reviews have dealt with science communication as such, and several works have revisited the evolution of informetrics, no studies to date, to our knowledge, have addressed the existing evidence on the use of informetrics in the study of science–society communications. The aim of the present work is an exploratory study of this domain of research, via a scoping review based on enhanced bibliometric methods.
An immediate difficulty with this ambitious objective comes with the concept of informetric research. Given some classic approaches, we may define informetrics “intensionally” via the definition “Informetrics is the study of the quantitative aspects of information in any form” (Tague-Sutcliffe 1992), or extensionally via enumerating its contents as in “comprising all the—metrics studies related to information science, including bibliometrics (…), scientometrics (…), webometrics (…)” (Egghe 2005). Consulting the highly influential, classic review of Bar-Ilan on this field reveals an elaborated version of this view, by presenting a landscape of informetrics which covers bibliometric laws, scientometric methods both in science studies (mapping, classification, network analysis) and research assessment (indicators), citation analysis, webometric methods such as hyperlink-analysis (Bar-Ilan 2008), to name just the most indicative issues. More recent accounts, as many from Bar-Ilan add “Altmetrics” to this list, for which the analysis of science–society interactions is an inherent component. Relying on these grounds, we operationalize informetrics research for our purposes as publications belonging to Library and Information Science (LIS).
Even more challenging is to find the eligibility criteria for what it means for a LIS publication to focus on science–society communications. We can pinpoint some prototypic studies, that inspired, if not limited, our quest for such alliances between informetrics and science communications research. Among those we find the study of Bar-Ilan analysing the distribution of news items on “mad cow disease” on the internet newsgroups in relation to bibliometric laws (Bar-Ilan 1997), as well as content analyses of research blogs for uncovering the characteristics of the discussion of scholarly information, originating from the research collaboration of the same author (Shema et al. 2012, 2015). A motivating series of papers from Leydesdorff and Hellsten reported a research programme on automated content analysis of media frames and public understanding in the case of several high-profile scientific issues, such as “stem cells” or “frankenfood” (Leydesdorff and Hellsten 2005, 2006). This list also spans a range, where informetrics contributes from distributional to qualitative reconstructions of the dissemination of scientific knowledge.
Though science communication is typically understood in terms of disseminating scientific research to the public for the sake of scientific literacy, awareness, public trust etc., a quick look into e.g. Altmetrics instantly illuminates that the study on social dissemination of science may have a radically different focus, such as impact or influence assessment. Since the aim is to undertake a scoping review, we might be interested in as many facets of the subject as could be revealed, without a priori constraining its scope. Consequently, we expect our review to go beyond dissemination research or even internet-based research, as other channels can equally be targeted by informetric methods. To generalize, we identified three elements as “eligibility” criteria for a study to fit this perspective: (1) the study reported should be concerned with the communication of scholarly research or some science-related issue (2) it should be focusing on the knowledge exchange between a research community and social groups (general public, decision makers etc.) in any form, and (3) it should be applying an informetric framework in the analysis or methods. As a result, instead of science communication, we rather term our subject science–society communications or research communications. Notably, our additional goal was to map how informetrics-based studies are being positioned and embedded in research communications studies, which called for the inclusion of the context into the scope of this exploratory mapping.
To sum up these considerations, the following research questions were formulated:
-
(RQ1) How the domain of informetrics research on science–society communications is being organized to date in terms of research subjects, research methods and their interrelations?
-
(RQ2) How this domain is being positioned in the broader context of the study on science–society interactions?
-
(RQ3) A follow-up question, being subordinate to RQ1 is how informetrics is being utilized within this domain, what frameworks and methods are being employed for what research purposes, and how these applications relate to other methodological frameworks of research communications.
Data and methods
The sampling procedure for representing the discourse on science–society communications posed some serious challenges during our research. The basic problem was that our chosen topic, although well-defined on conceptual grounds, was somewhat elusive in terms of the corresponding literature. To be more precise, it would have been extremely hard to construct a sufficient search strategy based on pre-selected search terms for retrieval of the relevant set of publications, due to the huge variety of field-specific approaches, theoretical and conceptual frameworks, methods, communication channels, aspects, organizational levels under study that would qualify a paper as an informetric approach for science communication (in the broadest sense). Additionally, our main goal was to explore the scope of such approaches, without pre-determining the boundaries of the discourse. Consequently, most a priori selected term lists seemed to be either too broad or two restrictive to capture this diversity. That is why we decided to construct an indirect search strategy that uses other clues as search terms or textual descriptors, and is based on the citation relations between documents. The general scheme of the procedure was to first identify a core sample, and extending it through citation relations up to a point where data saturation could be considered sufficient. The actual search strategy can be described as follows.
Database construction
-
(1)
In the first step, a collection of so-called “core” papers has been obtained from the Web of Science Core Collection, by the following two consecutive queries: (a) all papers citing the journal Science Communication were retrieved, and (b) this collection was limited to those papers that belonged to the WoS Subject Category Information Science and Library Science. The main rationale behind this approach was to capture those items that, at any rate, relate to science communication as a topic, without having to name or label these topics, and apply a framework or methodology pertaining to information science. This procedure resulted in a core sample of n = 358 papers.
-
(2)
In the second step, the initial core was screened for relevance concerning our research questions, by manually checking the eligibility of individual papers using their title and abstract. This step narrowed down the initial sample to n = 62 papers.
-
(3)
In the third step, all papers (i.e. bibliographic records) citing the core sample (i.e. at least one core paper) were harvested from the WoS databases, providing us with an additional set of n = 429 papers.
-
(4)
In the fourth step, references were extracted from papers constituting the core sample, and were filtered on the basis of their occurrence frequency. All reference items cited at least twice by the core sample were retrieved, as source items, from the WoS Core Collection databases. This resulted in an extension of n = 139 papers.
-
(5)
In the final step, these three bibliographic records were joined in generating the final sample, i.e., schematically: final sample = core sample (2) + citing docs (3) + cited docs (4). After the removal of duplicates (where virtually no duplicates were found), this final step resulted in a bibliographic record with n = 630 items.
The overall motivation of this indirect search strategy was to first provide a relatively high precision sample, and to maximize recall and still maintain relevance by covering the citation environment induced by this sample. The citation environment was cut at the first generation of ancestors (cited items) and of descendants (citing items), as some experimentation showed that by extending the sample with further generations at any direction introduced too much noise or unrelated literature, while not bringing in substantially new aspects of research (as could be seen by initial screenings). Therefore, data saturation was deemed to be sufficient for our purposes, that is, for representing the structure of the discourse under study (The process of database construction is depicted in Fig. 1.

Flowchart of database construction
Analytic strategy
To address our research questions, we enrolled a “layered”, two-level approach to iteratively uncover the structure of the discourse on science–society communications. In particular, a domain analysis was undertaken at two different levels of granularity. At first, to explore its broad thematic organization and to identify the focal topics, (1) a cluster analysis of the bibliographic sample was conducted, resulting in the main thematic clusters constructing the domain. Secondly (2) we applied a series of analyses on each of the main thematic clusters (document sets), to reveal their internal topical organization in detail. Expected from this strategy was to explore the structure of the discourse at various, interdependent levels of organization (RQ1), and—by increasing the level of granularity and varying the methods of analysis in the second phase—to extract the role of informetric methods within science communications research (RQ2). The selected procedures, models and their motivations are detailed below.
Cluster analysis of the bibliographic sample
The clustering of the bibliographic sample was based on bibliographic coupling (BC). According to the basic principle of BC, the degree of thematic similarity between documents is proportional to the amount of their shared references. The similarity concept employed here was particularly suited to our goal to first reveal the main research directions or, for that matter, traditions. It is the common intellectual basis for two documents that is being considered as indicative of belonging to the same tradition, which, in turn, is operationalized with the degree of sharing references (i.e., BC) in bibliometrics. The procedure consisted of the following steps:
-
(1)
After processing the references of the 630 papers, we created a proximity network of sample papers, based on their shared (full) references. The weights of edges conveyed the degree of similarity between documents, where pairwise similarity was defined on the basis of the number of shared references, and calculated via the cosine measure. Technically speaking, we used the cosine similarity of documents represented as (normalized) vectors of their references. References in these vectors entered with a real value (instead of the boolean presence–absence values), as were weighted using a tf–idf scheme known from information retrieval, so that items cited too broadly in the sample do not distort the proximity results. In such a way, the measurement favoured links between papers that are more similar to each other in their common background, than to the rest of sample.
-
(2)
The actual clustering was achieved by running a community detection algorithm on this proximity network constructed via bibliographic coupling, in order to delineate coherent groups of papers. The algorithm used was the “Louvain method”, implemented in the igraph R package (Csardi and Nepusz 2006) that aims to find a stable cluster structure based on the topology of the network, taking into account the weight of edges, where the (weighted) intra-cluster similarities are always higher than inter-cluster ones. Technically speaking, the algorithm is designed to find the cluster solution that maximizes network modularity in a computationally effective way, as proposed by Blondel et al. (2008).
Analysis and interpretation of individual clusters
The most substantive step, after obtaining the broad research directions or themes of the discourse, was to uncover their internal structure. Since we were interested in the conceptual—methodological aspects of research directions, we represented each cluster with their key concepts, using the author keywords associated with sample papers in the Web of Science databases. Keywords and their relations have been subjected to the following, interdependent levels of analysis, repeated for each cluster:
-
(1)
We created a semantic network representing the internal conceptual organization of the cluster. It was constructed as a proximity network of keywords, using the normalized co-occurrence of keyword terms within the documents of the cluster. This time, we used the Jaccard similarity measure for assessing the proximity of terms (thereby for weighting the links in the network).
-
(2)
The semantic network obtained for the cluster was then subjected to the community detection procedure referred to in the previous section, i.e. the Louvain method. As a result, the network of key concepts was partitioned into cohesive subtopics defined by strongly and densely related concepts. Based on the semantic network, we also calculated the normalized betweenness centrality scores for each concept to capture and quantify their role in organizing the discourse (i.e. the extent to which they connect or mediate between conceptual blocks, typically clusters of concepts). We then visualized the conceptual structure of the cluster using the results of these analyses. We call this visualization the “network view” of the cluster, as will be discussed in the Results section below.
-
(3)
To gain a more clear representation of conceptual relations, we analysed the semantic network along different lines as well. We subjected the proximity network (as a proximity matrix) to a hierarchical cluster analysis method (after converting similarities into distances for that end, and using the “average” method). In this step, we constrained the full keyword net by term centrality values, and limited the analysis to a subnetwork containing only the highly central concepts in the cluster (the normalized betweenness centrality of which exceeded the value of B = 0.05, which threshold was empirically devised from the centrality distribution of nodes). The main aim of this additional exercise was to obtain an overview of the domain, where the interrelations of the most relevant concepts are analytically (not only visually) demonstrated by the concept tree resulted from the hierarchical clustering. We call this the “tree view” of the cluster. To assist a convenient comparison with the network view, we enriched the tree view with a color-coded labelling, where terms belonging to the same cluster according to the network view (and analysis) are indicated with the same color, as will be discussed in the Results section.
-
(4)
In order to facilitate the systematic interpretation of conceptual structures obtained via the previous methods, we applied a “quasi-content analysis” on top of these representations. Instead of the traditional method of coding the full text of sample papers and aggregating the results for thematic representations, we used the thematic representations obtained from steps 1–3 to code the cluster via standardized categories. We inductively set up a category system covering those dimensions of the study of science–society communications research that best operationalized our research questions. Therefore, the cluster was described along the following dimensions: the communication channels addressed in the domain (Channel), such as the printed media or the web; the aspects of the interactions under study (aspect), such as public perception, public attitudes, dissemination, social impact etc.; the methodologies or methodological frameworks employed (method); and the scientific, scholarly subjects being communicated, such as nanotechnology (theme), if applicable (we refer to dimensions or categories in small capitals). The actual interpretation was based on the joint interpretation of the network view and the tree view of the cluster (for the overview of the entire methodology see Fig. 2.
Fig. 2 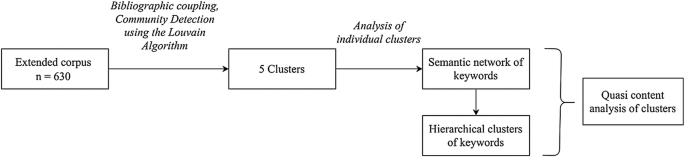
Schematic representation of the analytical framework

Results
In what follows, we first report some basic statistics on the sample record and the results of the clustering procedure based on bibliographic coupling. Then, we present the results from the analysis of individual clusters in detail.
Basic statistics of the bibliographic record and of the clustering results
The search strategy applied in the compilation of our database did not constrain the basic bibliographic characteristics of the sample (such as document type, publication venues or publication year). The distribution of papers along the timeline is reported by Fig. 3. It can be seen that the growth of the volume of publications in this domain of research has been accelerated from the 2000s, and followed an exponential-like growth dynamics since the second Millennium. The distribution of sample papers among publication venues signals the prevalence of some journals, which already forecasts the prevalence of certain themes within the domain. Table 1 lists the ranking of journals found to be most frequently contributing to the discourse, based on the number of papers (journals represented with at least 5 papers are being shown). Clearly, the most dominant venues are concerned with health communication, closely followed by prominent LIS journals and the most prestigious outlets on general science communication. The list also reinforces the indirect strategy employed for database construction, as its objective was to navigate the connections between Library and Information Science and communication studies on science–society relationships.

The growth of publication output within the domain in the period 1975–2019
The clustering procedure built upon bibliographic coupling organized the database into five clusters (after pruning the cluster structure to exclude some extremely small and incoherent satellite sets with less than 10 papers). The size distribution of clusters is set out in Table 2. The distribution is reasonably balanced, with 120 papers per cluster on average. The detailed analysis of clusters will be provided in the next sections.
The analysis of individual clusters
In what follows, each cluster will be subjected to a detailed analysis, applying a systematic and comparative interpretation of the network view and the tree view of the conceptual and thematic organization of the cluster. For the sake of commensurability, the results will be framed using the domain-relevant categories of the quasi content analysis introduced in the Methods section. For reading both structural views (network vs. tree), some further explanation is in order, as we enhanced both visualizations to increase their expressive potential. In case of the tree view, color-coded terminal nodes are being used to signal the relative frequency of concepts/terms within the cluster. The four colors (red, orange, yellow, blue) indicate the quartile in the frequency distribution (Q1, Q2, Q3, Q4) to which the term belongs. Hence, “red concepts” are the dominant ones, in terms of frequency, within the cluster, and so forth. As noted in the Methods section, labels of the same color on the tree form a community or coherent term group within the semantic network, according to the outcomes of the Louvain method. Within the network view, the size of nodes is proportional to their betweenness centrality, so that the most central concepts stand out. To facilitate interpretation, only the most central concepts are labelled (B > 0.1), while the tree view uncovers a more granular picture, showing a detailed environment of the most central concepts with still highly central terms (B > 0.05).
Cluster #1
The first recognized cluster exhibits a rather clear conceptual structure (Fig. 4). From the two main branches of the tree, one includes risk perception, risk communication and health communication, as the most frequent concepts, which, together with trust, form a coherent subgroup within the cluster. On the other hand, cancer information overload is the dominant concept of the other main branch (both in terms of frequency and centrality). It connects many cancer-related issues to this discourse, including cancer worry, cancer fatalism, loosely paired up with diet as a health factor. This pattern is recurring, as the other subgroup of this branch also connects the topic of cancer and fatalism with another attitude detected in the public, namely, nutritional backlash. It becomes salient in the semantic network that it is through the notion of uncertainty where these two branches combine. Regarding the dimensions of the study on science-society communication, the discourse focuses on the aspects, namely public perception and public attitudes, and features a main theme, in that the uncertainties of cancer-related public knowledge is being addressed (together with parallel, nutrition-related ones). Though Methods are not salient, a central role can be attributed to the concept of measurement.

The network view and the tree view for cluster #1 (no. papers = 138)
Cluster #2
The second cluster we identified showed a much denser conceptual structure (Fig. 5). The tree is built up of several main branches. Around the most frequent concepts we find (1) a block focusing on twitter and media bias, loosely associated with framing; (2) world wide web and internet is coupled with computer-mediated communication, on one hand, and methodology, activism, and social network on the other. (3) A strong concept block incorporates newspaper and blog together with nanotechnology and science communication. The closest branch is (4) information management, which is the most central term to this discourse, and web data mining (or web mining). It is this aggregate, that channels in an extensive block of (5) information science and scientotmetric methods (see the semantic network visualization). This latter one includes citation analysis, co-word analysis, bibliometric approaches and network analysis. The network view reveals a certain circle, as the area designated mainly by science communication is connected to the concept of information science through scientometric terms in one direction, and the term information management in the other. With somewhat lower frequencies, but an equally important conceptual branch (6) is dominated by big data, that is linked to automated content analysis and communication. In this block, the concept of framing also appears (implicit framing), paired up with that of crisis communication. As to the dimensions of the study on science-society communication, this subdiscourse is clearly characterized by the unifying methodology of informetrics and data science, as well as the communication channel under study, being the world wide web and the internet-based platforms in general. The aspect of interaction is the dissemination of societally recognized scientific issues (as indicated by the role of bias and framing), with the recurring theme of nanotechnology.

The network view and the tree view for cluster #2 (no. papers = 138)
Cluster #3
The third cluster formed within the discourse also shows a rich structure (Fig. 6). The most dominant blocks are formed around (1) health that is closely associated with news source and agenda building, and also directly linked to science journalism and nanotechnology, each representing a frequent concept in this cluster. The other dominant subgroup (both in centralities and frequencies) includes (2) health journalism, content analysis and health information, more loosely coupled with cancer. This subgroup shares its root with a further salient subgroup, designated by (3) framing and renewable energy. The network view reveals that it is the concept of content analysis that, with a high overall centrality, connects the latter two subgroups, that constitute the two main poles of the semantic map. In the “northern” pole, the group of renewable energy is extended by a further one with (4) climate change and media coverage, belonging still to the first quartile of the keyword frequency distribution. In the “southern” pole, the “health and science journalism cluster” is also augmented with a group organized around (5) mass media, containing risk communication and attitude as further central concepts (occurring still with relatively high frequencies). The other wing of this branch is more moderate in quantities, featuring health communication, healthy behavior, along with a specific health issue, namely fetal alcohol spectrum disorder. The network view demonstrates two other subnetworks: (6) news media is surrounded by media industry, television, public health and mental illness, with moderately high frequencies, forming the “north western” part of the map. A relatively distinct “south eastern” peninsula emerges around (7) qualitative research and media analysis and print media (see the tree view) that are linked with such particular topics as alcohol policy or harms to other or stigmatisation.

The network view and the tree view for cluster #3 (no. papers = 183)
In sum, this subdiscourse can be described by quite coherent in most dimensions of science-society communication. Regarding the communication channel, it is the printed and mass media, and journalism being studied. The communication aspect is the public dissemination and public attitudes towards generally recognized science-related issues. Rather overt is the dual thematic orientation of the cluster: the two main themes being health topics and health communication, on one hand, and outstanding environmental issues, on the other. The cluster is also specific on the methods, given the central role of content analysis and the massive reference to qualitative research designs.
Cluster #4
The fourth cluster is a relatively small and straightforward one, both in terms of content and of structure (Fig. 7). The dominant concept is research impact, as it is the most abundant and the most central in the network, being in the closest connection with (1) a group constituted of payback framework, health gain and monetization. Belonging broadly to this group is the focal concept of policy impact through which societal impact is connected to the conceptual net. Another focal wing of this very subgroup is designated with applied research together with knowledge translation. The other main branch of the semantic network is (2) dedicated mainly to the concept of knowledge exchange and managament research (and impact in general). These focal concepts span a complete subnetwork (best indicated via the network view), where knowledge exchange is coupled directly with stakeholder engagement, and a further aggregate is formed out of knowledge intermediary, evaluation and impact. The network view is highly telling inasmuch as it depicts research impact brokering between the two major branches centered around (1) the social impacts of scientific research and (2) managing the social dissemination and use of the output of research. Regarding the dimensions of science–society communications, this cluster is not specific in many respects (such as theme, method), but very much so regarding the aspect, which is the social impact of scientific and scholarly activity with its various facets (societal, political, economic etc.). The communication channel tackled here can be formulated as the various ways of mediation between science and society, aiming at the utilization of research outputs (policies, knowledge intermediaries, stakeholder engagement etc.).

The network view and the tree view for cluster #4 (no. papers = 31)
Cluster #5
The fifth cluster is again a dense network of concepts, organized into relatively coherent subnetworks (Fig. 8). The most (globally) central term is science communication itself, for which (1) the narrower context is set up by sentiment analysis, public engagement and twitter. Surrounding this central theme, we can find several dominant groups: a massive branch is formed by (2) wikipedia (coupled with encyclopedia) that shares its root in the tree with (3) citation analysis and altmetric, and with a further subgroup being set up by outreach and astronomy, on one hand, and Youtube and video on the other. This collective, that broadly spans the “northern” area of the semantic map, is extended with a frequently recurring and central term, (4) TED talk—just to cite the most frequent representatives of all these subgroups. Next to these, a dominant block is designated by (5) social media. The central “science communication” block has a sibling branch, where (6) open access and scientific communication plays a central role, its sibling group made up of social network, institutional communication, and, though somewhat insignificant in frequency, science popularization, which, arguably, is the most characteristic concept of this cluster (see below). Last but not least, (7) a salient block is organized around the term webometric, being a focal concept according to the network view as well.

The network view and the tree view for cluster #5 (no. papers = 98)
Regarding the dimensions of science–society communications, the content of the cluster is quite well articulated in many ways. The channels under study are clearly those specific on-line platforms that has become most utilized in science communication (types such as social media, or most popular instances such as Youtube and Wikipedia). These are the very channels that, at the same time, are also being targeted by “post-bibliometrics” attempts to detect broader research impact (altmetrics), which leads us to the aspects and methods featured in this cluster. As to the aspects, on one hand, it is science popularization, citizen science (indicated by such central terms as astronomy and public engagement) and open science are being put into focus as mediators of knowledge between science and society, while it is the detection of on-line research impact (“social impact”), on the other, as clearly conveyed by altmetrics as an often-reoccurring term. The methods are best represented by the block focusing of webometric approaches, which picture is complemented by such automated content analysis methods as sentiment analysis, applied in a web-based context.
Discussion
In order to summarize the results described above, Table 3 provides an overview of the clusters representing their content along the main dimensions of the study of science–society communication.
Based on this summary, the discourse is constituted of two domains that is concerned with the public dissemination of scientific knowledge with its framing and potential biases included, and the study of public attitudes toward scientific issues (#2 and #3); One domain that is specifically concerned with public perception (#1), one that focuses on science popularization and participatory or citizen science (#5), and a seemingly outlier domain addressing the social impact of research and managing the social utilization of research outcomes (#4). Here, we roughly distinguish between dissemination and popularization, whereby popularization would mean a targeted and supervised exercise to enlighten a scientific issue to raise literacy (such as a Wikipedia entry or an academic Youtube video), whereby dissemination would mean all modes of engaging the public with scientific issues for various reasons (such as social media posts and related discussions about diseases, newspaper items that rely on scientific information to contextualize or support their statements etc.) It is striking, that the themes or topics exposed in almost all clusters cover medical and health issues, typically such general threats as cancer or common risk factors such as alcohol or nutritional habits, and outstanding environmental issues (climate change). This concentration of themes suggests that the study of science communication is to some extent sensationalist or, to put it more neutrally, driven by prevalent public discourses.
More importantly, also striking is the association between methodological frameworks and communication channels. Domains of study that address on-line channels or internet platforms typically employ informetric methods (web data mining, text mining, webometrics, citation analysis and other bibliometric methods, see cluster #2 and cluster #5), while domains addressing more classical channels such as mass media or printed media rely on qualitative designs, classical document and content analysis (cluster #3). At first glance, this may be a well-appreciated alliance, but given such broad definitions of informetrics as the study of the quantitative aspects of information, the association is not so obvious (in fact, classical content analysis, or at least some branches of it, are often exposed as quantifying the textual information in documents). It is rather the capability of advanced informetric methods to process and analyse large-scale data, with relative ease, in computer-mediated communications that most likely accounts for this association. It is the algorithmic analysis of the distribution and patterns of science-related information, including the generation of contexts and meaning beyond frequencies, that is most often the goal in those clusters. This can also serve as the meaning for the aspect targeted in these clusters, that is usually dissemination, framing and bias. A key example to demonstrate this alliance between channels, methods and aspects would be a set of core documents in cluster #2, focusing on automated content analysis as a semantic network-based method to map the meaning of controversial scientific issues in public contexts (Leydesdorff and Hellsten 2006). It can be conceived as qualitative research (concerned with reconstructing meanings), still based on the algorithmic analysis of large-scale computer-mediated communications.
Regarding the configuration of domains reflected in Table 3, one would also expect a more definite expression of a specific capability attributable to informetric studies focusing on on-line platforms. Namely, the expected capability to capture both direction of science–society communications at once. Since on most on-line platforms there is a direct interaction or dialogue between the “sender” and the “receiver” (think of on-line newspaper items and their on-line reader comments, blogs or forums), it seems natural that such aspects as dissemination and framing, on one hand, and public attitudes and perceptions, on the other, are coupled in the corresponding clusters. Still, interestingly, cluster #2 (on line sources, informetric methods) is concerned only with dissemination, typically, while cluster #3 (printed media, qualitative methods) shows public attitudes as one main aspect. Perhaps this may be indicative of a gap to fill with informetric research directed towards this interaction of dissemination and perception, or framings and the corresponding public attitudes.
Arguably, the most important contribution of this mapping is that it reveals a broad continuum in the study of science–society communications (related to informetric approaches), which, despite its thematic diversity, still organized along such interrelations that make this landscape quite coherent. First of all, beyond core issues to science communication, such as dissemination and public perception, a distinct domain emerges on the social impact of science, as a specific aspect of the question under study. This cluster highlights a communication channel, namely, science management that mediates between science and society. By tackling this channel, the cluster also re-conceptualizes the concept of science communication, as societal impact (the kind of impact usually assigned to science dissemination, and thereby almost tantamount to science communication) is being subsumed under the more general notion of social impact, covering also political, economic etc. mediated spillovers of scientific knowledge production.
Going further along these lines, cluster #5 also broadens the scope of science–society communications. Although the main channel involved is the on-line platforms of communication, with the concepts of participatory science and open science two further respective channels are being imported to the discourse. In the case of participatory science (with the typical case of astronomy, that is, crowd-sourcing astronomical micro-observations), it is a joint collaborative action involving the public and academia that constitutes the (two-directional) channel with the goal of achieving scientific goals, so it is “society for science”, in a way. In the special case of open science, it is the opportunity of the public to have direct access to scientific discourses. Though the agenda of open science is usually portrayed as improving the efficacy of research itself (i.e. the primary goal being scientific communication instead of science communication), this analysis shows that it is intimately linked to the issues of science-society communications as well.
On our view, the emerged structure of the discourse also clearly transfers a warning regarding current uses of informetrics especially in evaluative or research assessment approaches (or, rather, movements). A widely celebrated new paradigm of the detection (if not assessment) of research impact is the altmetric movement, the central claim being that on-line communications on research outcomes can be a supreme indicator of the social (or societal) impact of those outcomes or their authors. Several studies pointed out, though, that this otherwise plausible presupposition relies on a relatively weak notion of impact, which encompasses dissemination only (Pulido et al. 2018). Our analysis tends to supports this distinction, as (1) the notion of social impact induces its own cluster, and focuses on the actual utilization of research in social contexts, while (2) altmetrics as a topic is being featured in a different cluster, where its broader context is the popularization of science via on-line platforms. Consequently, this mapping may increase awareness for how different angles of viewing science-society communications are being interlinked: it can be devised, then, that confounding impact, dissemination, popularization etc. is a risk of operationalizing informetric concepts especially designed for evaluation purposes. A certain analogy with the evolution of bibliometrics is in order here: a number of authors have depicted the history of modern bibliometrics as starting with a research programme on the structure of science (embodied in the Journal Citation Index by Eugene Garfield), and turned into an often controversial assessment tool by the frequent misuse of the very same tool (the Impact Factor introduced for JCI), before its conceptual—theoretical and practical aspects would have been sufficiently studied. There are various indications that this history seems to be repeating for altmetrics, and we conjecture that mappings presented in this work may well support the clarification of conceptual issues that are in the background of the firm and valid use of informetrics-based tools, measures and indicators.
References
Bar-Ilan, J. (1997). The “mad cow disease”, usenet newsgroups and bibliometric laws. Scientometrics,39(1), 29–55.
Bar-Ilan, J. (2008). Informetrics at the beginning of the 21st century—A review. Journal of Informetrics,2(1), 1–52.
Blondel, V. D., Guillaume, J. L., Lambiotte, R., & Lefebvre, E. (2008). Fast unfolding of communities in large networks. Journal of Statistical Mechanics: Theory and Experiment,2008(10), P10008.
Csardi, G., & Nepusz, T. (2006). The igraph software package for complex network research. InterJournal, Complex Systems,1695(5), 1–9.
Egghe, L. (2005). Expansion of the field of informetrics: Origins and consequences. Information Processing and Management,41(6), 1311–1316.
Leydesdorff, L., & Hellsten, I. (2005). Metaphors and diaphors in science communication: Mapping the case of stem cell research. Science Communication,27(1), 64–99.
Leydesdorff, L., & Hellsten, I. (2006). Measuring the meaning of words in contexts: An automated analysis of controversies about ‘Monarch butterflies’, ‘Frankenfoods’ and ‘stem cells’. Scientometrics,67(2), 231–258.
Pulido, C. M., Redondo-Sama, G., Sordé-Martí, T., & Flecha, R. (2018). Social impact in social media: A new method to evaluate the social impact of research. PLoS One,13(8), e0203117.
Shema, H., Bar-Ilan, J., & Thelwall, M. (2012). Research blogs and the discussion of scholarly information. PLoS One,7(5), e35869.
Shema, H., Bar-Ilan, J., & Thelwall, M. (2015). How is research blogged? A content analysis approach. Journal of the Association for Information Science and Technology,66(6), 1136–1149.
Tague-Sutcliffe, J. (1992). An introduction to informetrics. Information Processing and Management,28(1), 1–3.
Acknowledgements
Open access funding provided by Library and Information Centre of the Hungarian Academy of Sciences (MTA KIK). This paper is devoted to the memory of Judit Bar-Ilan, whose outstanding work and achievements in the field of informetrics greatly inspired our efforts. The work reported in this paper was also supported by the Hungarian OTKA Grant NKFIH K 116099.
Author information
Authors and Affiliations
Corresponding author
Additional information
This paper is dedicated to the memory of Judit Bar-Ilan (1958–2019), an outstanding scholar and an inimitable friend and colleague.
Rights and permissions
Open Access This article is licensed under a Creative Commons Attribution 4.0 International License, which permits use, sharing, adaptation, distribution and reproduction in any medium or format, as long as you give appropriate credit to the original author(s) and the source, provide a link to the Creative Commons licence, and indicate if changes were made. The images or other third party material in this article are included in the article's Creative Commons licence, unless indicated otherwise in a credit line to the material. If material is not included in the article's Creative Commons licence and your intended use is not permitted by statutory regulation or exceeds the permitted use, you will need to obtain permission directly from the copyright holder. To view a copy of this licence, visit http://creativecommons.org/licenses/by/4.0/.
About this article

Cite this article
Soós, S., Kiss, A. Informetrics and the study of science–society communications: a bibliometric scoping review. Scientometrics 124, 825–842 (2020). https://doi.org/10.1007/s11192-020-03444-2
Received:
Published:
Issue Date:
DOI: https://doi.org/10.1007/s11192-020-03444-2