
Abstract
The task of the 2017 Soccer Prediction Challenge was to use machine learning to predict the outcome of future soccer matches based on a data set describing the match outcomes of 216,743 past soccer matches. One of the goals of the Challenge was to gauge where the limits of predictability lie with this type of commonly available data. Another goal was to pose a real-world machine learning challenge with a fixed time line, involving the prediction of real future events. Here, we present two novel ideas for integrating soccer domain knowledge into the modeling process. Based on these ideas, we developed two new feature engineering methods for match outcome prediction, which we denote as recency feature extraction and rating feature learning. Using these methods, we constructed two learning sets from the Challenge data. The top-ranking model of the 2017 Soccer Prediction Challenge was our k-nearest neighbor model trained on the rating feature learning set. In further experiments, we could slightly improve on this performance with an ensemble of extreme gradient boosted trees (XGBoost). Our study suggests that a key factor in soccer match outcome prediction lies in the successful incorporation of domain knowledge into the machine learning modeling process.
1 Introduction
Soccer is probably the most popular team sport worldwide. Part of the fascination with soccer is due to the fact that the majority of matches (\(>85\%\)) end either in a draw or are won by only two or fewer goals. Furthermore, a complex mix of factors and chance events play a major role in determining the final outcome of a soccer match (Reep and Benjamin 1968). Even when a strong team plays against a relatively weak team, the outcome is not easy to predict, since single events, such as a red card, can be decisive. But the outcome is also clearly not purely random. Since the late 1960s, various approaches have been proposed to predict soccer outcomes (Reep and Benjamin 1968; Hill 1974; Maher 1982; Dixon and Coles 1997; Angelini and De Angelis 2017). Most of these approaches rely on statistical methods, for example, Poisson regression models. Relatively few studies investigated machine learning methods to predict the outcome of soccer matches (O’Donoghue et al. 2004).
To what extent is it possible to predict the outcome of a soccer match? More specifically, given the data that are most readily available for soccer matches (date of match, team names, league, season, final score), how well can machine learning predict the outcome? These questions motivated us to organize the 2017 Soccer Prediction Challenge (Dubitzky et al. 2018). This competition consisted of a large Challenge learning set and prediction set. The Challenge learning set describes 216,743 league soccer matches in terms of goals scored by each team (i.e., the final score), the teams involved, the date on which the match was played, and the league and season. The drawback of such data is that more “sophisticated” match statistics, such as fouls committed or corners conceded by each team, or relevant data about players and teams are not included. However, the beauty of simple match data is that they are readily available for most soccer leagues worldwide (including lower leagues). Thus, a particular motivation of the 2017 Soccer Prediction Challenge was to determine how well we can predict the outcome of a soccer match, given such widely and freely available match data. We invited the machine learning community to develop predictive models from the Challenge learning set and then predict the outcome of 206 future matches. The motivation was to pose a real “acid test” by requiring all participants to make their predictions before the real outcome was actually known. Details about the Challenge learning set and prediction set are described by Dubitzky et al. (2018).
Here, we present our solutions to the 2017 Soccer Prediction Challenge. The major difficulty that we faced was how to incorporate soccer domain knowledge into the modeling process. The topic of knowledge representation in machine learning has long been identified as the major hurdle for machine learning in real applications (Brodley and Smyth 1997; Rudin and Wagstaff 2014). We believe that feature engineering is one phase of the modeling process where domain knowledge can be meaningfully incorporated.
We propose two new methods for constructing predictive features from soccer match data. We refer to these methods as recency feature extraction and rating feature learning. By applying these methods to the data set released for the 2017 Soccer Prediction Challenge, we obtained two different learning sets, the recency feature learning set and the rating feature learning set. Both data sets can be represented in table or matrix form and are readily amenable to subsequent supervised learning. First, as one of the oldest workhorses of machine learning, we chose k-nearest neighbor (k-NN) learning. Second, as one of the state-of-the-art classifiers, we used ensembles of extreme gradient boosted trees (XGBoost) (Chen and Guestrin 2016). The best model that we could complete before the competition deadline was k-NN trained on the rating feature learning set. This model achieved the best performance among all submissions to the Challenge. After the competition deadline, we could slightly improve on that performance with XGBoost.
The major contributions of our study can be summarized as follows. We propose two new methods for integrating domain knowledge for soccer outcome prediction. We demonstrate the usefulness of our methods by benchmarking them against state-of-the-art models in a real prediction challenge (as opposed to the commonly encountered benchmarking scenario). In principle, the proposed methods should also be suitable to outcome prediction in other, similar team sports.
2 Related work
Reep and Benjamin (1968) carried out one of the first studies on the prediction of soccer matches. They investigated the fit of a negative binomial distribution to scores from football matches but were unable to reliably predict the outcomes. Their conclusion was therefore that “[...] chance does dominate the game” (Reep and Benjamin 1968, p. 585). While luck certainly plays an important role in a single match, other factors, such as attacking and defending skills, become more relevant over an entire season, which is obvious because a strong team generally wins against a weak team in the long run. Indeed, Hill (1974) showed that there was a significant correlation between the predictions made by football experts and the final league tables of the 1971–1972 season. Maher (1982) assumed that the number of goals that a team scores during a match is a Poisson variable. His Poisson model achieved a reasonably good fit to the data from four English football league divisions for the seasons 1973–1974, suggesting that more than mere chance is at play. Dixon and Coles (1997) pointed out that it is not so difficult to predict which teams will perform well in the long run, but it is considerably more challenging to make a good prediction for an individual game.
Angelini and De Angelis (2017) proposed PARX, a Poisson autoregression model that captures a team’s attacking and defensive abilities. On the games of the 2013/2014 and 2014/2015 English Premier League seasons, PARX outperformed the model by Dixon and Coles (1997) with respect to the number of predicted goals.
The statistical approaches for soccer outcome prediction fall into two broad categories. Some models derive the probabilities for home win, draw, and away win indirectly by first estimating the number of goals scored and conceded by each team (Maher 1982; Dixon and Coles 1997; Angelini and De Angelis 2017). Other models calculate these probabilities directly (i.e., without explicitly estimating the number of goals scored and conceded), for example, by using logit or probit regression. Goddard (2005) compared both approaches on a 25-year data set from English league football matches and observed the best performance for a hybrid approach, i.e., by including covariates describing goals-based team performance to predict match outcomes. Overall, however, the differences in predictive performance between the investigated models was small, and it remains unclear which approach is preferable.
Sports betting is a global multi-billion dollar industry. The UK football betting market is characterized by “fixed odds”, which means that odds are determined by bookmakers several days before a match is to take place. These odds are not updated based on betting volumes or new information, such as a player’s injury (Forrest et al. 2005). Mispricing bets can therefore have serious financial consequences for bookmakers, and this creates a real incentive for them to make good predictions. How do odds-setters fare against statistical models? Forrest et al. (2005) compared the performance of professional British odds-setters with that of an ordered probit model during five seasons from 1998/1999 to 2002/1903. Although the statistical model performed better at the beginning of the study period, the odds-setters’ predictions were better towards the end, which casts doubt on the widely held view that statistical models perform better than expert forecasts. This view might be due to the fact that tipsters—independent experts whose predictions appear in daily newspapers—generally perform poorly compared to statistical models (Spann and Skiera 2008). However, the financial stakes are incomparably higher for professional odds-setters, which might explain the differences in predictive performance.
To predict the results of the 2002 FIFA World Cup, O’Donoghue et al. (2004) used a variety of approaches, including probabilistic neural networks, linear and logistic regression, bookmakers’ odds, computer simulations, and expert forecasts. The best prediction resulted from a commercial game console that simulated the matches.
Researchers have also investigated rating systems to predict the outcome of soccer matches. Perhaps the best-known approach is an adaption of the Elo rating system for chess (Elo 1978), originally proposed by Arphad Elo and later adapted to football (Hvattum and Arntzen 2010). The principle behind Elo rating schemes is that the actual competitive strength of a player or team is represented by a random variable sampled from a normal or logistic density distribution centered on the team’s true strength. Comparing such distributions from two teams allows the computation of the probability of winning. The more the distributions overlap, the closer is the winning probability to 0.5 for either team. The more separate the distributions are, the higher is the winning probability for the team with the higher rating. If the winning probability of both teams is close to 0.5, then a draw is the most likely outcome. However, the probability of a draw is not calculated directly.
Applying the Elo rating scheme in soccer is problematic because of the choice of a rating difference distribution and their parameters. An even deeper problem in such rating schemes is the limitation to a single rating per team to model the team’s overall strength. It is also not obvious how the probability of a draw should be derived. For example, if the winning probability based on Elo rating is 0.75, we do not know how the remaining 0.25 are distributed over draw and loss.
One of the major innovations in the research presented in this paper is a soccer rating model (rating feature learning) that characterizes each team by four ratings, representing a team’s attacking and defensive strength both at its home and at its opponent’s venue. Moreover, our rating model does not rely on any distribution of ratings or rating differences of teams. Instead, we define a model that (a) defines two equations that predict the goals scored by the home and away team, respectively, based on the four ratings for each team, and (b) a rating update function for each of the four ratings. Thus, the entire rating model is defined by six functions involving ten free parameters, which are optimized based on the actual match data. In our experiments, we fix two of these parameters, so that only eight parameters are optimized using the data.
3 Knowledge integration
In addition to league and season, each match in the Challenge learning set describes the date on which the match was played, the teams involved, and the actually observed outcome in terms of the goals scored by each team (Dubitzky et al. 2018). Thus, soccer data of this kind describe temporally ordered sets of match data, but consecutive entries are not necessarily related. Intuitively, to induce a model that predicts the outcome of a future match, one would want to quantify the relative strength of the two teams by assessing their prior performance—the greater the strength difference, the more likely the stronger team is to win. However, how to cast such match data into features that express the relative strength is not obvious. So a central question in this study is: “How can we derive predictive features from such data?”
A further problem is the composition of the Challenge learning set in 52 soccer leagues from 35 countries over a total of 18 seasons from 2000/2001 to 2017/2018. The assumption in the 2017 Soccer Prediction Challenge is that we can integrate these data somehow to create a more reliable model than could be obtained from separate league/season subsets alone. However, it is not immediately obvious if (and how) we could integrate the match data across leagues, countries, and seasons.
3.1 Feature modeling framework
Here, we outline our basic conceptual framework for engineering predictive features. Aspects relating to the integration of the data across leagues, seasons, and countries are considered in Sect. 3.2.
Our main idea is to describe each team by features that characterize a team in terms of its strengths and weaknesses relevant to the outcome of the match. Soccer domain knowledge tells us that the definition of such features should take into account the following dimensions:
-
Attacking performance describes a team’s ability to score goals.
-
Defensive performance describes a team’s ability to prevent goals by the opponent.
-
Recent performance characterizes a team’s current condition in terms of its aggregate performance over recently played matches.
-
Strength of the opposition qualifies a team’s prior performance depending on the strength of the opponent played in the (recent) past.
-
Home team advantage refers to the advantage a team has when playing at its home venue.
The attacking and defensive performance dimensions are both obvious and intuitive. A team that scores many goals consistently has a strong attack. Similarly, a team that consistently prevents its opponents from scoring is likely to have a strong defense. The stronger a team’s attack and defense, the more likely it is to prevail over an opponent.
As already indicated, we may obtain a team’s current attacking and defensive strength by aggregating relevant recent performances over a period of time. The observations in the Challenge data are recorded at successive points in time—the time points are defined by values of the “Date” variable. The idea is that the strength of a team at time t can be expressed as an aggregate computed from the team’s performances at recent time points \((t-1), (t-2), \ldots , (t-n)\). The recency problem refers to the challenge of finding an optimal value for n. Small values may not cover a sufficient number of past performances (hence, may not yield robust predictive features), while large values may include performances that are too obsolete to reliably characterize the current condition of a team. Weighted, adaptive, and other schemes are possible to capture the influence of past performances on future performance. How many recent time points are considered may also have an impact on data integration (cf. Sect. 3.2).
The strength of the opposition dimensions is perhaps one of the more subtle aspects. As we aggregate various past performances of a team into a predictive feature value, we need to estimate the team’s past performances based on the strength of the opponents against which the team achieved these performances. For example, a 2:1 win against a top team should not be considered the same as a 2:1 win against a mediocre team.
The home team advantage in soccer (and indeed other team sports) is a well-known phenomenon whereby soccer teams experience a competitive benefit from playing at their home venue (Gómez et al. 2011). Based on the Challenge learning set containing \(N_{learn} = 216{,}743\) matches (Dubitzky et al. 2018), we can quantify the home team advantage in soccer: \(45.42\%\) matches are won by the home team, compared to \(27.11\%\) draws and \(27.47\%\) wins by the away team.
3.2 Data integration framework
Section 3.1 described the basic dimensions that should be considered in the generation of features for predictive modeling. These considerations fully apply in the context of a single league and season. However, the Challenge learning set contains various leagues from different countries covering multiple seasons. The underlying assumption in the 2017 Soccer Prediction Challenge is that we can somehow “combine” all or most of the data from the Challenge learning set for predictive modeling. On one extreme, we may decide to preserve the league/season context throughout and construct a dedicated predictive model from each league/season data subset. This approach would be warranted if we assumed, for example, that the mechanisms underlying the matches within a league/season unit would be substantially different from other league/season blocks. On the other extreme, we may decide to ignore the league and season origin of the data and combine the matches from all leagues across all seasons into a single data set and construct a single predictive model from this unified data set. Thus, a 1:1 draw in GER3 (German 3rd Liga) in the 2010/2011 season would be similar to a 1:1 draw in BRA2 (Brazilian Serie B) in the 2015/2016 season (except for the league and season label).
Note that a team’s performance is of course not constant over time. Various factors affect a team’s performance, for example, transfers of players, the physical and mental condition of players at any given time, the selection of players for a given match, etc. Therefore, performance fluctuations across seasons are to be expected. Within each league and season, we have a fixed number of teams that play a fixed number of matches over the season according to the league’s season format. At the beginning of a season, all teams in a league start out with zero points and goals. For example, the English Premier League (ENG1) consists of 20 teams that play a total of 380 matches over a season. The match schedule format is such that each team plays against each other team twice, once at home and once at the away ground. By the end of the season, the best-performing teams are crowned champion, promoted to a higher league, or qualified for play-offs or other competitions, and the worst-performing teams face relegation. The most obvious approach to predicting the outcome of future matches would be to compute predictive features from a team’s performance over the n most recent matches within a league and season and use these features to construct a predictive model. However, there are two issues that need to be considered: the recency problem (see Sect. 3.1) and the beginning-of-season problem.
The beginning-of-season problem arises because at the start of a season, each team in a league starts out on zero points and zero goals. Thus, in order to build up a record of past performances that is indicative of future performances, we need to wait until each team has played a number of games before we have such a record for the first time. The problem is that this leads to a loss of data that could be used for predictive modeling—the larger n, the bigger the loss of data. To illustrate this, let us assume a value of \(n=7\) for the English Premier League (20 teams, 380 matches per season). Requiring each team to have played 7 matches from the start of the season means that we have to wait for at least 70 matches (18.4% of 380) to be completed at the beginning of the season before we can compute predictive features for all teams for the first time. Because none of the first 70 matches can be characterized by 7 prior matches, these matches are lost from the learning set. Moreover, matches taking place at the beginning of the season in the prediction data set could not be predicted either because their predictive features cannot be computed.
One way to overcome the beginning-of-season problem is to view the succession of seasons for a given league as one continuously running season. In such a continuous-season approach, the first matches of a new season would simply be considered as the next matches of the previous season. Under this view, we could continue the performance trajectory from the previous season and do not reset each team to zero—in terms of its continuing performance indicators—when a new season starts. Therefore, we do not lose any data at the beginning of each new season (only for the very first season for each league within the data set). However, while this is true for teams that remain in the same league for many seasons (which is generally the case for most teams), it does not fully apply to teams that feature only infrequently within a league.
For example, in the 17 seasons from 2000/2001 to 2016/2017, FC Watford has played only the 2006/2007, 2015/2016, and 2016/2017 seasons in the English Premier League. This means that over these 17 seasons, we have only a fragmented time series data trajectory for Watford. Combining all seasons of ENG1 into a single continuous season not only introduces the undesired beginning-of-season effect twice (at the start of the 2006/2007 and 2015/2016 seasons), it also raises the question if we could reasonably view the first match of Watford in the 2015/2016 as the “next” match after Watford’s last match in the 2006/2007 season. This is illustrated in Table 1. At the bottom of the two tables (highlighted rows), we see the same match between Manchester City and Watford played on 29/08/2015 in the 2015/2016 season. In each table, the three matches above the highlighted match (at time points \(t-1\), \(t-2\) and \(t-3\)) show the first three matches of Manchester City and Watford, respectively, in the 2015/2016 season. In case of Manchester City, the matches labeled \(t-4\), \(t-5\), \(t-6\) and \(t-7\) (column T) refer to Manchester’s last four matches in the 2014/2015 season, whereas the corresponding four matches for Watford are from the 2006/2007 season. Thus, under the continuous-season view, there is a much bigger gap between Watford’s matches across the season boundary (indicated as dashed line in the diagram) and the matches of Watford.
The fluctuation of teams in lower leagues is even more pronounced than in the top league in each country because the team composition in such leagues is subject to change by teams promoted up from the league below as well as teams demoted down from the league above. We refer to this as the league-team-composition problem.Footnote 1
To illustrate the league-team-composition problem, we look at the top two leagues in Germany (GER1, GER2) over the 16 seasons from 2001/2002 to 2016/2017. Both leagues consist of exactly 18 teams per season over the considered time frame. Over this period, 35 different teams have featured in GER1, seven of which played in all 16 seasons. In contrast, a total of 52 different teams have featured in GER2 over the same period, none of which has remained in the league over the entire time frame (and only one over 15 seasons).
One way of addressing the issues arising from the league-team-composition problem would be to combine all leagues from a country into one super league. For example, the top three German leagues (GER1, GER2, GER3) covered in the Challenge learning set could be viewed as one German super league, consisting of \(18 + 18 + 20 = 56\) teams per season. The fluctuation of teams in such a country-specific super league would be less than the sum of fluctuations over all individual leagues. For example, in the top three German leagues, a total of 72 teams featured in the eight seasons from 2008/2009 to 2015/2016, 41 (57%) of the teams featured in all eight seasons, and 59 (82%) featured in four or more seasons. The more leagues are covered per country, the higher the positive effect of pooling the leagues into one super league. For 25 of the 35 countries in the Challenge data, only a single (the top) league is covered. Thus, the league-team-composition problem is inherently limited as team fluctuation is only occurring at one “end” for top leagues within a country.
A consequence of the super league approach is that all match outcomes would be dealt with in the same way, independent of league membership. For example, three match days before the end of the 2014/2015 season of the English Championship league (ENG2), AFC Bournemouth beat FC Reading by 1–0 goals. At the end of the season, Bournemouth was promoted to the English Premier League (ENG1). On the third match day in the 2015/2016 season of ENG1, Bournemouth beat West Ham United by 4–3 goals. In the time-series under a super league view, these two wins by Bournemouth are only six match days apart. Can we consider the two wins on an equal footing, given the class difference of opponents (Reading from ENG2, West Ham United from ENG1)? We argue that this is justified because the class difference for teams at the interface between two leagues is not significant, i.e., teams at league interfaces could be viewed as approximately belonging to the same class.
While teams from within one country can play in different leagues over a number of seasons (giving rise to the super league approach), teams never appear in leagues across different countries (other than in rare continental or global competitions that are not covered in the Challenge data). This independence would suggest that it is reasonable to pool data from different countries without further consideration. However, some may argue that this is not necessarily true because the style and culture (including attack, defense, tactics, strategy) of soccer may vary considerably across countries, and match results may therefore not be directly comparable. For example, for New Zealand (NZL1; 722 games in the Challenge learning set), we have an average of goals scored by the home team of 1.898 (with a standard deviation of 1.520), whereas for France (FRA1, FRA2 and FRA3 combined; 15, 314 games in the Challenge learning set), we get an average of goals scored by the home team of 1.375 (with a standard deviation of 1.166). We think it is justified to pool data from leagues within each country without any adjustment because the statistics suggest that the distributions are very similar (Dubitzky et al. 2018).
There is also an end-of-season problem which is orthogonal to the beginning-of-season and the league-team-composition issues. On the last few match days at the end of the season, a small number of matches may no longer be fully competitive because some teams have nothing to play for anymore (such as championship, relegation, promotion, qualifications for play-offs or other competitions). Thus, predictive features derived from a match time trajectory involving these games may be problematic. A simple way of dealing with this problem would be to drop the last few matches within a season from the data sets altogether. A more sophisticated approach would selectively remove end-of-season matches in which at least one team has no real competitive interest. Both approaches would lead to another loss of data. In this study, we do not explicitly address this issue.
4 Feature engineering methods
Taking into account the basic considerations on feature modeling and data integration discussed above, we developed two methods to generate predictive features:
-
1.
recency feature extraction method
-
2.
rating feature learning method
For both methods, we adopt a continuous-season view to integrate data across season boundaries. For the recency feature extraction method, we also combined data from different leagues within one country into a super league, whereas in the rating feature learning method, we did not merge data across leagues.
4.1 Recency feature extraction
Our first approach to feature modeling represents each match by four feature groups per team. These four feature groups per team are the following:
-
Attacking strength feature group, representing a team’s ability to score goals.
-
Defensive strength feature group, representing a team’s ability to prevent goals by the opponent.
-
Home advantage feature group, used to qualify both the attacking and defensive strengths, respectively, in terms of home advantage.
-
Strength of opposition feature group, used to qualify both the attacking and defensive strengths as well as home advantage in terms of the strength of the opposition.
Each of the four feature groups per team consists of n features, where n denotes the recency depth of the match time series from which the feature values are obtained. Thus, the total number of predictive features used to describe a match with the recency feature extraction method is \(2 \times 4 \times n\), reflecting \(2 \times \) teams, \(4 \times \) feature groups per team, each feature group \(n \times \) levels deep in terms of recency.
This approach is illustrated in Table 2. The table shows the four feature groups characterizing Manchester City and Watford based on the \(n = 5\) recent performances prior to their match on 29/08/2015 (last match shown in Table 1). The time points \(t-1\) to \(t-5\) relate to the corresponding time points and associated matches shown in Table 1.
For example, the five recent Attacking Strength values for Watford over the five recent time points are obtained by looking up the goals that Watford scored in those matches (Table 1): \(t-1\): 0 against Southampton, \(t-2\): 0 against West Bromwich Albion, \(t-3\): 2 against Everton, \(t-4\): 1 against Newcastle United, and \(t-5\): 2 against Reading. In the same way, we derive the goals scored for Manchester City and the goals conceded (defensive strength) for both teams over the considered time frame. The values in the strength of opposition group represent the average goal difference the opponent achieved in its n prior matches. For example, at \(t-1\) (23/08/2015) Manchester City played at Everton. Everton’s average goal difference over five games prior to 23/08/2015 was 0.2 because the five relevant matches were as follows: 15/08/2015: Southampton 0:3 Everton, 08/08/2015: Everton 2:2 Watford, 24/05/2015: Everton 0:1 Tottenham Hotspur, 16/05/2015: West Ham United 1:2 Everton, and 16/05/2015: Everton 0:2 Sunderland. Thus, when Manchester beat Everton by two goals to zero on 23/08/2015, the overall strength of the opposition (Everton) at that point was 0.2.
Finally, the values in the home advantage group are drawn from the set \(\{-1,+1\}\), where \(+1\) indicates that the corresponding feature values at time point \(t-i\) are resulting from a home game, and \(-1\) indicates an away game. Thus, each of the n features values in the three groups is qualified by a feature value indicating whether the corresponding team played on the home or away ground.
The recency feature extraction method produces \(4\times n\) features for each team in such a way that the home team’s features appear before the away team’s features. Thus, for a recency depth of \(n = 4\), we have 32 predictive variables, the first 16 corresponding to the home, the last 16 corresponding to the away team. Of course, the order of the predictive features is irrelevant for subsequent supervised learning.
Using the continuous-season and super-league data integration approach on the full Challenge learning set (\(N_{learn} = 216{,}743\)), the recency feature extraction method turned out to be very time-consuming on a standard workstation. Hence, we first generated features only for four selected recency depths: \(n = 3\), \(n = 6\), \(n = 9\), and \(n = 12\), respectively. We explored their predictive properties. Based on this exploration, we decided to use \(n = 9\) for the final feature generation process. This value is also consistent with our conventional soccer intuition: \(n = 6\) seems to be too low (which reduces the robustness of the features), and \(n = 12\) seems to be too high (which means that irrelevant data are included).
Processing the Challenge learning set with \(n = 9\) took 30, 659 s (about 84 h) on a standard PC and produced 207, 280 matches with \(2 \times 4 \times 9 = 72\) predictive features for each match. This means that a total of \(N_{learn} = 216{,}743 - 207{,}280 = 9463\) matches (4.37%) were lost due to the beginning-of-season problem at the very first season for each league covered in the data.
The Challenge prediction set includes five matches involving a team whose track record of matches over the seasons covered in the learning data set is less than \(n = 9\) matches. These teams appeared only recently (2017/2018 season) for the first time. Thus, for these matches (or fixtures), it was not possible to create features aggregating the information from \(n = 9\) recent matches. In Sect. 7.1.1, we describe how we solved this problem by imputing missing features.
4.2 Rating feature learning
Our second method to create predictive features adopts a feature learning approach. The basic idea of this method is to define a goal-prediction model that predicts the home and away score of a match based on certain performance ratings of each team. After each match, the ratings of both teams are updated according to rating update rules, depending on the expected (predicted) and observed match outcome and the prior ratings of each team. Both the goal-prediction model and the update rules involve free parameters whose values need to be estimated from the Challenge learning set. Together, the goal-prediction model and the rating update rules are referred to as the rating model. The final rating model, with concrete optimal parameter values, is used to generate predictive features, which are then readily amenable to conventional supervised learning.
First, we define four quantitative features that capture a team’s performance rating in terms of its ability to score goals and inability to prevent goals at both the home and away venues, respectively:
-
Home attacking strength reflects a team’s ability to score goals at its home venue—the higher the value, the higher the strength.
-
Home defensive weakness reflects a team’s inability to prevent goals by the opponent at its home venue—the higher the value, the higher the weakness.
-
Away attacking strength reflects a team’s ability to score goals at the opponent’s venue—the higher the value, the higher the strength.
-
Away defensive weakness reflects a team’s inability to prevent goals by the opponent at the opponent’s venue—the higher the value, the higher the weakness.
Based on these four performance rating features (per team), Eqs. 1 and 2 define a goal-prediction model that predicts the goals scored by the home and away team, respectively.
where
-
\(\hat{g}_h\) are the predicted goals scored by home team H. \(\hat{g}_h \in {\mathbb {R}}^+_0\).
-
\(\hat{g}_a\) are the predicted goals scored by away team A. \(\hat{g}_a \in {\mathbb {R}}^+_0\).
-
\(H_{hatt}\) are the home team’s attacking strength in home games. \(H_{hatt} \in {\mathbb {R}}\).
-
\(H_{hdef}\) are the home team’s defensive weakness in home games. \(H_{hdef} \in {\mathbb {R}}\).
-
\(A_{aatt}\) are the away team’s attacking strength in away games. \(A_{aatt} \in {\mathbb {R}}\).
-
\(A_{adef}\) are the away team’s defensive weakness in away games. \(A_{adef} \in {\mathbb {R}}\).
-
\(\alpha _h,\alpha _a\) are constants defining maximum for \(\hat{g}_h,\hat{g}_a\). \(\alpha _h,\alpha _a \in {\mathbb {R}}^+\).
-
\(\beta _h,\beta _a\) are constants defining steepness of sigmoidal curves. \(\beta _h,\beta _a \in {\mathbb {R}}^+_0\).
-
\(\gamma _h,\gamma _a\) are constants defining the curves’ threshold point. \(\gamma _h,\gamma _a \in {\mathbb {R}}\).
Note how the goal-prediction model predicts the goals scored by the home team, \(\hat{g}_h\), based on the sum of the home team’s home attacking strength, \(H_{hatt}\), and the away team’s away defensive weakness, \(A_{adef}\). The higher the sum, the more goals the home team is expected to score. Analogously, the predicted goals scored by the away team, \(\hat{g}_a\), depend on the sum of the away team’s away attacking strength, \(A_{aatt}\), and the home team’s home defensive weakness, \(H_{hdef}\). The higher the sum, the more goals the away team is expected to score.
The goal-prediction model defined by Eqs. 1 and 2 is motivated by the following rationale. To predict the goals, \(\hat{g}_h\), that the home team will score in a concrete match, we need to consider the attacking strength rating of the home team and the defensive weakness rating of the away team. The higher the sum of these two ratings, the more goals the home team is expected to score. This is captured in Eq. 1. The goals of the away team, \(\hat{g}_a\), are predicted analogously. Two separate equations are needed to take into account the crucial home advantage. Both Eqs. 1 and 2 are sigmoid functions, which are often used to describe processes that begin with small values, then accelerate, and eventually flatten out asymptotically. The parameter \(\alpha \) determines the maximum number of goals that can be predicted. Since we know that the number of goals in soccer is generally low (typically 5 or less), we set \(\alpha = 5\) in our experiments, while the values for \(\beta \) and \(\gamma \) are to be found in the learning phase. Furthermore, our domain knowledge also tells us that a difference of three goals is almost a certain win. Thus, teams usually will no longer make an effort to score more goals; instead, they tend to protect their lead. The sigmoid function is therefore a natural choice for the goal-prediction model.
To illustrate the goal-prediction model, we look at the situation in the English Premier League right after the matches played on 19/03/2017 in the 2016/2017 season. The situation is depicted by the league table (a) and the performance rating table (b) in Table 3. The league table is sorted in descending order (first by points, then by goal difference and goals scored). The rating table is sorted in descending order by the combined rating, RAT. The combined or overall rating of a team, \(T_{rat}\), is computed as follows: \(T_{rat} = T_{hatt} + (\max (HDEF) - T_{hdef}) + T_{aatt} + (\max (ADEF) - T_{adef})\), where \(\max (HDEF)\) and \(\max (ADEF)\) represent maximum defensive weakness of all teams considered.Footnote 2
We use the combined rating, RAT, only as a surrogate performance indicator to gauge the overall plausibility of the rating scheme as illustrated in Table 3. If the team rankings in the two tables were to deviate significantly, the plausibility of the rating model would be doubtful. Note that the rating table in Table 3b is derived from all 1423 matches in ENG1 from the 2013/2014 to the 2016/2017 seasons (up and inclusive to the matches on 19/03/2017) under the continuous-season approach. Over this time frame, the ENG1 continuous-season league consists of 26 teams. In Table 3b, in order to facilitate direct comparison, we only show the 20 teams that played in the 2016/2017 season (Table 3a).
We illustrate the goal-prediction model based on the match between Arsenal (home team) and Manchester City (away team) played on 02/04/2017 in ENG1. The game actually ended in a 2:2 draw. Based on the rating values for both teams highlighted in Table 3b, the model predicts that Arsenal scores \(\hat{g}_h = 1.588\) and Manchester City scores \(\hat{g}_a = 1.368\) goals. The corresponding visualizations of the goal-prediction model functions (with concrete parameter values) and scores are depicted in Fig. 1. Note that we set \(\alpha _1 = \alpha _2 = 5\) across all models in this study. This value was found after some experimentation; this value is also consistent with the domain knowledge that a team rarely scores more than five goals in a single match.

Predicted scores for Arsenal (top) versus Manchester City (bottom) on 02/04/2017 based on their ratings after match day on 19/03/2017 shown in Table 3b
So far, so good. Our goal-prediction model is able to predict the goals of a match between team A and B based on the teams’ performance ratings before the match. But where do we get the ratings from? And how do we determine concrete parameter values for the model in Eqs. 1 and 2?
The rating model characterizes a team, T, by four performance ratings, the team’s home attacking strength, \(T_{hatt}\), home defensive weakness, \(T_{hdef}\), away attacking strength, \(T_{aatt}\) and away defensive weakness, \(T_{adef}\), respectively, as illustrated in Table 3b. These ratings are updated after each match that the teams play, depending on the predicted and observed outcome of the match and the prior ratings of both teams.
In particular, a team’s home attacking and defensive ratings are updated according to home rating-update rules defined by the Eqs. 3 and 4.
where
-
\(T_{hatt}^{t+1}\) is the new home attacking strength of T after match. \(T_{hatt}^{t+1} \in {\mathbb {R}}\)
-
\(T_{hatt}^t\) is the previous home attacking strength of T before match. \(T_{hatt}^{t} \in {\mathbb {R}}\)
-
\(T_{hdef}^{t+1}\) is the new home defensive weakness of T after match. \(T_{hdef}^{t+1} \in {\mathbb {R}}\)
-
\(T_{hdef}^t\) is the previous home defensive weakness of T before match. \(T_{hdef}^{t} \in {\mathbb {R}}\)
-
\(\omega _{hatt}\) is the update weight for home attacking strength. \(\omega _{hatt} \in {\mathbb {R}}^+\).
-
\(\omega _{hdef}\) is the update weight for home defensive weakness. \(\omega _{hdef} \in {\mathbb {R}}^+\).
-
\(g_h,g_a\) are the observed goals scored by home/away team. \(g_h, g_a \in \mathbb {N}_0\)
-
\(\hat{g}_h,\hat{g}_a\) are the predicted goals scored by home/away team. \(\hat{g}_h,\hat{g}_a \in {\mathbb {R}}^+_0\).
A team’s away attacking and defensive ratings are updated according to away rating-update rules defined by the Eqs. 5 and 6.
where
-
\(T_{aatt}^{t+1}\) is the new away attacking strength of T after match. \(T_{aatt}^{t+1} \in {\mathbb {R}}\).
-
\(T_{aatt}^t\) is the previous away attacking strength of T before match. \(T_{hatt}^{t} \in {\mathbb {R}}\).
-
\(T_{adef}^{t+1}\) is the new away defensive weakness of T after match. \(T_{aatt}^{t+1} \in {\mathbb {R}}\).
-
\(T_{adef}^t\) is the previous away defensive weakness of T before match. \(T_{hatt}^{t} \in {\mathbb {R}}\).
-
\(\omega _{aatt}\) is the update weight for away attacking strength. \(\omega _{aatt} \in {\mathbb {R}}^+\).
-
\(\omega _{adef}\) is the update weight for away defensive weakness. \(\omega _{adef} \in {\mathbb {R}}^+\).
-
\(g_h,g_a\) is the actual goals scored by home/away team, respectively. \(g_h, g_a \in \mathbb {N}_0\).
-
\(\hat{g}_h,\hat{g}_a\) is predicted goals scored by home/away team. \(\hat{g}_h,\hat{g}_a \in {\mathbb {R}}^+_0\).
We illustrate the rating-update rules based on the Arsenal versus Manchester City Premier League match played on 02/04/2017 in the ENG1 league. According to the goal-prediction model, the predicted outcome of the match was 1.588:1.368, hence \(\hat{g}_h=1.588\) and \(\hat{g}_a=1.368\) (Fig. 1). The actually observed outcome was a 2:2 draw, i.e. \(g_h=2.000\) and \(g_a=2.000\). Table 3b shows the performance ratings of both teams right before the match. After the match, Arsenal’s two home ratings and Manchester City’s two away ratings are updated based on match outcome and the teams’ prior ratings as followsFootnote 3:
-
Arsenal’s home attacking strength: \(HATT: 2.11 \rightarrow 2.16\).
-
Arsenal’s home defensive weakness: \(HDEF: -\,0.71 \rightarrow -\,0.60\).
-
Manchester City’s away attacking strength: \(AATT: 1.88 \rightarrow 1.94\).
-
Manchester City’s away defensive weakness: \(ADEF: -\,0.60 \rightarrow -\,0.56\).
We can see that the rating updates are meaningful. For example, Arsenal’s home attacking strength improved slightly, from 2.11 to 2.16, because Arsenal was expected to score 1.588, but actually scored 2.000 goals. Likewise, Arsenal was expected to concede 1.368, but actually conceded 2.000 goals. Thus, Arsenal’s home defensive weakness rating increased slightly from \(-\,0.71\) to \(-\,0.60\), to reflect a slightly higher defensive weakness. Similar considerations apply to the update of Manchester City’s performance ratings.
In order to create predictive features, our feature-learning algorithm performs two main steps:
-
Step 1 Estimate concrete values for the eight parameters of the overall rating model, Eqs. 1–6, based on the learning set.
-
Step 2 Apply rating model from Step 1 to learning and prediction set to create rating features.
Step 1Estimate rating model parameters: Given a learning set, L, containing the results of past soccer matches, the optimization algorithm first sorts all matches in increasing chronological order, i.e., from the least to the most recent match. Then, a rating table like the one illustrated in Table 3b is derived from L. The rating table has exactly m entries, which correspond to the number of unique teams featuring in the learning set, L. The rating table is used to keep track of the performance ratings of each team. At the start, the rating values of each team are set to zero. The optimization algorithm keeps generating parameter sets, \(M_i\), until (a) the average goal-prediction error falls below a preset threshold, or (b) the predefined maximum number of parameter sets have been evaluated. Each parameter set consists of eight concrete values corresponding to the rating model parameters in Eqs. 1–6: \(\beta _h\), \(\gamma _h\), \(\beta _a\), \(\gamma _a\), \(\omega _{hatt}\), \(\omega _{hdef}\), \(\omega _{aatt}\) and \(\omega _{adef}\). Remember that our rating feature model does not optimize the parameters \(\alpha _h\) or \(\alpha _a\), which define the maximum values for the number of predicted goals (cf. Eqs. 1 and 2).
For each parameter set, \(M_i\), the algorithm iterates over all matches, \(d_j \in L\), in the learning set, from the least to the most recent match. For each match, \(d_j\), the corresponding rating values—\(H_{hatt}\) and \(H_{hdef}\) for the home team and \(A_{aatt}\) and \(A_{adef}\) for the away team—are retrieved and the goals, \(\hat{g}_h\) and \(\hat{g}_a\), are predicted according to Eqs. 1 and 2. The individual goal-prediction error, \(\epsilon _g\), of the observed and predicted goals is computed using Eq. 7, and the corresponding performance ratings of the two teams are updated according to the rating-update rules defined in Eqs. 3–6. The average goal-prediction error, \(\bar{\epsilon }_g\), over all matches in the learning set determines the predictive performance of the model based on the parameter set \(M_i\). The final or best model is defined by the parameter set, \(M_{best}\), with the lowest average goal-prediction error.
Step 2Apply model to generate features: After the optimal model parameter set, \(M_{best}\), has been determined, we are left with a final rating table that shows the ratings of all teams right after the most recent match in the learning set (this is illustrated in Table 3b). Essentially, these ratings describe the performance ratings that each team has at this point in time. In order to obtain rating features for all matches in the learning and prediction sets, L and P, we first combine the two data sets such that the chronological order across all matches in the combined data set, LP, is preserved (assuming that prediction set matches take place after the matches in learning set). Now we use the rating model obtained in Step 1 and iterate through all matches \(d_j \in LP\) and record all four rating values of each team before each match and add these to the match data set. Thus, each match is characterized by eight rating features, four for the home team and four for the away team, as illustrated in Table 4. The rating features capture the teams’ attacking and defensive performance (both at the home and away venue) right before a match.
Note that for the goal-prediction model, Eqs. 1 and 2, we always use only four of the eight rating features—the home ratings of the home team and the away ratings of the away team. However, all eight rating values generated by the feature-learning algorithm form the basis for learning a final outcome-prediction model as required by the Soccer Prediction Challenge.
For the feature-learning algorithm used in this study, we calculated the individual goal-prediction error, \(\epsilon _g\), as defined by Eq. 7.
where
-
\(g_h\) and \(g_a\) refer to the actual (observed) goals scored by the home and away team, respectively. \(g_h, g_a \in \mathbb {N}_0\);
-
\(\hat{g}_h\) and \(\hat{g}_a\) refer to the predicted goals scored by the home and away team, respectively. \(\hat{g}_h,\hat{g}_a \in {\mathbb {R}}^+_0\).
To estimate the values for the eight model parameters of the rating model defined by Eqs. 1–6, various optimization techniques are conceivable, for example, genetic algorithms. We decided to use particle swarm optimization (PSO) (Kennedy and Eberhart 1995). In brief, PSO is a population-based, stochastic optimization method inspired by bird flocking and similar swarm behavior. We decided to use PSO primarily because it is a general-purpose method that does not make strong assumptions about the problem at hand and it is particularly suited for continuous-parameter problems with complex optimization landscapes.
In PSO, a potential solution is represented as an individual (particle) of a population (swarm). At each generationi, each particle p has a defined position \(\mathbf {x}_p(i)\) and velocity \(\mathbf {v}_p(i)\) within n-dimensional space \(\mathbb {R}^n\). A swarm P consists of m particles. After each generation, the position and velocity of each particle in the swarm is updated based on the particle’s fitness describing the quality of the associated solution; in our study, the average goal-prediction error according to the PSO update rulesFootnote 4 is shown in Eqs. 8a and 8b.
where \(\mathbf {x}_p(i)\) and \(\mathbf {x}_p(i+1)\) denote the position of particle p in n-dimensional space at generations i and \(i+1\), respectively. In our feature-learning algorithm, the n dimensions correspond to the permissable values of the eight rating model parameters in Eqs. 1–6. The vectors \(\mathbf {v}_p(i)\) and \(\mathbf {v}_p(i+1)\) denote the velocity of particle p at generation i and \(i+1\), respectively. \(\mathbf {y}_p(i)\) refers to the best personal solution (position) of particle p until generation i, and \(\mathbf {z}_k(i)\) denotes the best global solution (position) of any particle k reached by generation i. The PSO parameter \(\omega \) denotes the inertia weight used to balance global and local search according to Shi and Eberhart (1998), and \(r(\cdot )\) denotes a function that samples a random number from the unit interval [0, 1]. Finally, \(c_1\) and \(c_2\) are positive learning constants.
We employed the PSO implementation of the R package hydroPSO (Zambrano-Bigiarini and Rojas 2013) with the following main control parameters: number of particles of the PSO swarm was \(npart = 50\), and maximal number of generations to evaluate was \(maxit = 200\). Hence, up to maximally 10, 000 parameter sets were evaluated per rating model. After some experimentation, the following limits for the rating model parameters were applied to constrain the search space: \(\beta _h, \beta _a \in [0,5]\) and \(\gamma _h, \gamma _a \in [-\,5,5]\) for Eqs. 1 and 2, and \(\omega _{hatt}, \omega _{hdef}, \omega _{aatt}, \omega _{adef} \in [0,1.5]\) for Eqs. 3–6.
Step 1 of the feature-learning algorithm that estimates the rating model parameters is very time-consuming when applied to a large learning set. Thus, to generate features for the Challenge, we took a few measures to reduce the computational complexity of the feature-learning process. First, we focused on only the 28 leagues that are included in the Challenge prediction set. This means that data from other leagues were ignored.
Second, for these 28 leagues, we adopted a within-league, continuous-seasons data integration approach covering only matches from the 2013/2014 season onward.
Third, we created a rating model and the associated rating features for each league separately, on a league-by-league basis. This, of course, has the added advantage that we respect the league context when we create predictive features. Based on these measures, we extracted a total of 31, 318 matches from the original Challenge learning set (\(N_{learn} = 216{,}743\)) to form a rating feature learning set.
A breakdown of the rating feature learning set that we used in the feature-learning algorithm is shown in Table 5.
In summary, our proposed rating feature learning method includes a score-prediction model (Eqs. 1 and 2) and rating-update rules (Eqs. 3–6). The method has several interesting properties. First, it offers an intuitively pleasing solution to the recency problem because it does not require us to explicitly define the number of recent games to consider in the computation of predictive features. The update weights (\(\omega \)-parameters) defined by the rating-update rules take care of this aspect. The higher the update weight, the stronger the emphasis on more recent results. The precise value of the update weights is learned from the data. Second, our feature-learning approach addresses the difficult strength-of-the-opposition problem in a very “natural” way by rating each team’s current performance status by four features. Thus, the observed outcome of a match can be “naturally” qualified depending on the strength of the opposition. Moreover, these rating features distinguish attacking and defensive performance as well as the home advantage dimension. Third, the goal-prediction component presented here not only captures the margin of victory and distinguishes different types of draws, but it also takes into account (due to the sigmoidal characteristics) the fact that many soccer outcomes involve few goals on each side (Fig. 2).
4.3 Summary of the feature engineering process
Processing the Challenge learning set of \(N_{learn} = 216{,}743\) matches with the recency feature extraction method produced a recency feature learning set consisting of 207, 280 matches (\(95.63\%\) of the Challenge learning set), with 72 predictive features per match, and a recency depth of \(n = 9\). The data loss is due to the beginning-of-season problem at the start of each continuous-season league. For five of the 206 matches of the Challenge learning set, we could not produce recency features because at least one team featuring in each of the five matches did not have a history of at least five matches. The data were integrated by adopting the super-league and continuous-season approach. This means that data from each country were pooled into a single continuous season encompassing all available seasons from each league within a country. One advantage of this approach is that it maintains the country context during the feature generation.

Relative frequencies of match outcomes in a the Challenge learning set, b the recency feature learning set, and c the rating learning set. The 25 most frequent results from a total of 76 different results are shown
Applying the rating feature learning method to the Challenge learning set produced a rating feature learning set with \(N_{rat} = 31{,}318\) matches (\(14.4\%\) of Challenge learning set), with eight predictive features per match. The reason for the relatively limited size of this learning set is the computational complexity of the feature learning approach due to the optimization part of the algorithm. Thus, only a subset of the Challenge learning data set was processed—a breakdown of the leagues and seasons of the rating learning set is shown in Table 5). The rating features were generated on a league-by-league basis only, based on a continuous-season approach, covering the seasons from 2013/2014 to 2017/2018. One advantage of this league-by-league processing is that the league context in feature generation is being maintained. The rating feature learning method does not entail a data loss due to the beginning-of-season problem because at the start of its time series trajectory, each team starts with zero as initial rating, and the rating changes after the first match is played. Thus, this method produced ratings even for the five teams in the Challenge prediction set with fewer than nine prior matches.
Figure 2 shows the 25 most frequent match outcomes in (a) the Challenge learning set, (b) the recency feature learning set, and (c) the rating feature learning set. Notice, the nine most common results in all three learning sets involve no more than two goals for each team and account for 157, 047 (\(72.46\%\)) of all results in the Challenge learning set.
Figure 3 shows the prior probabilities of win, draw, and loss in the Challenge learning set, the recency feature learning set, and the rating feature learning set. Figure 3 also nicely shows the home advantage: the prior probability of a win is far higher than the probability of a loss or draw.
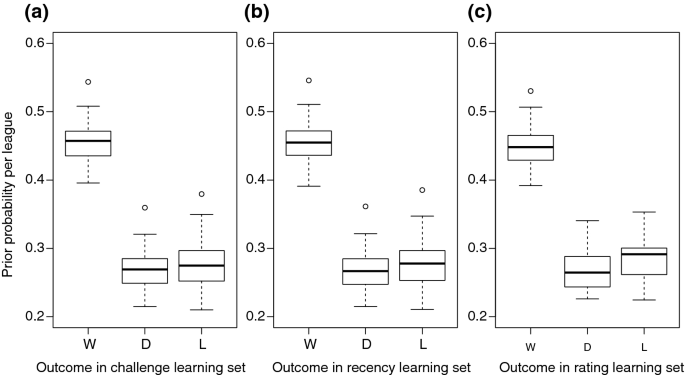
Boxplots of the prior probabilities of win (W), draw (D), and loss (L) in a the Challenge learning set, b the recency feature learning set, and c the rating feature learning set
5 Evaluation metric
The evaluation metric for the outcome prediction of an individual soccer match is the ranked probability score (RPS) (Epstein 1969; Constantinou and Fenton 2012), which is defined as
where r refers to the number of possible outcomes (here, \(r = 3\) for home win, draw, and loss). Let \(\mathbf p = (p_1, p_2, p_3)\) denote the vector of predicted probabilities for win (\(p_1\)), draw (\(p_2\)), and loss (\(p_3\)), with \(p_1 + p_2 + p_3 = 1\). Let \(\mathbf a = (a_1, a_2, a_3)\) denote the vector of the real, observed outcomes for win, draw, and loss, with \(a_1 + a_2 + a_3 = 1\). For example, if the real outcome is a win for the home team, then \(\mathbf a = (1, 0, 0)\). A rather good prediction would be \(\mathbf p = (0.8, 0.15, 0.05)\). The smaller the RPS, the better the prediction. Note that the Brier score is not a suitable metric for this problem. For example, assume that \(\mathbf a = (1, 0, 0)\). A model X makes the prediction \(\mathbf p _X = (0, 1, 0)\), while a model Y makes the prediction \(\mathbf p _Y = (0, 0, 1)\). The Brier loss would be the same for both X and Y, although the prediction by X is better, as it is closer to the real outcome.
The goal of the 2017 Soccer Prediction Challenge was to minimize the average over all ranked probability scores for the prediction of all \(n = 206\) matches in the Challenge prediction set. The average ranked probability score, \(\mathrm {RPS}_{\mathrm {avg}}\), which was also used as criterion to determine training and test performance of our models, is defined by Eq. 10.
6 Supervised learning algorithms
We used the following two learning algorithms to build predictive models from our data sets: k-nearest neighbor (k-NN) and ensembles of extreme gradient boosted trees (XGBoost) (Chen and Guestrin 2016).
The k-nearest neighbor (k-NN) algorithm is one of the simplest and arguably oldest workhorses of supervised learning (Cover and Hart 1967; Wu et al. 2008). In k-NN, the solution to an unknown test instance is derived from a group of k cases (the k nearest neighbors) in the training set that are closest to the test case according to some measure of distance. For example, in classification, the class label of a new case may be determined based on the (weighted) majority class label found in the set of k nearest neighbors. A critical issue affecting the performance of k-NN is the choice of k. If k is too small, the result may be very sensitive to noise in the k-nearest neighbors set; if k is too large, the k nearest neighbors may contain too many irrelevant cases, potentially leading to poor generalization performance. The optimal value for k, \(k_{\mathrm {opt}}\), is typically determined in a learning phase, which evaluates different k-values in a setup that divides the learning set into training set and validation set, for example, using leave-one-out or n-fold cross-validation. For large data sets, the learning phase could become computationally expensive, as for each instance in the test set the distance to each instance in the training set needs to be computed. We developed a k-NN model because it is both a simple and effective method, which has been successfully used to address a variety of classification tasks. Several studies have shown that the performance of a simple k-NN classifier can be on par with that of more sophisticated algorithms (Dudoit et al. 2002; Berrar et al. 2006).
To predict the outcome of a test instance, X, based on its k nearest neighbors, we computed the proportion of each of the three observed outcomes in k. For example, if the observed outcomes in the set of \(k = 70\) nearest neighbors of X were \(47~\times \) home wins, \(13~\times \) draws and \(10~\times \) away wins, the individual prediction for X would be \(p_1 = 47/70 = 0.671\), \(p_2 = 13/70 = 0.186\) and \(p_3 = 10/70 = 0.143\). We computed the distance d between two instances X and Y based on the eight rating features as defined in Eq. 11.
where (see Table 4)
-
\(x_i \in X =\{x_{hatt}^h,x_{hdef}^h,x_{aatt}^h,x_{adef}^h,x_{hatt}^a,x_{hdef}^a,x_{aatt}^a,x_{adef}^a\}\) refer to the rating features of the home, h, and away, a, team of match X;
-
\(y_i \in Y =\{y_{hatt}^h,y_{hdef}^h,y_{aatt}^h,y_{adef}^h,y_{hatt}^a,y_{hdef}^a,y_{aatt}^a,y_{adef}^a\}\) refer to the rating features of the home, h, and away, a, team of match Y.
The basic idea of boosted trees is to learn a number of weak tree classifiers that are combined into one ensemble model (Friedman 2001). We used the R package xgboost (Chen et al. 2017) to implement the ensembles of extreme gradient boosted trees. The reason why we chose XGBoost is that it has shown excellent performance in a number of recent data mining competitions: 17 out of 29 Kaggle challenge winning solutions used XGBoost (Chen and Guestrin 2016). XGBoost is therefore arguably one of the currently top-performing supervised learning algorithms. Building an ensemble of decision trees with XGBoost involves the optimization of the following parameters:
-
Maximum tree depth, \(d_{\max }\) Larger values lead to more complex (deeper) trees, which might be prone to overfitting;
-
Learning rate, \(\eta \) This shrinkage parameter is a weighting factor for new trees being added to the ensemble; the smaller the value of \(\eta \), the smaller the improvements by the added trees;
-
Training set subsampling, \(r_n\) Random subsampling ratio for the training set to avoid overfitting; for example, \(r_n = 0.8\) means that only 80% of the training cases are used by each tree;
-
Feature subsampling, \(r_f\) Random subsampling ratio for the features; for example, \(r_f = 0.8\) means that each tree selects only 80% of the available features;
-
number of trees in the ensemble, t.
All analyses and implementations were carried out in the R environment (R Core Team 2017). Supplementary materials are provided at the project website.Footnote 5
7 Experiments and results
7.1 Comparison between the recency feature extraction method and the rating feature learning method
Table 5 shows the 28 leagues and 5 seasons used to generate the rating feature learning set, which contains \(N_{rat} = 31{,}318\) games. For a fair comparison of our methods, it was necessary that we limited the recency feature extraction method to the same games. This led to a recency feature learning set of \(N_{rec} = 30{,}860\) games. The difference of \(31{,}318 - 30{,}860 = 458\) matches is due to the fact that we have to wait until each team has built up a history of n matches (here, \(n = 9\)) before meaningful values can be extracted for all features. Using the same matches, we then trained both k-NN and XGBoost and used the resulting models to predict the 206 matches of the Challenge prediction set.
7.1.1 k-NN trained on recency feature learning set
The recency feature learning set of \(N_{rec} = 30{,}860\) games was randomly split into a training set of 27, 774 games (90%) and a hold-out test set of 3086 games (10%). We built k-NN models using the training set, with k ranging from 2 to 250, and applied each model to the hold-out test set. We observed the best performance of \(\mathrm {RPS}_\mathrm {avg} = 0.2174\) for \(k_{\mathrm {opt}} = 125\). With this optimal number of nearest neighbors, the model achieved \(\mathrm {RPS}_\mathrm {avg} = 0.2164\) on the prediction set. However, 5 of 206 prediction matches could not be described by a set of recency features because of the league-hopping problem (cf. Sect. 3.2). Therefore, we estimated the feature vector for each of the five matches as follows. To impute the jth feature of the ith game, \(F_{ij}\), \(i = 1\ldots 5\) and \(j = 1\ldots 72\), we calculate the average recency feature value over all games that were played in the same league as that of the ith game, \(F_{ij} = \frac{1}{n} \sum _{k=1}^n F_{kj} I(i,k)\), where the indicator function I(i, k) equals 1 if the league of match i and match k are the same, and 0 otherwise.
7.1.2 k-NN trained on rating feature learning set
The rating feature learning set of \(N_{rat} = 31{,}318\) games was randomly split into a training set of 28, 186 games (90%) and a hold-out test set of 3132 games (10%). As before, we built k-NN models using the training set, with k ranging from 2 to 250, and applied each model to the hold-out test set. We observed the best performance of \(\mathrm {RPS}_\mathrm {avg} = 0.2088\) for \(k_{\mathrm {opt}} = 248\). With this optimal number of nearest neighbors, the model achieved \(\mathrm {RPS}_\mathrm {avg} = 0.2059\) on the prediction set.
7.1.3 XGBoost trained on recency feature learning set
We carried out a grid search over the following parameter space: \(d_{\max } \in \{1, 2, 3, 4, 5 \}\), \(\eta = 0.06\), \(r_n \in \{0.7, 1.0 \}\), \(r_f \in \{0.8, 1.0 \}\), and \(t \in \{1, 2, \ldots , 1000\}\). We tested all combinations of values, leading to \(d_{\max } \times \eta \times r_n \times r_f \times t = 20{,}000\) models. We observed the best (three-fold stratified) cross-validated performance of \(\mathrm {RPS}_\mathrm {avg} = 0.2112\) for \(d_{\max } = 3\), \(\eta = 0.06\), \(r_n = 0.7\), \(r_f = 1.0\), and \(t = 284\). This model achieved \(\mathrm {RPS}_\mathrm {avg} = 0.2113\) on the hold-out test set (Fig. 4).

Average ranked probability score in the recency feature training set (black curve) and the recency feature hold-out test set (red curve) as a function of the number of trees in the ensemble. The dotted blue line shows the performance of the best model from cross-validation, with \(d_{\max } = 3\), \(\eta = 0.06\), \(r_n = 0.7\), \(r_f = 1.0\) and \(t = 284\) (Color figure online)
Finally, we used again the entire recency feature learning set (i.e., learning set plus hold-out test set) and built a final ensemble with the optimized parameters (\(d_{\max } = 3\), \(\eta = 0.06\), \(r_n = 0.8\), \(r_f = 1.0\), and \(t = 284\)). This model achieved \(\mathrm {RPS}_\mathrm {avg} = 0.2152\) on the prediction set.
7.1.4 XGBoost trained on rating feature learning set
From the rating feature learning set with 31,318 matches, we randomly selected 3132 (10%) as hold-out test cases. The remaining \(31{,}318 - 3132 = 28{,}186\) cases are the training set. We first explored again various parameter settings to gauge plausible values for the grid search. Here, we did not consider feature subsampling because the rating feature learning set contains only eight features. We limited the search space to the following parameter values, \(d_{\max } \in \{1, 2, 3, 4, 5 \}\), \(\eta = 0.06\), \(r_n = \{0.7, 0.8, 0.9, 1.0 \}\), and \(t \in \{1, 2, \ldots , 1000\}\). Each of the \(d_{\max } \times \eta \times r_n \times t = 20{,}000\) models was then evaluated in threefold stratified cross-validation. We obtained the lowest average ranked probability score of \(\mathrm {RPS}_{\mathrm {avg}} = 0.2086\) for \(d_{\max } = 5\), \(\eta = 0.06\), \(t = 84\), and \(r_n = 0.9\). On the hold-out test set, this model achieved \(\mathrm {RPS}_\mathrm {avg} = 0.2060\). As we can see in Fig. 5, adding more trees to the ensemble does not further improve the performance on the hold-out test set.
Finally, to predict the 206 matches of the prediction set, we used the entire learning set (i.e., training set plus hold-out test set) to build an ensemble with the parameters that resulted in the lowest cross-validated \(\mathrm {RPS}_\mathrm {avg}\). This final ensemble achieved \(\mathrm {RPS}_\mathrm {avg} = 0.2023\) on the prediction set.

Average ranked probability score in the rating feature training set (black curve) and the rating feature hold-out test set (red curve) as a function of the number of trees in the ensemble. The dotted blue line shows the performance of the best model from cross-validation, with \(d_{\max } = 5\), \(\eta = 0.06\), \(r_n = 0.9\), and \(t = 84\) (Color figure online)
Table 6 summarizes the results for the hold-out test set and the Challenge prediction set.
Both k-NN and XGBoost performed better on the rating feature learning set than on the recency feature learning set. XGBoost and rating feature learning set achieved the overall best performance, with \(\mathrm {RPS}_{\mathrm {avg}} = 0.2023\). These results suggest that the rating feature learning method leads to a more informative learning set than the recency feature extraction method.
7.2 Models submitted to the 2017 Soccer Prediction Challenge
The 2017 Soccer Prediction Challenge had a strict time frame, and we were not able to complete the experiments described in the previous section before the submission deadline. Specifically, we considered only two combinations, (i) k-NN and rating feature learning set, and (ii) XGBoost and recency feature learning set. Below, we describe these experiments and the resulting predictions that we submitted to the Challenge.
7.2.1 k-NN trained on rating feature learning set
Using the rating feature learning set (\(N_{rat} = 31{,}318\)), we implemented the k-NN algorithm. We randomly split the rating feature learning set into a single training set (\(N_{train} = 26{,}620\); \(85\%\)) and test set (\(N_{test} = 4698\); \(15\%\)). In order to find an optimal value for k, we needed to determine the k nearest neighbors for each instance in the test set. This means we had to perform \(4698 \times 26{,}620 = 125{,}060{,}760\) distance computations (plus checking and sorting operations) for each k value. Thus, after some experimentation with different k values, we varied k from 50 to 85 in steps of 5, and predicted for each k the outcome probabilities of each match in the test set from k nearest neighbors in the training set. With this procedure, we determined the optimal value as \(k_{\mathrm {opt}} = 70\) based on the best averaged ranked probability score (Eq. 10), \(\mathrm {RPS}_{\mathrm {avg}} = 0.2105\), achieved on the test set.
We used the k-NN model with the optimal value of \(k_{\mathrm {opt}} = 70\) to predict the outcome probabilities in the 206 matches of the prediction set.
7.2.2 XGBoost trained on recency feature learning set
First, we applied the recency feature extraction method to the entire Challenge data set. This resulted in a recency feature learning set of 207,280 matches, which we split into a training set comprising 186,552 (90%) and a hold-out test set of 20,728 (10%) matches. Then, we carried out a randomized parameter optimization procedure. The nominally best parameters were those that resulted in the lowest average ranked probability score, \(\mathrm {RPS}_\mathrm {avg}\), in threefold stratified cross-validation. We obtained the following nominally best parameters: \(d_{\max } = 1\), \(\eta = 0.06\), \(r_n = 0.7\), \(r_f = 0.8\), and \(t = 844\), which resulted in the lowest cross-validated average ranked probability score of \(\mathrm {RPS}_\mathrm {avg} = 0.2143\).
Next, we checked the performance on the hold-out test set. Using \(d_{\max } = 1\), \(\eta = 0.06\), \(r_n = 0.7\), and \(r_f = 0.8\), we built 1000 ensembles, where the first ensemble consists of one tree, the second ensemble consists of two trees, and so on. We applied each ensemble to the test set and observed the best performance (\(\mathrm {RPS}_\mathrm {avg} = 0.2142\)) for the ensemble consisting of \(t = 806\) trees.
Finally, we used the entire recency feature learning set (i.e., training set plus hold-out test set) and built an ensemble with the parameters \(d_{\max } = 1\), \(\eta = 0.06\), \(r_n = 0.7\), \(r_f = 0.8\), and \(t = 806\). This model was used to predict the matches of the prediction set. The features of the five matches that could not be described by a set of recency features were imputed as described in Sect. 7.1.1. The predictions of the XGBoost model were submitted to the 2017 Soccer Prediction Challenge.
7.2.3 Null models
We constructed two slightly different null models (or baseline models), League Priors and Global Priors, for which we used only the prior information of home win, draw, and loss probabilities estimated from the Challenge learning set.
In the Global Priors null model, the prior probability of “win” was calculated as the proportion of home wins in the Challenge learning set. This prior was then used as estimated posterior probability of “win” in the prediction set. The probabilities of “draw” and “loss” were calculated analogously. The priors for the Global Priors null model were calculated as \(P(\mathrm {win}) = 0.4542\), \(P(\mathrm {draw}) = 0.2711\), and \(P(\mathrm {loss}) = 0.2747\).
The League Priors null model was constructed from the prior probabilities of “win”, “draw”, and “loss” for each of the 52 leagues individually (Fig. 3). These priors were then used as estimated probabilities for “win”, “draw”, and “loss” per league. For example, the proportion of “win”, “draw”, and “loss” for league GER1 in the Challenge learning set are 0.468, 0.245, and 0.287, respectively, whereas the corresponding priors in league FRA1 are 0.463, 0.288, and 0.250. These priors were used to predict the matches in the prediction set.
7.2.4 Results for the 2017 Soccer Prediction Challenge
Table 7 shows the ranking of all valid submissions to the 2017 Soccer Prediction Challenge, including our models (Team DBL). We submitted the predictions of two models to the 2017 Soccer Prediction Challenge: k-NN trained on the rating feature learning set and XGBoost trained on the recency feature learning set. Among all submissions, the k-NN model achieved the lowest error, with \(\mathrm {RPS}_\mathrm {avg} = 0.2054\). The XGBoost model achieved only fifth place, with \(\mathrm {RPS}_\mathrm {avg} = 0.2149\). Since our submissions were out-of-competition, the winner of Challenge is team OH, with \(\mathrm {RPS}_\mathrm {avg} = 0.2063\).
8 Discussion
Goals in soccer are the most important match events because they directly determine the outcome (i.e., win by either team or draw) of the match and ultimately the result of any soccer competition. Thus, the assumption is that the goals in soccer carry crucial information in terms of assessing the relative strength of the teams—the winning team is stronger than the losing team because it scored more goals; the higher the margin of victory, the greater the difference in strength. Therefore, it is reasonable to hypothesize that it is possible to construct a predictive model based on goal information alone.
We developed two novel methods to produce meaningful predictive features for soccer outcome prediction: recency feature extraction and rating feature learning. With these methods, we generated a recency feature learning set and a rating feature learning set, which are readily amenable to supervised learning. We built an ensemble of gradient boosted trees (XGBoost) and a k-nearest neighbor (k-NN) model, respectively. Among all submissions to the 2017 Soccer Prediction Challenge, the k-NN model derived from the rating feature learning set achieved the overall best performance with a score of \(\mathrm {RPS}_{\mathrm {avg}} = 0.2054\) (Table 7). With \(\mathrm {RPS}_{\mathrm {avg}} = 0.2149\), the XGBoost model was ranked fifth in the competition. Note that these two models were built using different learning sets. After the Challenge deadline, we carried out a more exhaustive analysis and considered all combinations of learning algorithms and data sets. Here, we observed that both XGBoost and k-NN performed better on the rating feature learning set. Overall, the best performance (\(\mathrm {RPS}_\mathrm {avg} = 0.2023\)) was achieved by XGBoost using rating features. These results suggest that the rating feature learning method is superior to the recency feature extraction method.
Interestingly, Team OH (winner of the 2017 Soccer Prediction Challenge) also used gradient boosted trees, but achieved only \(\mathrm {RPS}_\mathrm {avg} = 0.2063\). Our k-NN model trained on rating features outperformed the winning model. The learning sets being used are decisive, and the key to success seems to be how well domain knowledge can be integrated into the modeling process.
One aspect that makes soccer so popular (and prediction based on goals alone so difficult) is that the final outcome of the majority of soccer matches is uncertain until the end. This is because goals are relatively rare, and the margin of victory for the winning team is relatively low for most matches. From the Challenge learning set, we estimate the average number of home goals, \(\bar{g}_h\), and away goals, \(\bar{g}_a\), in regular league soccer as follows: \(\bar{g}_h=1.483\) and \(\bar{g}_a=1.111\). This means that, on average, the home team prevails over its opponent by a margin of 0.372 goals (reflecting the home advantage in league soccer). Moreover, when we look at the distribution of the margin of victory, we find that \(86.71\%\) of all matches end either in a draw or a victory of either team by a margin of two or fewer goals difference, and \(95.47\%\) are either a draw or a win by either team of three or fewer goals. Because of this overwhelming concentration of the margin of victory to only 0 (draw), 1, 2 and 3 goals, it is unlikely that this difference provides a highly accurate view of the actual difference in strength of the two teams. Therefore, it is very difficult to make meaningful predictions based on goals alone.
The problem with rare goals and low winning margins is that any scheme will generally find it difficult to discriminate team strength based on goals or goal difference. Consider an away goal prediction of \(\hat{g}_a = 1.50\). For a considerable proportion of games (ca. \(45\%\)), the observed number of away goals is \(g_a = 1\) or \(g_a = 2\). For all of these games, a prediction of \(\hat{g}_a = 1.50\) is equally good or poor, as the deviation is 0.5 goals.
The objective of the 2017 Soccer Prediction Challenge was to get an idea as to how well we can predict league soccer outcomes by using match information that is readily available for many leagues around the world. Our own best results and those of the three top-ranked participants are around an average RPS of 0.21. It is therefore tempting to speculate that this result is close to the limit of predictability, given the provided data. The Challenge data sets remain publicly available at the project website at https://osf.io/ftuva/ for further analyses.
Is it possible to significantly improve the performance by obtaining more data that hold information relevant to the outcome of a match? Many different types of data are potentially relevant, including data about game events (e.g., yellow and red cards, fouls, ball possession, passing and running rates, etc.), players (e.g., income, age, physical condition) and teams or team components (e.g., average height, attack running rate). A major problem, of course, is the availability of such data. For example, simple statistics like the number of fouls committed are readily available for some top leagues. However, if we want to predict the outcome of games in lower leagues (e.g., GER2 or ENG4), such data may not be readily available. Even more sophisticated data like heat maps showing movements of players on the field during a match may never become widely available for a large number of teams or players (Van Haaren et al. 2015, 2016).
However, here we need to sound a few notes of caution. First, additional data will not solve the problem due to the small number of goals or address the narrow-margin-of-victory aspect in soccer. Second, and this is even more fundamental, goals and other game-changing circumstances (e.g., red cards, injuries, penalties) in soccer often do not occur as a result of superior or inferior play by one team but are due to difficult-to-capture events, such as poor refereeing, unfortunate deflections or bounces of the ball, weather or ground conditions, or fraudulent match manipulation. Third, factors like political upheaval in the club’s management, behavior of spectators, media pressure, and fluctuation of club player squads also influence the outcome of matches. Even with sophisticated data sets, such aspects may not be covered.
9 Conclusions
Predicting the outcome of sports events remains an immensely challenging task. The objective of the 2017 Soccer Prediction Challenge was to gauge the limit of predictability, given readily available soccer data. Like with many other real-world prediction problems, the main challenge in this study was not to develop a new learning algorithm, but the question how relevant domain knowledge can be incorporated in the model development process, from data processing and integration, to model development, application, revision, and maintenance (Rudin and Wagstaff 2014). We hypothesize that innovative feature engineering approaches hold the key to success. How well can we incorporate domain knowledge into the modeling process? We believe that the answer to this question ultimately matters far more than the choice of the machine learning algorithm for subsequent supervised learning.
Notes
This problem has reared its ugly head in the Challenge prediction set. It contains five teams that have fewer than nine recent matches in the entire Challenge learning set. This is because until the recently started 2017/2018 season, these teams have never featured in any of the 52 leagues covered in the Challenge learning set over the 2000/2001–2016/2017 seasons.
Here, T stands for “team”, i.e., without differentiating whether a home team or away team is denoted.
Note that only two ratings per team are updated per match depending on whether they play at their home venue or at the opponent’s venue.
Enhanced version according to Shi and Eberhart (1998).
References
Angelini, G., & De Angelis, L. (2017). PARX model for football match predictions. Journal of Forecasting, 36(7), 795–807.
Berrar, D., Bradbury, I., & Dubitzky, W. (2006). Instance-based concept learning from multiclass DNA microarray data. BMC Bioinformatics, 7(1), 73.
Brodley, C. E., & Smyth, P. (1997). Applying classification algorithms in practice. Statistics and Computing, 7(1), 45–56.
Chen, T., & Guestrin, C. (2016). XGBoost: Reliable large-scale tree boosting system. In: M. Shah, A. Smola, C. Aggarwal, D. Shen, & R. Rastogi (Eds.) Proceedings of the 22nd ACM SIGKDD conference on knowledge discovery and data mining, San Francisco, CA, USA (pp. 785–794).
Chen, T., He, T., Benesty, M., Khotilovich, V., & Tang, Y. (2017). xgboost: Extreme gradient boosting. https://CRAN.R-project.org/package=xgboost, R package version 0.6-4. Further documentation at https://xgboost.readthedocs.io/en/latest/. Accessed 24 July 2018.
Constantinou, A. (2018). Dolores: A model that predicts football match outcomes from all over the world. Machine Learning. https://doi.org/10.1007/s10994-018-5703-7.
Constantinou, A., & Fenton, N. (2012). Solving the problem of inadequate scoring rules for assessing probabilistic football forecast models. Journal of Quantitative Analysis in Sports, 8(1). https://doi.org/10.1515/1559-0410.1418.
Cover, T., & Hart, P. (1967). Nearest neighbor pattern classification. IEEE Transactions on Information Theory IT, 13(1), 21–27.
Dixon, M., & Coles, S. (1997). Modelling association football scores and inefficiencies in the football betting market. Applied Statistics, 46(2), 265–280.
Dubitzky, W., Lopes, P., Davis, J., & Berrar, D. (2018). The Open International Soccer Database. Machine Learning. https://doi.org/10.1007/s10994-018-5726-0.
Dudoit, S., Fridlyand, J., & Speed, T. (2002). Comparison of discrimination methods for the classification of tumors using gene expression data. Journal of the American Statistical Association, 97(457), 77–87.
Elo, A. E. (1978). The rating of chessplayers, past and present. London: Batsford.
Epstein, E. S. (1969). A scoring system for probability forecasts of ranked categories. Journal of Applied Meteorology, 8(6), 985–987.
Forrest, D., Goddard, J., & Simmons, R. (2005). Odds-setters as forecasters: The case of English football. International Journal of Forecasting, 21(3), 551–564.
Friedman, J. (2001). Greedy function approximation: A gradient boosting machine. The Annals of Statistics, 29(5), 1189–1232.
Goddard, J. (2005). Regression models for forecasting goals and match results in association football. International Journal of Forecasting, 21(2), 331–340.
Gómez, M., Pollard, R., & Luis-Pascual, J. (2011). Comparison of the home advantage in nine different professional team sports in Spain. Perceptual and Motor Skills, 113(1), 150–156.
Hill, I. (1974). Association football and statistical inference. Applied Statistics, 23(2), 203–208.
Hubáček, O., Šourek, G., & Železný, F. (2018). Learning to predict soccer results from relational data with gradient boosted trees. Machine Learning. https://doi.org/10.1007/s10994-018-5704-6.
Hvattum, L. M., & Arntzen, H. (2010). Using ELO ratings for match result prediction in association football. International Journal of Forecasting, 26(3), 460–470.
Kennedy, J., & Eberhart, R. (1995). Particle swarm optimization. In Proceedings of IEEE international conference on neural networks (Vol. 4, pp. 1942–1948).
Maher, M. (1982). Modelling association football scores. Statistica Neerlandica, 36(3), 109–118.
O’Donoghue, P., Dubitzky, W., Lopes, P., Berrar, D., Lagan, K., Hassan, D., et al. (2004). An evaluation of quantitative and qualitative methods of predicting the 2002 FIFA World Cup. Journal of Sports Sciences, 22(6), 513–514.
R Core Team. (2017). R: A language and environment for statistical computing. R Foundation for Statistical Computing, Vienna, Austria. https://www.R-project.org/. Accessed 24 July 2018.
Reep, C., & Benjamin, B. (1968). Skill and chance in association football. Journal of the Royal Statistical Society, Series A (General), 131(4), 581–585.
Rudin, C., & Wagstaff, K. L. (2014). Machine learning for science and society. Machine Learning, 95(1), 1–9.
Shi, Y., & Eberhart, R. (1998). A modified particle swarm optimizer. In Proceedings of IEEE international conference on evolutionary computation (pp. 69–73).
Spann, M., & Skiera, B. (2008). Sports forecasting: A comparison of the forecast accuracy of prediction markets, betting odds and tipsters. Journal of Forecasting, 28(1), 55–72.
Tsokos, A., Narayanan, S., Kosmidis, I., Baio., G., Cucuringu, M., Whitaker, G., & Király, F. (2018). Modeling outcomes of soccer matches. Machine Learning. (to appear).
Van Haaren, J., Dzyuba, V., Hannosset, S., & Davis, J. (2015). Automatically discovering offensive patterns in soccer match data. In E. Fromont, T. De Bie, & M. van Leeuwen (Eds.) International symposium on intelligent data analysis. Lecture notes in computer science, Saint-Étienne, France, October 22–24, 2015 (pp. 286–297). Springer, Berlin.
Van Haaren, J., Hannosset, S., & Davis, J. (2016). Strategy discovery in professional soccer match data. In Proceedings of the KDD-16 workshop on large-scale sports analytics (LSSA-2016) (pp. 1–4).
Wu, X., Kumar, V., Quinlan, J. R., Ghosh, J., Yang, Q., & Hea, M. (2008). Top 10 algorithms in data mining. Knowledge and Information Systems, 14(1), 1–37.
Zambrano-Bigiarini, M., & Rojas, R. (2013). A model-independent particle swarm optimisation software for model calibration. Environmental Modelling & Software, 43, 5–25.
Acknowledgements
We thank the three anonymous reviewers for their detailed comments that have helped us a lot to improve this manuscript.
Author information
Authors and Affiliations
Corresponding author
Additional information
Publisher's Note
Springer Nature remains neutral with regard to jurisdictional claims in published maps and institutional affiliations.
Editor: Jesse Davis.
Rights and permissions
About this article

Cite this article
Berrar, D., Lopes, P. & Dubitzky, W. Incorporating domain knowledge in machine learning for soccer outcome prediction. Mach Learn 108, 97–126 (2019). https://doi.org/10.1007/s10994-018-5747-8
Received:
Accepted:
Published:
Issue Date:
DOI: https://doi.org/10.1007/s10994-018-5747-8