
Abstract
Fake news has a worldwide impact and the potential to change political scenarios and human behavior, especially in a critical time like the COVID-19 pandemic. This work suggests a Soft Three-Level Voting Model (Soft T-LVM) for automatically classifying COVID-19 fake news. We train different individual machine learning algorithms and different ensemble methods in order to overcome the weakness of individual models. This novel model is based on the soft-voting technique to calculate the class with the majority of votes and to choose the classifiers to merge and apply at every level. We use the Grid search method to tune the hyper-parameters during the process of classification and voting. The experimental evaluation confirms that our proposed model approach has superior performance compared to the other classifiers.
1 Introduction
1.1 Context and motivations
The immense growth of social media platforms in recent years has facilitated communication between people worldwide. The information is circulating effortlessly and fluidly in the social network, which leads to information availability. However, the lack of control over this information produces misinformation and fake news proliferation (Zhang et al., 2022). Fake news can have dramatic impacts on society, the government, and individuals (Kwon et al., 2013) with dangerous consequences related to different areas, such as the political one. As shown in the 2016 US presidential election (Bovet & Makse, 2019), we have thousands of fake posts, news stories, and claims that were shared, and hundreds of fake blogs and pages that were created. Since then, several and rigorous kinds of research have been carried out to fight this phenomenon (Galli et al., 2022).
Unfortunately, since the Public Health Emergency of International Concern (PHEIC) (Hua & Shaw, 2020) declared the coronavirus (COVID-19) an international pandemic, social media platforms have become a hub for misinformation dissemination. This misinformation caused a substantial negative impact on users, leading to deadly consequences, especially in sharing the fake treatments and cures suggested at the time (Sear et al., 2020). The General Director of the World Health Organization (WHO), Tedros Adhanom Ghebreyesus, has declared that we are not just fighting an epidemic; we are fighting an infodemic. Fake news spreads faster and more easily than this virus, and is just as dangerous (Hua & Shaw, 2020).
Similar to how diseases spread among individuals and advance rapidly, this tendency is magnified by social media and spreads faster and farther (Hua & Shaw, 2020). This has been said by the architect of the WHO’s strategy to defeat the infodemic danger. Furthermore, according to Brennen et al. (2020), 59% of Twitter posts related to the COVID-19 pandemic were false. The devastating impacts of this infodemic are countless. Therefore, several manual fact-checking websites have been developed substantially and were highlighted as one of the most promising solutions for detecting false news to overcome this global infodemic (Kaur et al., 2020). However, it is still not enough, especially with the massive number of fake posts shared daily.
As a result, numerous studies have been conducted to automate COVID-19 fake news detection using machine and deep learning models in conjunction with Natural Language Processing techniques (Jivani, 2011) and (Deepak and Chitturi, 2020).
In Patwa et al. (2021), researchers proposed a dataset composed of numerous COVID-19 news items collected from different social platforms, on which they trained different individual machine learning models and achieved an Accuracy of 93.46%. However, this result can be improved using other techniques in the feature extraction or modeling steps.
The main contributions of this paper can be summarized as follows: This work will suggest a novel Soft Three-Level Voting Model (T-LVM) for fake news detection utilizing the concept of ensemble voting (Ahmad et al., 2020) in the classification phase and the technique of N-gram frequencies (Ahmed et al., 2017) with the Bag-Of-Words and TF-IDF vectors in the feature extraction phase. Further details will be given in the next section.
1.2 Our contributions
In this paper, we are interested mainly in detecting COVID-19 fake news diffused on social networks, especially Twitter. Our model shows how to use the content of existing claims to figure out if they are fake news or not.
We have three major contributions. First, we propose an ensemble voting model based on the False-negative rate and soft voting. On the one hand, lowering the false negative rate improves the quality of how we classify COVID-19 tweets by making it easier to catch fake claims that are thought to be real. In fact, this metric tackles the problem of fake news that is treated as true, which is more important than a true positive one. On the other side, soft voting is a kind of voting where every individual classifier provides a probability value that a specific data point belongs to a particular target class. The predictions are weighted by the classifier’s importance and summed up. Then the target label with the greatest sum of weighted probabilities wins the vote. Soft voting gives more chances to merge more predictions into the final prediction of the voters. We are simulating the principle of diversification in evolutionary algorithms (Azzouz et al., 2015). We can say that this is a novel ensemble voting model because we are the first and only authors to combine the False-negative rate and the soft voting process instead of the hard voting. This novel voting process, guided by both the Accuracy and the False-negative rate gives the developed model the opportunity to solve the trade-off issue between Accuracy and efficiency. A series of experiments were conducted to validate the performance of our proposed new voting process. Extensive tests show that our proposed model is better than the existing works of literature when it comes to detecting fake news using machine learning. We illustrate that the performance of our soft Three Level voting model achieved an Accuracy of 94.43%.
The second contribution consists of the inclusion of the concept of a multi-level architecture, which gives us the possibility to redo the classification and the voting process on a separate level and enables us to easily follow the fake claims. We establish the importance of the grid search matrix to memorize the best parameters. We realized several steps to improve these results in this work, starting by tuning the models’ hyperparameters, which improved the model’s Accuracy. To design our proposed architecture, we have added a classification and voting level on top of the individual classifiers, and finally calculated the evaluation parameters of each model in terms of average Accuracy. We advocated that merging the models into one first-level voting model gave us promising results. This fact encourages us to perform other levels of classification voting. The multiple levels were a crucial factor in the enhancement of the outputs of our model. The most important step was to automatically classify the claims using ratio analysis and evaluation to show the numbers and percentages of fake or real news. Our model has the specificity of being the first model that decides the number of levels to perform. Hence, the number of levels is generic and can be different from one dataset to another. We can say that our model is simulating the auto-ML principle.
The third contribution involves the application of various feature extraction techniques and frequencies, with the result being clearly improved in the case of using TF-IDF (2 gram). Our experiments can accurately measure the precision of our classification. Several performance evaluation parameters (positive and negative rates) have been taken into consideration to validate the classification results.
We have some other minor contributions, which are as follows: -Statistical analysis of the tweets in the dataset: we are the first authors to do an exploratory analysis with fake or real claims. -A comparative study with other machine learning approaches has been done to show the effectiveness of our proposed model. The performance of our contributions is analyzed using parameters like precision, recall, F1-score, and Accuracy.
This work is divided as follows; Section two is the state-of-the-art section, where we will give a deeper insight into the fake news phenomenon. This section gives the basic background of the context of our project, which is fake news on social networks, and the concept of ensemble learning models. The related works based on individual and ensemble voting models done in this field, for fake news detection will be detailed in Section three. Section four represents our suggested model with a detailed representation of each step. This section also covers the fundamentals of natural language processing, as well as the feature extraction and classification phases. To show the whole classification and voting process, a detailed flowchart and detailed algorithms will be used. The fifth section is the experiments and results section, in which, we will discuss the obtained results individually and when compared to the ones published in Patwa et al. (2021). Section six concludes the paper, along, with the future works and scopes.
2 Preliminaries
Numerous studies have been conducted in the literature to detect fake news. In this section, we will define the different concepts used in our work, such as “fake news” and its detailed representation, from its definition to the components and features of fake posts. Then we will detail the three types of ensemble learning methods: bagging, boosting, and voting. Finally, we will review the research on the different ways to spot fake news,
2.1 Fake news
False information is generally determined as “information pollution,” which has many formats as shown below (Vishwakarma, 2020).
-
Rumor: It is unverified news, not necessarily erroneous information. It can also be true.
-
Fake News: Circulating false information by News agencies or the internet to gain political or financial information and enhance reading and public opinion.
-
Misinformation: Circulating information that becomes erroneous through error, negligence, or cognitive distortion inadvertently.
-
Disinformation: A determined intentionally misleading information.
-
Clickbait: False titles to induce users to click on a specific website.
-
Hoax: Generally used to mask reality, mainly through jokes, comedy, and intentional falsehood.
-
Satire/parody: Articles that feature humor and irony solely do not have harmful intent but can be foolish. The Onion and satirical cable are sources of satirical news.
-
Opinion Spam: Fake or purposely biased product and service reviews or comments.
-
Propaganda: Information that spreads in specific communities according to a plan for promoting a specific policy or agenda.
According to Zhang and Ghorbani (2020), “Fake news” refers to all kinds of false stories or news that are mainly published and distributed on the Internet, to purposely mislead, befool, or lure readers for financial, political, or other gains”. In Deepak and Chitturi (2020), the deliberate dissemination of false information to sway the public’s opinion is known as “fake news.” We represent the critical and commonly used features based on the fake news components for online detection.
There are three main types of feature sets:
-
Creator/user-based features: Are widely used to detect suspicious online accounts. There are three categories of these features, user profiling features (account name, geolocation information, verified account or not), user credibility features (number of friends, number of followers), and user behavior features (the number of the user’s interactions in a time window divided by the user’s monthly average).
-
News content-based features: They are characterized as linguistic and syntactic-based features, style-based features, and visual-based features (Dickerson et al., 2014). Linguistic and syntactic-based features are the most studied types of features. They use Natural Language Processing (NLP) features such as Bag-Of-Word, TF-IDF, N-gram, Parts Of Speech tagging(POS) to detect fake news. Textbftextit-style-based features seek to detect the various writing style characteristics of fake news authors. Textbftextit—Visual-based features are such as images and videos containing news. These features are very critical cues for detecting fake posts or claims.
-
Social context-based features: Are intended to represent online news distribution patterns and online user involvement (Kwon et al., 2013). They are characterized as network-based features, distribution-based features, and temporal-based features.
-
-Network-based features: Are concentrated on a group of comparable internet users with various viewpoints such as location, educational background, and habits.
-
-Distribution-based features: Are captured the distinct diffusion pattern of online news.
-
-Temporal-based features: Are used to describe the posting behavior of online news creators in a time-series manner.
-
2.2 Ensemble learning models
Ensemble learning combines different machine learning models to make a better model that is more accurate overall by taking into account the flaws of the individual predictors.
Nowadays, ensemble learning methods have become more prominent than classic machine learning models in various classification tasks like fake news detection and malware detection (Kaur et al., 2020).
Generally, there are three types of ensemble learning methods: Bagging Ensemble Classifiers, Boosting Ensemble Classifiers and Voting Ensemble Classifiers. Bagging Ensemble Classifiers (González et al., 2022) is an early ensemble method mainly used to reduce the variance (overfitting) over a training by applying the bootstrap aggregation method to an ensemble of individual classifiers fitted on random subsets of the original dataset. The Random Forest algorithm is one of the most frequently used variants of a bagging classifier in the detection of fake news (Kwon et al., 2013).
Boosting Ensemble Classifiers is a form of sequential learning technique. Several models are typically used in boosting techniques, such as eXtreme Gradient Boosting (XGBoost), Gradient Boosting Machine (GBM) and Adaptive Boosting (AdaBoost). Voting is a meta-classifier that combines several individual classifiers using different combination rules. The base classifier can be any machine learning model. Individual base-predictors are trained on training data. The output of these base-predictors is combined using some combination rules like majority voting (Kwon et al., 2013). Majority voting is also known as “hard voting,” as the class with the most votes is considered the input article’s final class. In soft-voting, the final class has the highest probability averaged over the individual classifiers. Voting methods have been used in numerous classification tasks, such as fake news detection and spam detection (Kaur et al., 2020). In this work, we will use the soft-voting technique to calculate the class with the most votes.
3 Existing works for fake news detection
Kaur et al., (2020) proposed a Multi-Level voting ensemble model based on twelve classifiers and three feature extraction techniques such as Term Frequency–Inverse Document Frequency (TF–IDF), Count-Vectorizer (CV), and Hashing-Vectorizer (HV), tested on three different datasets. The proposed model is composed of three voting levels. At each level, the merged models are obtained based on the False Positive rate. Results showed that the Passive Aggressive (Iftikhar et al., 2020), Logistic Regression, and Linear Support Vector Classifier (LinearSVC) individually performed best using the TF-IDF, CV, and HV feature extraction approaches, respectively, based on their performance metrics. In contrast, the proposed model outperforms the Passive-Aggressive model by 0.8%, the Regression model by 1.3%, and the linear SVC model by 0.4% using TF-IDF, CV, and HV, respectively.
Gilda, (2017) has applied multiple machine learning algorithms to a public benchmark, such as Random Forests, SVM, Bounded Decision Trees, Stochastic Gradient Descent and Gradient Boosting using TF-IDF bi-gram frequency, and the Probabilistic Context-Free Grammar (PCFG) as feature extraction techniques. The results show that the best Accuracy percentage was from the Stochastic Gradient Descent using the TF-IDF bi-gram frequency, which is about 77.2%. In the Ahmed et al. (2017) study, linguistic features such as n-grams are extracted from textual articles, and various machine learning models are trained, such as K-Nearest Neighbor (KNN), Support Vector Machine (SVM), Logistic Regression (LR), Linear Support Vector Machine (LSVM), Decision Tree (DT) and Stochastic Gradient Descent (SGD), achieving the highest Accuracy 92% with SVM and LR. Conroy et al. (2015) proposed a hybrid approach that combines machine learning and linguistic cues with network-based behavioral data. The suggested approach follows both n-gram and Bag of Words techniques to represent data. Kwon and Jun Gal (2018) suggested a comparative study of machine learning classifiers according to Binary Bag of Words (BOW), Count BOW, and TF-IDF Feature Vectors. Akhter et al. (2021) proposed a supervised ensemble learning method for automatically filtering fake news in Urdu on social media. The researchers applied the different ensemble learning algorithms of voting, boosting, and bagging. The boosting classifier outperforms the other classifiers with an Accuracy of 87.1%. In Agarwal et al. (2019), the authors used five machine learning classifiers such as Naive Bayes (NB), Logistic Regression, SVM, Stochastic Gradient, Random Forest, along with TF-IDF, Bag-of-words, and n-grams feature extraction techniques and applied them to the LIAR dataset. The SVM and Logistic Regression outperformed the other classifiers. To detect fake news, Ahmed et al. (2017) used n-gram as a feature extraction technique. Singh et al. (2017) used the SVM model with different feature extraction techniques to detect fake news. Jadhav and Thepade (2019) employed the Naive Bayes model, while Kaur et al. (2020) employed logistic regression. The Random Forests model was used by Ni et al. (2020). Recurrent Neural Network (Jadhav and Thepade, 2019), K-Nearest Neighbor (KNN) and Decision Tree (Kotteti et al., 2018) were used. Englmeier, (2021) used the text mining techniques in the COVID-19 fake news detection problem. Cui et al., (2011) detected fake news using creator-based features. Kwon et al. (2013) made use of social content-based features. Dickerson et al., (2014) used news content-based features to represent and detect fake news.
4 Our soft three-level voting model (Soft T-LVM)
Figure 1 graphically summarizes the flowchart of our proposed model, in which the general realization process is clearly represented. The flowchart is composed of different steps, such as data preprocessing and feature extraction, to vectorize the inputted data.

FlowChart of the proposed Soft T-LVM
The proposed model starts with exploring the data and then, identifying the different preprocessing steps customized to the input dataset, in order to obtain cleaned data. After dealing with the feature extraction step, which is vectorization, we will explain the machine learning modeling step in the next section, which involves the training and testing of the chosen machine learning models on the dataset. The soft voting technique will be used to choose the best model to use in the next level of our model, based on the output of the previous level, as explained above in the previous section. Dataset splitting is the next step, followed by the classification step in which we applied the soft voting technique on the five chosen individual models (SVM, RF, LR, KNN, and Multinominal NB (Mult-NB). We fix the number of levels at three, which is the optimal number we obtained after several experiments. The fact that our algorithm will stop once the number of levels is equal to three is expressed in the flowchart by the choice step. Finally, the proposed model of Soft T-LVM will proceed with the final classification result.
4.1 Data collection and exploration phases
The dataset is obtained from a competition called “Constraint@AAAI2021 - COVID19 Fake News Detection in English” (footnote): https://competitions.codalab.org/competitions Table 1 presents the source of fake and real claims. The used dataset (Patwa et al., 2021) is composed of 10.700 claims. It is split into three parts: training 60%, validation 20%, and testing 20%. However, only the training and validation datasets with 8560 claims (4480 valid and 4080 fake) were available and used in this work. The used dataset is classwise balanced, with 52.34% of the samples consisting of real news, and 47.66% of the data consisting of fake news. Moreover, the researchers maintained the class-wise distribution during the splitting step.
Our exploratory analysis by the mean of the word cloud concept shows that the difference between fake and real claims based on the weight of the words in the text. It shows that the most used words in bogus claims are ‘coronavirus’ and ‘covid19’. However, for accurate claims, we find that the most used words are ‘covid19’, ‘new case’, and ‘confirmed case.’
4.2 Data pre-processing phase
The pre-processing steps applied in this work are:
-
Lower casing: To prevent the sensitivity of upper case, convert all of the text to lower case.
-
Removal of Punctuations: Remove all of the punctuation from the text.
-
Tokenization: To alter the text and get valuable information from it, divide it into little tokens.
-
Removal of stopwords: We utilized the NLTK stopword list to eliminate all of the popular English words.
-
Stemming: Without considering the word context, remove the word’s suffix (Jivani, 2011).
-
Lemmatization: Remove all of the punctuation and return the word to its canonical form. In this part, we will detail the different steps used in order to obtain the final cleaned text. We start by turning the text into lowercase, then we remove all the unnecessary punctuation and special characters, accompanied by the dropout of stop words (defined in the library NLTK), and after that, we tokenize the text. After that, we go on to the text normalization phase (stemming and lemmatization). As a consequence, we have a text that has been cleaned up and is ready for processing.
4.3 Feature extraction phase
In this step, we explain three kinds of feature extraction techniques such as Count-word (Bag of words), TF-IDF (Term Frequency-Inverse Document Frequency), and N-grams.
4.3.1 The Bag of words feature extraction
A Bag-of-words or countV is a text representation describing the occurrence of the words in a document. Two concepts are involved: a vocabulary of known words and a measure of the existence of known words.
The occurrence matrix is a grid with sentences from the inputted dataset as rows and relevant tokens as columns. The Bag-of-words technique’s downside is that the frequencies of the words are based on their occurrence, not on their importance. Nevertheless, this feature extraction technique is prevalent in the detection of fake news problems (Conroy et al., 2015).
4.3.2 The TF-IDF feature extraction
To overcome the downside of the Bag-of-words model, we will use the TF-IDF technique, which is a statistical measure that assesses how important a word is to a document, in a document collection. The result obtained from the TF-IDF technique is the multiplication of two metrics: how often a word appears in a paper and the opposite document frequency in a document set. The text is then repeated. This method highlights unique and rare terms, or more specifically, the essential words in every text. The TF-IDF general equation is calculated with (1).
with:
The term frequency (tf) is the number of times a term(t) is in a document(d) divided by the number of terms in a document. D is the total document set.
and:
The inverse document frequency is the logarithm of the number of text (or articles) in the collection divided by the number of texts or articles where the term appears.
The TF-IDF is considered one of the most used feature extraction techniques in fake news detection problems (Kwon & Jun Gal, 2018).
4.3.3 The N-grams feature extraction
N-grams is a feature extraction technique that uses a sequence of words instead of a single one. This technique was used so often in research that studied fake news detection problems due to its ability to increase the models’ Accuracy (Gilda, 2017). Moreover, using tokens that are composed of two words is sometimes more significant than just one word. For example, a sequence of tokens “confirmed case” is more significant than two separate tokens “confirmed”, and “case”.
5 The Soft N-level classification-voting phase
As shown above, in the flowchart of our proposed model, Soft T-LVM, the process starts with collecting and exploring the data, then, identifying the different preprocessing steps, customized to the inputted dataset. After that, our model deals with the feature extraction step, which is the vectorization of the dataset. This process will be achieved only in the first level of the model. The vectorized datasets Dij (algo1, line11) will be an input to the Soft N-level classification-voting phase, described by algo1. This section will explain the soft N-level classification-voting phase, which consists of training and testing the selected machine learning models on the various newly generated datasets (textitDij) across N levels. N is initialized to 1 (algo1, line2), and updated at the end of the whole process of the classification and voting by the hyperparameters tuning step (HyperPT in algo1, line 22). In our case, N is equal to three.

Soft N-Level Classification-Voting.
The basic idea in this model is that, as a final step in every level, we will apply the voting technique to the outputs of the voters, to obtain the next Soft Three-Level Voting Models (Soft T-LVM) and the predictions. The Soft N-Level Classification-Voting phase is structured as a process based on an architecture of three levels. Three classification and voting levels are applied to obtain this architecture. We remind here that the experimental metrics issued from the current level, such as Accuracy, Precision, Recall and F1-score become the same, and that indicates a convergence of the values, so we don’t need to add another iteration and pass to the next level.
These three levels are described, as below:
-
Level1: Algo1 summarizes the steps of our proposed model for the N levels. The first initial level is different from the other levels, as shown in algo1. In fact, only in the first level, we apply the feature extraction process before classification and voting (algo1: line7, line9). A set of k classifiers (algo1, line 13) is chosen and tested in 1-gram, 2-gram, and 3-gram frequencies using the two feature extraction techniques (bag-of-words and the TF-IDF). In our model, k is equal to five, because we use only SVM, RF, LR, KNN and Multinominal NB (Mult-NB) and we omitted XGB, due to its weak results, after the evaluation process. We apply the first steps of the machine learning modeling, which are data splitting into training and testing sets (algo1, line12) and models’ training. The second step is then in the classification phase (algo1, line15). Five of these classifiers are merged based on the feature extraction vectors, by the function Soft-Voting, as shown in algo1 line18. This function takes the vector VectEij which contains False Negative rate (FN) and Accuracy. Furthermore, the base-predictors Vij(algo1, line 18) in level 1 are chosen based on the minimum (FN) rate and the maximum Accuracy rate, where the models are merged to overcome the shortcomings of the existing individual models. After applying Soft-Voting, the final class has the highest probability averaged over the individual classifiers. Soft-Voting combines different models into one final model (Voter). This voter will be added to the list of voters and the \(Y^{\prime }i\), which represents the predictions, will be updated by UpdatePredictions, after soft-voting. Finally, six voting classifiers (V1→V6) are retrieved. Thus, the algorithms chosen (SVM, Logistic Regression, Multinominal NB, and Random Forest) and the KNN are based on the maximum average Accuracy and the lowest false negative (FN) rate using the six different feature extraction vectors (BOW and TF-IDF (1-gram, 2-gram, and 3-gram)) that are merged to obtain the six ensemble voting modelsV1 → V6).
Algorithm 2 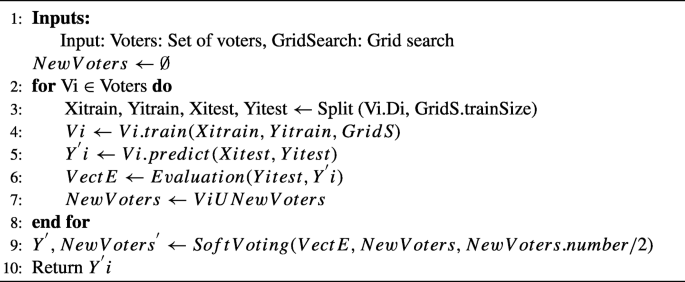
OneL-ClassificationVoting.
-
Level2: Algorithm 2 is used to process it, and we show two voting classifiers (V7, V8) that are retrieved after merging every three voting classifiers based on the frequencies of each feature extraction technique. In the next level, we apply algo2, which consists of splitting the data, training the classifiers, and giving the predictions \(Y^{\prime }i\). The Soft-Voting function (algo2, line9) will merge the outputted models into the first half of the number of the new voters. In each level, the voters merge using the soft voting technique. In fact, the choice of this number of levels was made in order to reduce the complexity of the model. It can be discussed or enhanced by hyperparameter tuning in future works. In this level, the number of initial models to take as input can also be addressed.
-
Level3: A Soft Three-Level Voting Model (Soft T-LVM) (V9) is retrieved from the last two voting classifiers. This level is processed by the loop, which stops when we have the stop criteria achieved. The number of levels is the stop criterion in this work. In the future, we can use more sophisticated stop criteria while using deep learning models, such as the convergence of the loss learning curves for both training and validation (Deepak & Chitturi, 2020).

6 Experiments
The experimental results on the different machine learning models used in this work such as SVM, RF, LR, KNN, Mult-NB, XGB, Voting Ensemble Classifiers (Voting), and Soft Three-Level Voting Model (Soft T-LVM) are represented in detail in this section.
6.1 Evaluation metrics and HyperParameters Tuning
Evaluation methods are the criteria considered to measure the performance of the used models. We will adopt the Confusion matrix, Accuracy, Precision, Recall, AUC (Area Under the receiver operating characteristic Curve) and F1-Score in this work.
-
Confusion matrix: The Confusion matrix is a performance measurement that represents four predicted and actual value combinations within the model’s entire performance.
TP (True Positives): Predict news as fake when it is fake.
FP (False Positives): Predict news as fake when it is real.
FN (False Negatives): Predict news as accurate when it is fake.
TN (True Negatives): Predict news as factual when it is real.
Our objective is to have a lower False-negative than false positive. A false negative means that the classifier predicted fake news as a real one. False-positive means prediction of real news as a fake one. This objective is completely filled in the example represented in Table 5, where the False-negative is the lowest obtained value. The measures computed from the Confusion matrix are as follows:
-
Accuracy: Is the most common measure to evaluate the model’s performance. The Accuracy score is obtained by dividing the number of correct predictions made by the total number of predictions. Equation (4) represents the Accuracy function :
-
Precision: Is the number of fake news stories correctly predicted, divided by the total number of fake news predictions (5) represents the Precision function.
-
Recall: Is the number of fake news stories correctly predicted divided by the total number of predictions. Equation (6) represents the Recall function.
-
F1-Score: Is the harmonic mean of Precision and Recall. The F1 − score metric can be calculated as shown in (7).
$$ F1-score\quad = \quad 2 \quad * \quad \frac{Precision \quad*\quad Recall}{Precision\quad +\quad Recall} $$(7)
-
Area Under the receiver operating characteristic Curve (AUC): The researchers recommended using Area under the receiver operating characteristic Curve (AUC) to evaluate binary decision problems (Davis & Goadrich, 2006). AUC provides the probability that the model will rank a randomly chosen positive sample higher than a randomly chosen negative sample. Furthermore, The AUC fits the balanced dataset cases perfectly. Therefore, we will use the AUC score in this work to interpret the probabilistic forecast of our binary classification problem. The AUC rate can be calculated as shown in (8).
$$ AUC = \frac{1+TP_{rate} -FP_{rate}}{2} $$(8)
The general rules for categorizing the AUC model’s performance are used and discussed in Pham et al. (2021).
HyperParameters Tuning is searching for the ideal machine learning model architecture defined by a set of parameters referred to as hyperparameters (Elshawi et al., 2019).
There are several methods to tune the hyperparameters, such as Grid search, Random search, Bayesian optimization. In this work, we are using the Grid search method. It is based on the concept of building a model for each possible combination of all of the values of the hyperparameters provided, evaluating each model and deciding on the architecture that yields the best results Table 1 summarizes the various hyperparameters that have been tuned for the various used machine learning algorithms.
6.2 Experimentations results
To evaluate the performance of our model, we have considered the Accuracy, Recall, Precision and, FNR (False Negative Rate) via Confusion matrix as evaluation metrics. We must notice that the bold entries in Tables 3–8 indicate the best results found.
6.2.1 Models comparison using features extraction vectors
Figure 2 summarizes the Accuracy comparison of Bag-Of-Word’s different frequency levels where the (1-gram and 2-grams) frequencies outperformed the (3-gram) frequency.

Accuracy Comparison of different models basing on the Bag-of-word frequencies
Moreover, the figure depicts that the first two frequencies obtained very comparable results without counting the KNN case where the difference between all frequencies was noticeable, and the ‘1-gram’ outperformed all other frequencies.
Figure 3 summarizes the Accuracy comparison of TF-IDF’s different frequency levels where the (1-gram and 2-grams) frequencies outperformed the (3-gram) frequency.

Accuracy Comparison of different models basing on the TF-IDF frequencies
The (2-grams) frequency exceeded in its turn the (1-gram) according to most models such as SVM, Mult-NB, KNN, XGB and Voting classifiers; however, the (1-gram) performed best according to LR and RF models.
The different combinations of feature extraction techniques are represented clearly in both Figs. 2 and 3. Table 2 shows the confusion matrix of the ensemble voting (TF-IDF (2-gram)), tested on the inputted dataset. From this matrix, we can see that among the total number of tweets, the prediction gives us 959 real tweets that were classified as accurate. 937 fake tweets were classified as fake, 83 fake tweets were classified as accurate, and 161 real tweets were classified as fake. The Confusion Matrix shows us, by rates, that our classification model reaches the goal of decreasing the false negative rate. In fact, 83, which is the number of fake tweets classified as real represents only 3.87 percent of the total number of tweets, which is 2140.
6.2.2 Analyzing the effect of ensemble learning models
In this section, we are going to show the effect of aggregating the different models in the model depicted by “Voting”. In fact, it is a one-level ensemble voting model that we implemented in order to show the effect of the ensemble learning models, separately from the effect of the levels that we performed in the final model. It is a comparison between individual and ensemble learning models. Table 3 shows that, in terms of accuracy, SVM (2-gram) 94.01% and (1-gram) 93.78% performs best using TF-IDF, and Logistic Regression (2-gram) 93.36% and (1-gram) 93.69% performs best using Bag-Of-Words.
A classifier is considered usable only if it achieves both high Precision Table 4 and Recall Table 5.To average out the results of both Precision and Recall, F1-score is taken into consideration. On evaluating the F1-score metric as presented in Table 6, SVM (2-gram) 94.01% and (1-gram) 93.78% performs best using TF-IDF and Logistic Regression (2-gram) 93.36% and (1-gram) 93.68% performs best using Bag-Of-Words. The proposed Soft Voting Model outperforms the SVM model by 0.33% using the TF-IDF (1-gram, 2-gram) as feature extraction vectors; outperforms the Logistic Regression by 1.59% and 2,62% using the TF-IDF (1-gram, 2-gram) as feature extraction vectors. The Voting Model outperforms the SVM with the Bag-Of-Wordsby 1,36% (Table 7).
6.2.3 Analyzing the effect of the multi-level architecture
In this section, we are going to evaluate the performance of the multi-level architecture. In fact, we want to shed the light on the importance of the multi-level architecture.
However, the proposed Soft Three-Level Voting model (Soft T-LVM), outperforms the one level classifier (V5) by 0.14% in terms of Accuracy metric. Similarly, the proposed model also gives significant improvement for Precision, Recall, and F1-score performance measures, as shown in Table 8. The voting classifier (V5) based on the TF-IDF in 2-gram frequency extraction feature, outperforms in its turn all the rest of voting classifiers based on other feature extraction vectors according to the different performance metrics such as Accuracy 94.29%, Precision 94.29%, Recall 94.34% and F1-score 94.34%. The main idea in these experimentations is to put the stress on the ability of the multi-level architecture to solve the trade-off issue between Accuracy and efficiency of our classification results.
6.2.4 Analyzing the effect of the combination of the ensemble models and the multi-level architecture
From the Accuracy perspective, as shown in Fig. 4, SVM 92.27% and Logistic Regression 91.39% outperform all the other models based on Bag-Of-Words and TF-IDF feature extraction techniques in the different frequencies (1-gram, 2-gram, and 3-gram), except our model. Whereas as presented in Table 6, SVM (2-gram) 94.01% and (1-gram) 93.78% performs best using TF-IDF and Logistic Regression (2-gram) 93.36% and (1-gram) 93.69% performs best using Bag-Of-Words. The one level voting denoted by Soft 1-LVM gave good rates in terms of F1-score as shown in Fig. 4 for both feature extraction techniques countV or TFIDF (Figs. 5 and 6). In fact, these results were promising and encourage us to increase the number of classification-voting levels.

Average Accuracy of each model

F1-score according to CountV

F1-score according to TF-IDF
6.2.5 Evaluation of the predictive performance of our model
To evaluate the predictive performance of our approach, an AUC rate is calculated and represented in Fig. 7. Based on the rules relative to the AUC measure, most used models such as SVM, Logistic Regression (LR), Random Forest (RF), and Multinomial Naive Bayes (Mult-NB) obtained an excellent AUC rate when using the different feature extraction techniques where AUC > 0.9. The proposed Soft Three-Level Voting Model (Soft T-LVM) achieved the best AUC rate with AUC = 0.990, which outperforms all the other used models. In the plots, we use ST-LVM to mean our model Soft Three-Level Voting Model.

Average AUC of each model
Figure 7 graphically summarizes the average AUC score of each model, where the KNN model obtained the lowest value AUC< 0.88, the SVM and Mult-NB achieved very comparable values where 0.96 < AUC < 0.98 and the proposed Soft Three-Level Voting Model (Soft T-LVM) outperformed all the other models where AUC > 0.98.
6.2.6 Comparison with the existing works
The results given by our approach are compared with others published in article (Patwa et al., 2021), as shown in Table 8. Researchers have used four machine learning models as Decision Trees (DT), Logistic Regression (LR), SVM, and Gradient Boosting (GDBT) using the TF-IDF as a feature extraction technique. SVM 93.46% outperformed all the other models in terms of Accuracy. We realized several steps to improve these results in this work, starting by tuning the models’ hyperparameters, which improved the SVM model’s Accuracy by 0.32%. We used different feature extraction techniques and frequencies, and the result becomes even better using TF-IDF (2-gram). We obtained an Accuracy of 94.01% Table 7. Moreover, the proposed Soft Three-Level Voting Model (Soft T-LVM) has improved the results even more by attending an Accuracy of 94.43% to outperform the original paper’s SVM model by 0.97%.
7 Conclusion and future scope
The detection of fake news using ensemble models has become one of the most prominent machine learning topics since it overcomes the downsides of traditional models’ performance, and enhances their capabilities. In this work, we proposed a Soft Three-Level Voting Model (Soft T-LVM) to classify news in the dataset (Patwa et al., 2021). This model was realized during different steps, such as choosing six individual algorithms and applying them to the dataset, then merging five of these classifiers based on the features extraction vectors to retrieve six different ensemble voting models in the first level. In the next step, we retrieved other ensemble voting classifiers by merging the previous ensemble voting classifiers basing on the frequencies of each feature extraction technique. Finally, we retrieved the proposed Soft Three-Level Voting Model (Soft T-LVM) by merging the last calculated models in the last step. The obtained results were auspicious compared to those published in the literature. We aim to try feature extraction methods other than Bag-of-Words and TF-IDF ones. Plus, we aim to work with different datasets using some deep learning models. A potential distribution of the model by a multi-agent system is very adequate.
Data Availability
Data transparency.
References
Agarwal, V., Sultana, H., Malhotra, S., & et al. (2019). Analysis of classifiers for fake news detection. Procedia Computer Science, 165(1), 377–383. https://doi.org/10.1016/j.procs.2020.01.035.
Ahmad, I., Yousaf, M., Yousaf, S., & et al. (2020). Fake news detection using machine learning ensemble methods. Complexity, vol. 2020. https://doi.org/10.1155/2020/8885861.
Ahmed, H., Traore, I., & Saad, S. (2017). Detection of online fake news using n-gram analysis and machine learning techniques. In International conference on intelligent, secure, and dependable systems in distributed and cloud environments, (pp. 127–138). Springer. https://doi.org/10.1007/978-3-319-69155-8_9.
Akhter, M. P., Zheng, J., Afzal, & et al. (2021). Supervised ensemble learning methods towards automatically filtering Urdu fake news within social media. PeerJ Computer Science 7, 7, e425. https://doi.org/10.7717/peerj-cs.425.
Azzouz, A., Ennigrou, M., & Jlifi, B. (2015). Diversifying TS using GA in multi-agent system for solving flexible job shop problem. In 2015 12th international conference on informatics in control, atomation and robotics (ICINCO), (vol. 1, pp. 94–101).
Bovet, A., & Makse, H. A. (2019). Influence of fake news in Twitter during the 2016 US presidential election. Nature Communications, 10.1, 1–14. https://doi.org/10.1038/s41467-018-07761-2.
Brennen, J. S., Simon, F. M., Howard, & et al. (2020). Types, sources, and claims of COVID-19 misinformation. Doctoral dissertation. University of Oxford.
Conroy, N. K., Rubin, V. L., & Chen, Y. (2015). Automatic deception detection: Methods for finding fake news. Proceedings of the Association for Information Science and Technology, 52(1), 1–4. https://doi.org/10.1002/pra2.2015.145052010082.
Cui, W., Liu, S., Tan, L., & et al. (2011). Textflow: Towards better understanding of evolving topics in text. IEEE Transactions on Visualization and Computer Graphics, 17, 2412–2421. https://doi.org/10.1109/TVCG.2011.239.
Davis, J., & Goadrich, M. (2006). The relationship between Precision-Recall and ROC curves. In Proceedings of the 23rd international conference on machine learning, (pp. 233–240). https://doi.org/10.1145/1143844.1143874.
Deepak, S., & Chitturi, B. (2020). Deep neural approach to fake-news identification. Procedia Computer Science, 167, 2236–2243. https://doi.org/10.1016/j.procs.2020.03.276,.
Dickerson, J. P., Kagan, V., & et al. (2014). Using sentiment to detect bots on twitter: Are humans more opinionated than bots?.
Elshawi, R., Maher, M., & Sakr, S. (2019). Automated machine learning State-of-the-art and open challenges. arXiv:1906.02287.
Englmeier, K. (2021). The role of text mining in mitigating the threats from fakenews and misinformation in times of corona. Procedia Computer Science, 181, 149–156. https://doi.org/10.1016/j.procs.2021.01.115.
Galli, A., Masciari, E., Moscato, V., & et al. (2022). A comprehensive Benchmark for fake news detection. Journal of Intelligent Information Systems, 59 (1), 237–261. https://doi.org/10.1007/s10844-021-00646-9.
Gilda, S. (2017). Notice of violation of IEEE publication principles: Evaluating machine learning algorithms for fake news detection. In 2017 IEEE 15th student conference on research and development (SCOReD), (pp 110–115). https://doi.org/10.1109/SCORED.2017.8305411.
González, S., García, S., Del Ser, J., & et al. (2022). A practical tutorial on bagging and boosting based ensembles for machine learning: algorithms, software tools, performance study, practical perspectives, and opportunities. Information Fusion, 64, 205–237. https://doi.org/10.1016/j.inffus.2020.07.007.
Hua, J., & Shaw, R. (2020). Coronavirus (covid-19)“infodemic” and emerging issues through a data lens: The case of china. International Journal of Environmental Research and Public Health, 17, 2309. https://doi.org/10.3390/ijerph17072309.
Iftikhar, A., Muhammad, Y., & Suhail, Y. (2020). A research on fake news detection using machine learning Algorithm. Smart Systems: Innovations in Computing, 273–287. https://doi.org/10.1155/2020/8885861.
Jadhav, S. S., & Thepade, S. D. (2019). Fake news identification and classification using DSSM and improved recurrent neural network classifier. Applied Artificial Intelligence, 33, 1058–1068. https://doi.org/10.1080/08839514.2019.1661579.
Jivani, A. G. (2011). A comparative study of stemming algorithms. Int. J. Comp. Tech Appl, 2.6, 1930–1938.
Kaur, S., Kumar, P., & Kumaraguru, P. (2020). Automating fake news detection system using multi-level voting model. Soft Computing, 24, 9049–9069. https://doi.org/10.1007/s00500-019-04436-y.
Kotteti, C. M. M., Dong, X., & et al. (2018). Fake news detection enhancement with data imputation. In 2018 IEEE 16th Intl conf on dependable, autonomic and secure computing, 16th Intl conf on pervasive intelligence and computing, 4th Intl conf on big data intelligence and computing and cyber science and technology congress (DASC/PiCom/DataCom/CyberSciTech), (pp. 187–192). https://doi.org/10.1109/DASC/PiCom/DataCom/CyberSciTec.2018.00042.
Kwon, S., Cha, M., Jung, K., & et al. (2013). Prominent features of rumor propagation in online social media. In 2013 IEEE 13th international conference on data mining, (pp. 1103–1108). https://doi.org/10.1109/ICDM.2013.61.
Kwon, Y. M., & Jun Gal, W. M. (2018). The performance comparison of the classifiers according to binary bow, count bow and Tf-Idf feature vectors for malware detection. International Journal of Engineering & Technology, 7, 15–22. https://doi.org/10.14419/ijet.v7i3.33.18515.
Ni, B., Guo, Z., Li, J., & et al. (2020). Improving generalizability of fake news detection methods using propensity score matching. arXiv:2002.00838.
Patwa, P., Sharma, S., & Pykl, S. (2021). Fighting an infodemic: Covid-19 fake news dataset. In International workshop on combating online hostile posts in regional languages during emergency situation, (pp 21–29). Springer. https://doi.org/10.48550/arXiv.2011.03327.
Pham, K., Kim, D., Park, S., & et al. (2021). Ensemble learning-based classification models for slope stability analysis. Catena, 196, 104886. https://doi.org/10.1016/j.catena.2020.104886.
Sear, R. F., Velásquez, N., Leahy, R., & et al. (2020). Quantifying COVID-19 content in the online health opinion war using machine learning. Ieee Access, 8, 91886–91893. https://doi.org/10.1109/ACCESS.2020.2993967.
Singh, V., Dasgupta, R., Sonagra, D., & et al. (2017). Automated fake news detection using linguistic analysis and machine learning. In International conference on social computing, behavioral-cultural modeling, & prediction and behavior representation in modeling and simulation (SBP-BRiMS), (pp. 1–3). https://doi.org/10.13140/RG.2.2.16825.67687.
Vishwakarma, D. K. (2020). Fake news, rumor, information pollution in social media and web: A contemporary survey of state-of-the-arts, challenges and opportunities. Expert Systems with Applications, 153, 112986. https://doi.org/10.1016/j.eswa.2019.112986.
Zhang, X., & Ghorbani, A. A. (2020). An overview of online fake news Characterization, detection, and discussion. Information Processing & Management, 57, 102025. https://doi.org/10.1016/j.ipm.2019.03.004.
Zhang, D., Xu, J., Zadorozhny, V., & et al. (2022). Fake news detection based on statement conflict. Journal of Intelligent Information Systems, 59(1), 173–192. https://doi.org/10.1007/s10844-021-00678-1.
Author information
Authors and Affiliations
Contributions
Boutheina Jlifi, Chayma Sakrani and Claude Duvallet
Corresponding author
Additional information
Publisher’s note
Springer Nature remains neutral with regard to jurisdictional claims in published maps and institutional affiliations.
Rights and permissions
Springer Nature or its licensor (e.g. a society or other partner) holds exclusive rights to this article under a publishing agreement with the author(s) or other rightsholder(s); author self-archiving of the accepted manuscript version of this article is solely governed by the terms of such publishing agreement and applicable law.
About this article

Cite this article
Jlifi, B., Sakrani, C. & Duvallet, C. Towards a soft three-level voting model (Soft T-LVM) for fake news detection. J Intell Inf Syst 61, 249–269 (2023). https://doi.org/10.1007/s10844-022-00769-7
Received:
Revised:
Accepted:
Published:
Issue Date:
DOI: https://doi.org/10.1007/s10844-022-00769-7