
Abstract
We investigate theoretically and empirically the relationship between capital taxation and economic growth. Using a long cross-country panel data set going back to 1965 and employing a variety of econometric techniques, we document that greater reliance on capital taxation, measured in different ways, is not negatively associated with growth rates. Exploring potential heterogeneity in this relationship across countries, we find that capital taxation and growth rates tend to be positively related for developed countries, but for developing countries the relationship is in most cases statistically insignificant. To rationalize these empirical findings we propose a multi-country innovation-based growth model where innovations spill over from leading to lagging economies. In the context of this model we demonstrate that positive rates of capital taxation can increase the long-run growth rate in leading economies where the engine of growth is domestic innovation activity. However, this is not the case in lagging economies where growth is driven by imitation of existing innovations from the technology frontier.
1 Introduction
Since the global financial crisis of 2007–2008 questions related to public finance have returned to the forefront of economic policy debates. This is particularly the case in countries that have been severely affected by the crisis and that are trying to put their public finances back on a sustainable track in an environment of high public debt and slow economic growth. In the context of such debates, both the level and the structure of taxation have been the subject of scrutiny and some taxation principles of the pre-crisis years have been called into question.
One such principle, that has sparked extensive discussions in the literature, has to do with the taxation of capital. Before the crisis, tax rates on capital in most developed countries were on a declining path, as tax competition between countries contributed to a shift of the tax burden away from capital (Devereux et al. 2008). Since the crisis, however, there have been multiple calls to increase taxes on capital (Piketty 2014; Stiglitz 2012) and several international organizations appear less concerned about this form of taxation than before (European Commission 2015; International Monetary Fund 2015).
The case of capital taxation is particularly interesting since economic theory provides a strong prescription, namely that in the long-run capital should be taxed at a zero rate. The rationale for not imposing any taxes on capital follows from the basic principles of uniform taxation of final goods (Atkinson and Stiglitz 1976) and non-taxation of intermediate goods (Diamond and Mirrlees 1971). In its clearest form, this proposition has been documented by Chamley (1986) and Judd (1985), and thus is often referred to as the Chamley–Judd result. As shown in these two papers, any positive tax rate on capital will distort the intertemporal allocation of resources between consumption and savings, discourage savings and lead to less capital accumulation. This distortion is so large that, as Mankiw (2000) stresses, any capital income taxation is suboptimal compared to labor income taxation, even from the perspective of an individual with no savings. While, following the work of Chamley and Judd, several authors have investigated the generality of the result and raised important qualifications to itFootnote 1 the conventional wisdom among economists, summarized in Mankiw et al. (2009), remains that optimal tax rates on capital should be close to zero.
In light of these conclusions stemming from economic theory, a natural question that emerges is whether countries that have deviated from this policy prescription have indeed experienced lower rates of economic growth. We investigate this question using the detailed information on taxation provided by the OECD Revenue Statistics, one of the few databases that report not only the overall level of taxation in different countries, but also the composition in terms of different forms of taxation. Moreover, the database includes annual observations and spans a relatively long period, from 1965 to 2014. This is particularly important, as it allows us to exploit changes in tax policies over time. The data also extend beyond current OECD members to cover several developing countries from Asia, Africa and Latin America.
Combining these data with standard national accounts data from the Penn World Table, we assess whether and to what extent greater reliance on capital taxation is harmful for economic growth. We perform this assessment using a variety of econometric techniques. These include the standard fixed-effect panel regressions, as well as the panel error-correction techniques developed by Pesaran et al. (1999). The latter allow us to exploit the annual frequency of our data and separate the short-run from the long-run impact of capital taxation. To eliminate potential endogeneity concerns, due to feedback from economic growth on the tax structure as well as due to possible omitted variables, we also document estimation results using the difference and the system generalized methods of moment (GMM) estimators proposed by Arellano and Bond (1991) and Blundell and Bond (1998), respectively.
The results that we obtain do not support the standard theory prescriptions. We find that shifts in the tax burden toward capital, conditional on the overall level of taxation, do not systematically reduce rates of economic growth. In many specifications, the association between capital taxation and growth rates is in fact positive and in the remaining ones it is not statistically different from zero. We then explore whether the estimated effect is potentially heterogeneous across countries. Separating the countries based on their level of development, we provide evidence that the association between capital taxation and growth tends to be more positive in high-income countries in our sample and less positive or even negative in low-income countries. We further document that these empirical findings are robust to the specific measure of capital taxation that we employ, to the exact way we distinguish between high- and low-income countries and to the inclusion of other variables that influence the relationship between capital taxation and economic growth as controls.
To rationalize our empirical findings, we propose a variant of the multi-country innovation-based growth model of Aghion and Howitt (1992). The model allows for capital accumulation so that we can analyze the link between capital taxation and innovation, which is the main engine of growth in the model. It also incorporates technology transfer, as in Aghion et al. (2005) and Acemoglu et al. (2006), with innovations produced in leading economies spilling over to lagging economies. In the model, there are two channels through which capital taxation can influence economic growth. The first is by shifting the tax burden away from labor taxation, which reduces the market size for new innovations and has an adverse effect on domestic rates of innovation. The second one is by financing productive government spending, which raises the productivity of innovating firms.
Using this model, we study the effects of capital taxation on the long-run equilibrium level and the growth rate of output for different economies which vary in their proximity to the technology frontier. As our analysis demonstrates, starting from a benchmark equilibrium with zero capital taxation, a shift to positive capital taxation can increase the long-run growth rate, either when this comes with a corresponding reduction in labor taxation or when the additional tax revenue is used to finance productive government spending. These effects, however, apply only in the case of leading economies which actively engage in innovation. This is because in leading economies lower labor taxation and more productive government spending increase the rate of long-run growth by stimulating innovation. In the case of lagging economies, there is no innovation taking place domestically and economic growth is driven by the imitation of existing innovations developed in leading economies. Thus, any change in capital taxation does not alter the ability of the country to tap on the existing global stock of innovations or the long-run rate of economic growth, which is effectively exogenous.
The remainder of this paper is organized as follows. Section 2 provides a brief summary of the theoretical and empirical literature investigating the relationship between capital taxation and economic growth. Section 3 discusses our data set as well as our empirical strategy. Section 4 reports our regression results. Section 5 presents our theoretical model, while Sect. 6 describes the equilibrium of the model. Lastly, Sect. 7 offers some concluding remarks and discusses some policy implications.
2 Literature review
Most of the literature on capital taxation and economic growth originates from the seminal theoretical contributions of Judd (1985) and Chamley (1986). Within the framework of the standard optimal growth model of Ramsey (1928), Cass (1965) and Koopmans (1965), both authors demonstrate that the taxation of capital has strong negative effects on capital accumulation and ultimately leads to a lower level of capital and output. This implies that in equilibrium capital should be taxed at a zero rate, a conclusion that, although striking, is general and robust to different specifications. As shown by Atkeson et al. (1999), the Chamley–Judd result will naturally emerge in any model where taxes are restricted to be linear and the government is assumed to be benevolent and unable to commit to future taxes.Footnote 2
These results also extend to several endogenous growth models, as exemplified by Jones et al. (1993), Milesi-Ferretti and Roubini (1998) and Aghion et al. (2013). Within this class of models, though, there are setups in which the optimal tax rate on capital may differ from zero. As Jones et al. (1993) demonstrate, capital taxation may be growth enhancing if the resulting revenue is used to fund productive government spending. Similarly, Aghion et al. (2013) show that in an innovation-based growth model, taxing capital can increase growth rates by allowing the government to limit the adverse effect of high labor taxation. Innovation-based growth models also imply that different forms of capital taxation can have different effects on growth. Peretto (2003), for example, highlights that corporate income taxation can be growth enhancing while asset income taxation is growth retarding. Similarly, Peretto (2007), Abel (2007) and Anagnostopoulos et al. (2012) show that the taxation of dividends and retained earnings do not have the same effects on growth and that shifting the corporate tax burden from the latter to the former can boost growth rates.
Optimal rates of capital taxation are also shown to be positive in various models with heterogeneous agents. Aiyagari (1995), for example, demonstrates that this is the case in the presence of incomplete insurance markets and borrowing constraints. Saez (2013) and Golosov et al. (2013) provide a similar result in an environment of income inequality due to unobserved heterogeneity across agents. In an overlapping generations model, Conesa et al. (2009) and Jacobs and Bovenberg (2009) show that positive capital taxation is warranted as it allows the government to reduce distortionary labor taxation which harms younger generations and hampers human capital accumulation. Finally, Cozzi (2004), Gordon and Li (2009) and Acemoglu et al. (2011) provide examples of how capital taxation can be growth enhancing by easing various political constraints of the government.Footnote 3
In parallel with the development of this extensive theoretical literature, a related literature has emerged investigating empirically the relationship between capital taxation and economic growth. An important challenge in these empirical studies is measuring capital taxation, as pinning down this form of taxation is not as straightforward in practice as it is in theory. Most of the existing studies have focused on the impact of corporate taxation, which constitutes one clear form of capital taxation. Following this approach, Lee and Gordon (2005) find that statutory corporate tax rates are negatively correlated with growth rates across countries, whereas Arnold et al. (2011) find the same result for the ratio of corporate to total taxation. Similarly, Djankov et al. (2010) show that high effective corporate tax rates have also a negative impact on investment, foreign direct investment, and entrepreneurial activity. These findings appear in line with the theoretical conclusions of Chamley and Judd.
Employing broader measures of capital taxation, however, leads to less clear-cut results. For example, in a cross-country panel, Mendoza et al. (1997) estimate the impact on growth of effective tax rates on capital income stemming from dividends, royalties, interest, rents and property and find that it is not statistically different from zero. Easterly and Rebelo (1993) obtain similar results in the context of simple cross-sectional regressions. More recent studies by Widmalm (2001), Angelopoulos et al. (2007) and Arachi et al. (2015) investigating the impact of different capital tax instruments on growth rates also find the relationship to be weak and non-robust.
A potential explanation for the absence of a consistent pattern in the data is that the alleged effect of capital taxation may not be uniform across countries. This is suggested by the fact that studies focused on OECD countries, such as those of Mendoza et al. (1997), Widmalm (2001) and Arachi et al. (2015), do not find a clear negative effect of capital taxation on growth rates. On the other hand, studies with a wider country coverage, such as those of Lee and Gordon (2005) and Djankov et al. (2010), come closer to finding the adverse effect of capital taxation suggested by theory. To this point, however, the literature has not systematically investigated the potential heterogeneity across countries in the effect of capital taxation. Work by Kneller et al. (1999) and Gemmell et al. (2011) has demonstrated that capital taxation instruments that are more distortionary tend to have a clear adverse effect on economic growth. Yet, their analysis is only based on OECD countries and does not consider whether and why such effects may vary with a country’s level of economic development.
3 Data and empirical strategy
3.1 Regression specification
To empirically assess the impact of capital taxation on economic growth, we follow an approach that is now standard in the literature by estimating a growth regression in the form of a dynamic panel that includes both country and year fixed effects (Eberhardt and Teal 2011). In this specification, the dependent variable is the natural logarithm of output per capita, \(\ln y_{i,t},\) in country i in year t, which is regressed on its lagged value, \(\ln y_{i,t-1},\) and a set of other regressors. This set includes standard growth determinants such as the rate of growth of the population, \(n_{i,t}\), the investment share, \(inv_{i,t},\) the growth rate of human capital, \(g_{i,t}^\mathrm{hc},\) and the overall share of taxation in output, \(tt_{i,t}\). To these we add a variable that measures capital taxation, \(t_{i,t}^\mathrm{cap}\), be it in the form of the ratio of capital taxation to total taxation or in the form of an average or marginal rate. In some specifications, we also employ additional regressors which we denote with the vector \(X_{i,t}.\) Thus, our main regression equation is as follows:
In our main analysis, we estimate Eq. (1) using a panel data set where each period corresponds to 5 years. In this setup, \(\ln y_{i,t-1}\) reflects the natural logarithm of output per capita at the start of each 5-year period and \(\ln y_{i,t}\) is the value at the end of the period. For all other regressors, the values correspond to an average over each respective 5-year period. Taking average values is important as it avoids contamination of the estimates by short-run fluctuations in the values of any of the regressors over the business cycle. Given the dynamic-panel structure of the specification, the estimated coefficients \(\beta _{2}\) to \(\beta _{6} \) should be interpreted as reflecting the growth effects of the respective variables over a 5-year period.
Our main coefficient of interest is \(\beta _{6}.\) This coefficient reflects the impact of a change in capital taxation, given the overall level of taxation in the economy, on the change in output per capita relative to its initial value, that is, the growth rate of output per capita. This corresponds to the impact on output growth of an increase in capital taxation combined with an adjustment in other forms of taxes that keeps the total level of taxation unchanged. Hence, the specification allows us to disentangle the effect of capital taxation from that of overall taxation. If taxation is generally harmful for growth, an increase in capital taxation not matched by a corresponding reduction in some other tax would always be expected to be harmful for growth as well. By keeping the total level of taxation fixed, the specific impact of an increase in the extent of capital taxation can be assessed. A higher share of capital taxation in total taxation or a higher average or marginal rate of capital taxation would thus imply that a country has shifted the burden of taxation more toward capital relative to other forms of taxation.
3.2 Data
To estimate the above specification, we use tax data provided by the OECD. Specifically, from the OECD Revenue Statistics database we obtain information on total tax revenue as well as the amounts of tax revenue coming from different forms of taxation. The data cover the years since 1965, although for several countries data are only available for a subset of this time period. In total, we have tax data for 77 countries, which include all current OECD members, as well as several Asian, African and Latin American countries. We combine these tax data with national account information for these 77 countries provided by the Penn World Table, version 9.0 to construct an unbalanced annual panel data set covering the years from 1965 to 2014. A list of the countries included in our data set is provided in “Section A” of Appendix.
For our main analysis, we focus on three main measures for capital taxation which have been used in the literature before and which can be constructed for most of the 77 countries in our sample. We start by looking at the ratio of corporate income taxation to total taxation. We do so as corporate income taxation is a narrow but clear form of capital taxation. We also construct a broader capital tax ratio that includes other forms of capital taxation levied on property or investment goods. We further construct a corresponding effective average rate of capital taxation following the approach of Mendoza et al. (1994) as modified by Volkerink and de Haan (2001). Further details and explicit formulas regarding the construction of these variables are provided in “Section B” of Appendix.
In addition to these three measures, we also consider various alternative measures of capital taxation. Specifically, in parts of our regression analysis we also employ top or effective marginal rates of corporate income taxation as well as shares of corporate taxation in aggregate GDP. However, as data on these measures are only available for a considerably smaller subset of countries and years, we use them primarily for robustness purposes.
Beyond measures of capital taxation, we also employ in our analysis similar measures of labor and consumption taxation. For these forms of taxation, we focus again on three main measures, namely a narrow tax ratio, a broad tax ratio and an effective average rate. These measures are also obtained from the information provided in the OECD Revenue Statistics database following a similar approach as with the capital taxation measures. The details here are also provided in “Section B” of Appendix.
Table 6 in “Section B” of Appendix reports key summary statistics for all these variables. As we see in the table, looking at the correlations of our main capital taxation measures with per capita GDP already suggests some important patterns in the data. While there is a strong positive correlation between a country’s overall share of taxes in GDP and its level of economic development, this is not the case for all measures of taxation. Different measures of capital taxation are correlated differently with GDP per capita, some positively and some not at all. This is in contrast to labor taxation measures which tend to be positively related with GDP per capita and consumption taxation measures which tend to be negatively related. Thus, what is evident from the data at first glance is that as countries get richer they tend to tax their residents more. They also do so more with direct forms of labor income taxation and less so with indirect forms of consumption taxation, but not necessarily via capital income taxation.
4 Estimation results
4.1 Baseline results
Having discussed the nature of the data and our empirical strategy, we now turn to the presentation of our estimation results. Table 1 displays the results from the estimation of our main regression specification (1) by means of ordinary least squares. The first column of this table shows the estimation results for a specification that does not include any capital taxation measure. The results suggest that our dynamic-panel specification fits the data very well with a within R-squared that exceeds 0.9.
The estimated coefficients have the expected signs and are statistically significant at conventional levels, with the exception of population growth. The coefficient on the lagged value of output per capita is positive and less than one, signifying the presence of conditional convergence (Islam 1995). The coefficient on the investment share is positive suggesting a strong effect of investment spending on growth. This also holds for the growth rate of human capital. Finally, the coefficient of the total taxation share is negative underscoring primarily the adverse effect that tax distortions have on growth rates (Kneller et al. 1999).Footnote 4
Adding in column (2) the GDP share of corporate taxation instead of the GDP share of total taxation we now observe an interesting pattern. While its inclusion hardly affects the estimated coefficients of the other variables, the coefficient estimate of the corporate tax share is positive and statistically significant at the 1% level. This implies that conditional on the values of the standard growth determinants, a shift in the tax structure toward greater capital taxation is not harmful but beneficial for economic growth.
In column (3) we include in the specification our first main measure of capital taxation, the ratio of corporate taxation in total taxation, controlling this time for the share of total taxation in GDP. This way we can better disentangle the effect of capital taxation on growth from that of total taxation. As discussed in the previous section, in this case the coefficient estimate on the corporate tax ratio reflects the effect of an increase in corporate taxation that does not increase the total tax share. This would correspond to an increase in corporate taxation that would be revenue neutral and which would be achieved by a simultaneous reduction in other forms of taxation. Such an increase would reflect a policy shift by the government toward a greater reliance on corporate taxation as a source of revenue. Here we again observe a positive and highly significant coefficient estimate.
In columns (4) and (5) of Table 1, we estimate the same specification using instead our other two main measures of capital taxation, the broad tax ratio and the effective tax rate. In both cases, we see a qualitatively similar pattern. The coefficient estimates for these two capital measures are positive as well, although in column (4) the estimate that we obtain is below conventional levels of statistical significance. Yet, in neither case we see increases in capital taxation in the form of a higher tax ratio or a higher effective rate to be strongly negatively associated with economic growth.
In the final two columns of the table, we estimate our main regression specification employing as a measure of capital taxation first the top marginal rate and then the effective marginal rate of corporate income taxation in each country. In both cases, the estimation is based on a smaller sample of countries due to data availability. Nevertheless, using also these variables, we do not see a negative association with growth rates. In column (6) the coefficient estimate that we obtain is positive but statistically insignificant. In column (7) the obtained coefficient is positive and statistically significant. Thus, in this case, the estimates confirm the pattern that we see with our three main measures of capital taxation. Greater reliance on capital taxation does not appear to be systematically linked with lower economic growth.
4.2 Heterogeneity across countries
The regression estimates presented thus far do not lend support to the conventional wisdom that capital taxation is harmful for economic growth. In all of the specifications of Table 1, we find the association between capital taxation and economic growth to be strongly or weakly positive. In this section, we further explore whether this effect is similar across more and less developed countries or whether there is some heterogeneity across countries in this respect.
For this purpose, we construct a ”Low-Income” dummy variable to separate the relatively less developed countries in our sample from the relatively more developed ones. This dummy is then interacted with our different capital taxation measures to allow for their effect to differ for less developed countries. To estimate the correct income threshold below which the effect of capital taxation on growth should be different, we first employ a threshold regression on the countries for which we have data for the entire period from 1965 to 2014. Then we apply the estimated threshold value of income to the whole of our sample. Beyond that, we also consider a continuous interaction effect where the nature of the association between capital taxation and growth is allowed to vary with a country’s relative income level. For this analysis, we focus on the three main measures of capital taxation for which we have good data coverage and for which we can estimate our main regression specification based on roughly the same sample of countries.Footnote 5 The estimation results from these regressions are presented in Table 2.
Columns (1), (2) and (3) of Table 2 present the estimation results when the ratio of corporate taxes to total taxation is used as our main measure of capital taxation. The first column shows the estimates for the threshold regression, which necessitates the use of a fully balanced panel throughout our sample period from 1965 to 2014. This leaves us with a sample of 23 countries. Based on a goodness of fit criterion, the threshold regression suggests a differential effect of capital taxation on growth for countries whose per capita income levels are below a value of approximately 13,500 in terms of constant 2005 dollars. This estimated differential effect is also highly statistically significant. For the sub-sample of high-income countries the effect, captured by the baseline capital taxation coefficient, is strongly positive as in Table 1. For the sub-sample of low-income countries, on the other hand, the corresponding effect, obtained by summing up the baseline and interaction term coefficients, is effectively negative.
In the second column of Table 2, we estimate the same interaction effect using our full sample of countries including those for which the data for some years are missing. For this estimation, we employ the same income cutoff point identified by the threshold regression in order to define our low-income dummy. As the estimation results reveal, we find again the corporate taxation ratio to be positively associated with growth rates for high-income countries. Yet, this is clearly not the case for low-income countries. The estimated interaction effect with the low-income dummy is negative and statistically significant. Moreover, in this case, the net effect for the low-income countries is estimated to be not different from zero.
In the third column of Table 2, we go beyond a dichotomous split between high- and low-income countries. As an alternative, we allow the effect of capital taxation to change continuously as a country moves down along the world income distribution. We do this by interacting the corporate tax ratio with an indicator of a country’s relative position in the world income distribution. This indicator is defined as the income level of the world’s richest country in any given year divided by a country’s own income level in that same year. This variable ranges from 1 for the world income leader in each year to around 45 for the poorest country in our sample. As the estimates reveal, we again observe a significantly positive base effect of the corporate tax ratio on economic growth for high-income countries. As the negative interaction effect shows, however, the effect turns negative as we move down the income distribution.
To properly assess this effect, it is useful to look at the corresponding marginal effect plot, which we show in panel (a) of Fig. 1. The graph shows the marginal effect of the corporate tax ratio on real GDP growth for different values of relative income. Moreover, the dotted lines indicate a 95% confidence interval and the histogram shows the distribution of the relative income variable.Footnote 6 From this graph it is clear that for high-income countries, with relative income levels close to 1, the effect of corporate taxation is estimated to be positive and statistically significant. Moving down the income distribution the effect becomes smaller and eventually turns negative for low-income countries.
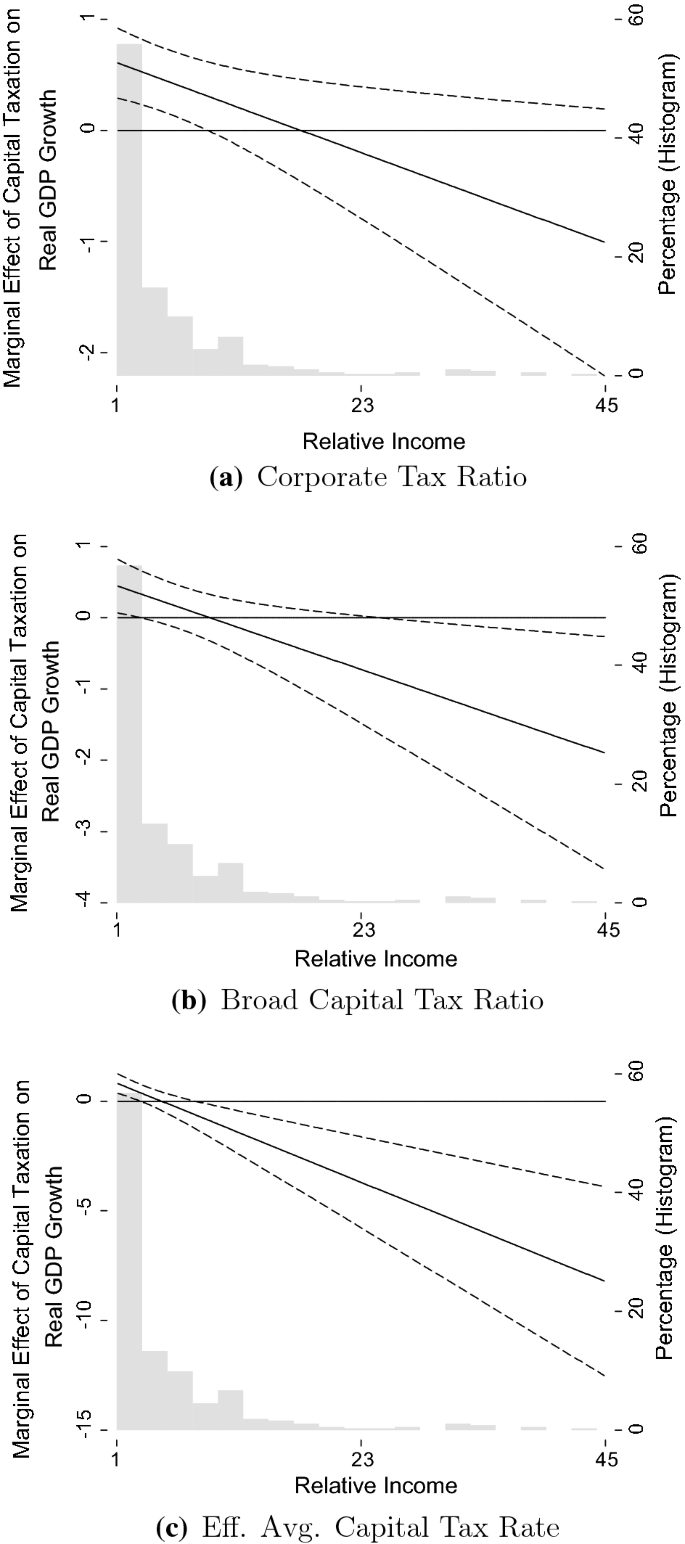
Marginal effect plots for relative income. Note The graphs show the marginal effect of different measures of capital taxation on real GDP growth for different values of relative income. The dotted lines indicate a 95% confidence interval and the histogram represents the distribution of relative income
Similar effects are observed for the other capital taxation measures. In columns (4), (5), and (6) we look at the broad capital taxation ratio. Column (4) again starts with the threshold regression for a balanced panel of countries. In this case again, as indicated by the coefficient on the interaction term, there is a difference between the effect of the capital tax ratio for high- and low-income countries which is significant at the 5% level. This is despite the fact that the effect for the high-income countries is positive but statistically insignificant. Thus, the net effect for low-income countries is negative but close to zero. Moreover, we should note that the threshold identified here is virtually identical to that in column (1).
When the same absolute threshold is again applied to a wider sample in column (5), we observe the same pattern as in column (2). There is a highly statistically significant difference in the effect between the two groups of countries, with a positive effect of capital taxation on growth for the high-income countries and an almost zero effect for the low-income ones. The obtained pattern is similar also when we use a relative income interaction in column (6). This can again be illustrated with the marginal effect plot in panel (b) of Fig. 1. This plot is nearly identical to the one from panel (a) and, hence, suggests the same conclusions.
Lastly in columns (7), (8), and (9) we repeat the same set of regressions employing this time as the measure of capital taxation our constructed effective average capital tax rates. Looking first at the threshold regression for the balanced panel in column (7) we see a clear difference in the effect for high- and low-income countries. For the high-income countries, the relationship between effective average capital tax rates and growth rates is positive and statistically significant, while for low-income countries the estimated relationship is effectively zero. Applying to the full sample the estimated absolute income threshold, which also in this case corresponds to approximately 13,500 in terms of constant 2005 dollars, we obtain the results of column (8). The pattern that we obtain is the same, but more precisely estimated: a highly significant positive effect in high-income countries and similarly a significant difference with low-income countries. The same pattern is observed when employing the relative income variable instead in column (9). Examining the marginal effect plot in panel (c) of Fig. 1 is also reassuring. In countries where income levels are higher the effect of capital taxation on growth appears to be positive, whereas in countries with lower income levels the effect is negative.
Overall the results reported in this section suggest the presence of clear differences across countries in how capital taxation affects economic growth. Exploring the nature of this heterogeneity, we provide evidence that it is related to a country’s level of development. In high-income countries that operate close to the technology frontier and whose relative income levels are high, we find that greater reliance on capital taxation relative to other forms of taxation tends not to be particularly harmful for growth. In low-income countries, however, that operate further away from the technology frontier and whose relative income levels are low, we find the effect of capital taxation to be closer to being negative, as conventional wisdom suggests.
This pattern can also be shown to be robust to the inclusion of several additional control variables which relate to other tax policy variables and to other factors influencing the relationship between capital taxation and economic growth. This is shown in greater detail in Table 7 in “Section C” of Appendix. Furthermore, the nature of the relationship between capital taxation and economic growth can also be explored with respect to other threshold variables. This analysis is presented in Table 8 in “Section C” of Appendix. All together, these additional results corroborate the story presented so far regarding the differential nature of the effect of capital taxation on growth between developed and developing countries.
4.3 Correcting for endogeneity: GMM results
The regression results presented up to this point, although robust, may still be subject to various types of biases. Particularly relevant in our empirical context is the dynamic-panel bias due to the presence of a lagged dependent variable among the regressors and the endogeneity bias caused by correlation of some of the regressors with the error term. In the former case, the positive correlation between the lagged value of income and the error term of the regression is likely to attenuate the coefficient estimates on the dependent variables and to make an otherwise negative coefficient on capital taxation appear insignificant. In the latter case, the resulting endogeneity bias may shift the estimated coefficients either upward or downward.
In order to avoid both types of bias, a common approach in the literature is to use the GMM estimation techniques proposed by Arellano and Bond (1991) and Blundell and Bond (1998). Both techniques rely on employing lagged values of the potentially endogenous dependent variables as instruments. One crucial difference between the two approaches relates to the exact choice of instruments. Arellano and Bond, abbreviated as AB, suggest the use of lags of the endogenous regressors in levels to estimate the specification of interest in first differences. On the other hand, Blundell and Bond, abbreviated as BB, suggest the joint estimation of the specification of interest in levels and in first differences using lags of the endogenous regressors in terms of both levels and first differences.
In Table 3, we repeat for each of our three main capital taxation measures the specification from Table 2 that includes the interaction with the low-income dummy for the full sample of countries using both the AB and BB techniques. We focus on the estimation of this specification which is relatively simpler. Columns (1) and (2) present the estimation results first with the BB and then with the AB estimators when using the corporate tax ratio. Columns (3) and (4) use the broad capital tax ratio instead. Finally, the last two columns do the same using the effective average capital tax rate. In our implementation of both GMM estimation techniques, we have followed the most conservative assumption of treating all included variables as potentially endogenous and instrumenting them. We also restrict the number of instruments, as suggested by Roodman (2009), to avoid potential instrument overfitting.
What is immediately clear from the table is that a meaningful correction for the dynamic panel and endogeneity bias does not alter the qualitative nature of our main results. Comparing the estimates in this table to those in columns (2), (5), and (8) of Table 2, it is clear that they are very similar. In all cases, we observe a highly significant difference between low- and high-income countries in terms of the coefficient estimate for all three of the capital taxation measures. The effect for high-income countries is also estimated to be positive in all cases and, with the exception of column (6), highly statistically significant. These coefficients, thus, imply that the net effects for the lower income countries appear to be approximately zero in all cases. Overall the results of Table 3 suggest that the potential endogeneity biases are not the reason for the observed differential effect of capital taxation on economic growth between high- and low-income countries.
For all regressions in Table 3, we also report the results of two key specification tests, the Hansen J-test for instrument exogeneity and the Arellano–Bond test for second-order autocorrelation. A significant Hansen J-statistic would indicate that some of the instruments are likely not exogenous. Similarly, a significant test statistic for the Arellano–Bond autocorrelation test would indicate that some of our instruments are potentially correlated with the error term. As indicated by the reported p-values, the J-test statistic is in all cases insignificant. For the autocorrelation test statistic for the BB estimates the p-values fall in between the 5% and the 10% level. Given that this does not seem to be the case for the AB estimates, it seems that the issue lies with the use of the lagged first differences as instruments which are employed in the BB estimation but not for the AB estimation.
4.4 Results with annual data
The consistency of the results obtained thus far should increase our confidence in the conclusion that at least in developed countries capital taxation does not appear harmful for economic growth and that this is less the case among developing countries. Yet, in our estimation approach to this point we have not fully utilized the annual frequency of the observations in our data set. Given the nature of our data, an alternative approach is to estimate the effect of capital taxation on growth rates using the panel error-correction estimation techniques developed by Pesaran et al. (1999).
Following Pesaran et al. (1999), we can separately estimate the short-run response of the dependent variable to changes in the independent one from the long-run relationship between these variables. In the context of our empirical setup, this implies the estimation of the extended specification given below:
In this equation, the \(\beta _{s}\) coefficients capture the long-run effects on each respective regressor on GDP per capita growth, while the \(\delta _{s,i} \) coefficients capture the corresponding short-run effects of the same regressors. Of particular interest in this specification is the adjustment coefficient \(\phi \) that reflects the speeds at which GDP per capita converges to its long-run equilibrium value.Footnote 7 To capture time-invariant country-specific characteristics as well as global trends affecting growth rates, we further include in the specification a set of country and year dummies. Finally, the specification incorporates the low-income dummy \(d_{i}^{low},\) which is interacted with \(t_{i,t}^\mathrm{cap}\) in order to estimate the differential effect of capital taxation on growth for high- and low-income countries.
One important choice when estimating this specification is what restrictions to impose on the long-run and the short-run coefficients of Eq. (2). One approach is to impose homogeneity on both sets of coefficients across countries. This would result in the standard dynamic-panel fixed-effects estimator (DFE). An alternative approach would be to allow the short-run coefficients to vary across countries, while maintaining the homogeneity assumption regarding the long-run coefficients. This leads to the pooled mean group panel estimator (PMG), preferred by Pesaran et al. (1999). This approach is based on the assumption that the countries in the sample follow a similar development path in the long run, but their growth trajectories could differ in the short run.
Below we present the estimation results when employing these two estimators based on annual frequency data. For comparison, we also report the corresponding estimates obtained when using a simple OLS regression with country and year fixed effects, which does not separate the short- and long-run effects. As in Tables 2 and 3, we perform this estimation using our three main capital taxation measures. In particular in columns (1), (2) and (3) we use the corporate tax ratio as the measure of capital taxation, in columns (4), (5) and (6) we use the broad capital tax ratio, and in columns (7), (8) and (9) the effective average capital tax rate. In all cases panel Table 4 reports the OLS and long-run estimates, while the short-run estimates for the PMG and DFE estimators are reported in Table 5.Footnote 8
Starting with the OLS estimates in columns (1), (4), and (7) of Table 4, we see that using annual data yields very similar results to those obtained previously using 5-year averages. In all cases, the capital taxation measure has a positive and statistically significant association with output growth in high-income countries. Furthermore, there is a statistically significant difference with its effect in low-income countries. The estimated magnitudes of the effects are smaller in this case, but this is because of the higher frequency of the data.Footnote 9 The within R-squared reported in the table is substantially lower than the values we obtained before, which is the result of employing annual data rather than averages and of having the growth rate as the dependent variable instead of the level of GDP per capita.
Proceeding to the DFE estimates in columns (2), (5), and (8), we can now compare the long- and short-run coefficient estimates in Tables 4 and 5. The pattern that emerges is again similar. For high-income countries, we see a positive association between all three measures of capital taxation and growth, both in the long run and in the short run. Regarding the interaction effect, however, we see that while the short-run coefficients are significant for all three variables, the long-run coefficients are only significant for one of the three, namely the broad capital tax ratio. Thus, according to the DFE estimator, which constrains the short- and long-run coefficients to be the same for all countries, the differential effect of capital taxation on growth appears to be mostly of a short-run nature.
Turning to the PMG estimates, however, which relax this homogeneity assumption with respect to the short-run coefficients, suggests a different conclusion. Comparing the estimates reported in columns (3), (6), and (9) of Tables 4 and 5, we see again for high-income countries a positive association between all three measures of capital taxation and growth rates, both in the long run and in the short run. In the case of the interaction effect, however, we see this time that for all three variables the short-run coefficients are statistically insignificant, while the long-run coefficients are negative and significant. This suggests that the assumption of homogeneity of the short-run coefficients imposed by the DFE estimator may have been too restrictive and the correct conclusion is that the differential effect of capital taxation on growth is more of a long-run nature.
In addition to the differences in the estimates for the capital taxation measures and their interactions with the low-income dummy, there are a number of additional differences between the DFE and PMG estimators in the obtained estimates for the other regressors, which suggest that the PMG estimator is a better choice. Overall with the PMG estimator the statistical significance of the long-run coefficients for our other regressors is higher than with the DFE estimator. Instead with the DFE estimator we tend to find statistically significant short-run coefficients for many of the variables, while with the PMG estimator this is only the case for the investment share. The DFE estimator, however, assumes no difference in the short-run coefficients across countries. If the assumption is inaccurate, though, the obtained estimates would be inconsistent and the importance of short-run dynamics will be overstated.
On the other hand, the PMG estimator, which allows the short-run coefficients to vary across countries, is more conservative in this respect. This should be the case, if countries’ short-run growth trajectories vary due to differences in business cycle dynamics. This possibility is supported by the results of a simple Hausman test which indicates that the restriction of homogeneity in long-run coefficients is quite reasonable, yet less so in short-run coefficients.Footnote 10 Overall, these patterns and the comparison with our analysis based on averages from the previous section indicate that the PMG estimates provide a more consistent picture for the effect of capital taxation on growth.Footnote 11 This effect is primarily a long-run effect which consistently varies between high- and low-income countries.
5 Model description
Having documented the differential nature of the relationship between capital taxation and economic growth across high- and low-income countries, we now proceed to rationalize it in the context of a model of endogenous growth. This rationalization is important as none of the existing theoretical contributions in the literature can justify why capital taxation is more detrimental for growth in developing than in developed countries, as our empirical results suggest. While several of the papers, discussed in Sect. 2, indicate that under some circumstances rates of capital taxation should be positive, these circumstances appear more relevant for developing than for developed countries.Footnote 12
To account for why capital taxation is more detrimental for growth in developing countries, we propose a model where the rate of economic growth is endogenous and explicitly linked with capital taxation. Our model is a variant of a multi-country version of the Schumpeterian growth model of Aghion and Howitt (1992) where the long-run engine of growth is the introduction of technologically improved intermediate inputs. These improvements are either products of domestic innovation or the results of imitation of existing intermediate inputs from more technologically advanced countries. Thus, the model allows for technology transfer and this is the only source of interaction across countries.
While this multi-country version of the Aghion–Howitt model has been used many times before to analyze the process of technology transfer and income convergence across countries (Acemoglu et al. 2006; Aghion et al. 2005), the implications of the model for capital taxation have never been studied before. For this purpose, we modify the model to allow for capital accumulation and capital taxation. Using this modified structure, we can study the effects of capital taxation on the long-run equilibrium level and the growth rate of output for different economies which vary in their proximity to the technology frontier. To keep the exposition of the model simple, we do not introduce an explicit country index. We only have a time index, t, which evolves discretely.
5.1 Production structure
The production side of the economy consists of three sectors: a final-good, an intermediate good and a research sector. The unique final good is produced by a large number of competitive firms based on the Cobb–Douglas production technology
that combines labor \(L_{t}\) together with a continuum of different intermediate good variants x indexed by s, with \(A_{t}(s)\) being a productivity parameter that reflects the quality of the current vintage of each intermediate good variant. Final good producers employ labor and intermediate goods to maximize their profits based on the inverse demand functions
where \(w_{t}\) corresponds to the real wage in the final-good sector and \(p_{t}(s)\) to the price of the intermediate good s relative to that of the final good.
The productivity of each intermediate good variant depends on its vintage, with newer vintages having higher productivity levels. Each vintage is the result of an intensive research and development process (R&D) undertaken by competitive firms employing resources in the form of the final good. Each firm entering the research sector aims at producing a new vintage of a given intermediate good variant which would allow the firm to temporarily monopolize the production of that intermediate good. This production process is characterized by uncertainty, with \(\mu _{t}(s)\) denoting the probability of a successful innovation of a new vintage of intermediate good variant s in period t. If this process is successful, it leads to an increase in the productivity level of variant s above the economy-wide average productivity \(A_{t-1}\) by a fixed factor \(\eta >1.\) Thus, the productivity of each intermediate good variant evolves in the following fashion:
The probability of a successful innovation is assumed to equal,
with \(D_{t}(s)\) corresponding to the amount of the final good employed in period t in the research and development process for intermediate good s, which is adjusted by the targeted productivity level. In addition to this firm-specific component, the probability of success also depends on an economy-wide productivity component \(\Phi (\frac{G_{t}}{A_{t}})^{\varphi } ,\) with \(\Phi >0\) and \(0<\varphi <1,\) that is a function of aggregate productivity-adjusted government spending, \(G_{t}.\) This way our model incorporates the positive link between government spending and growth emphasized by Jones et al. (1993).
New intermediate-good vintages can also be introduced from abroad as imitations of those already existing in other countries. Specifically, following Howitt (2000), we postulate that there is a world technological frontier that expands exogenously at a rate \(\gamma >0\)Footnote 13:
Imitators from any given country can introduce older vintages of intermediate goods of any variant from the frontier without undertaking any R&D and raise the productivity of the intermediate good s to:
This implies that imitation of existing vintages from the frontier is preferred to the invention of new ones in any country whose productivity ratio to the technology frontier \(a_{t}\) is low enough:
All intermediate-good variants are produced with physical capital as the sole input in the production process. Specifically, we assume a simple linear one-for-one technology: \(x_{t}(s)=K_{t}(s).\) The production of intermediate goods may take place under perfect or imperfect competition, depending on whether for each variant a new vintage has been invented or not.
In case of intermediate good variants for which a new vintage has been invented, the innovating firm of the latest vintage functions as the incumbent monopolist producer for that variant. Given the demand for each intermediate input from the final-good sector, the profit-maximizing price of the incumbent monopolist is \(p_{t}=\frac{1}{\alpha }r_{t},\) where \(r_{t}\) is the real interest rate paid to capital stock holders.Footnote 14 Yet, following Aghion et al. (2005) and Acemoglu et al. (2006) we assume that the incumbent monopolist is constrained by a competitive fringe of imitators who can produce an alternative version of the latest vintage of the intermediate good at a higher marginal cost of \(\eta \) units of capital.Footnote 15 This implies that the competitive price of these alternative versions would be \(p_{t}=\eta r_{t}.\) Letting \(\eta <\frac{1}{\alpha }\) we have a situation where the monopolist is not able to charge the profit maximizing price of \(\frac{1}{\alpha }\) as the final-good producers would then opt for the imitators’ product. Instead, the incumbent is forced to charge the competitive price, which keeps the imitators out of the market and still allows for some positive profits.
These monopoly profits, however, only last for one period. In the subsequent period, the incumbent monopolist retires and the production is taken over either by a new incumbent that has succeeded in inventing a new improved vintage of the intermediate good or by the competitive fringe of imitators. In either case, the above set of assumptions guarantees that all intermediate good variants are priced at \(p_{t}=\eta r_{t}\) independently of how the market for each variant is structured. The demand for each variant equals \(x_{t}(s)=(\frac{\alpha }{r_{t}\eta })^{\frac{1}{1-\alpha }}A_{t}(s)L_{t}\) and the corresponding profits for incumbent monopolists are:
These profits are what research and development firms seek to reap, and thus, provide an incentive for technological innovation. However, assuming as in Klasing and Milionis (2014) that entry into the research-sector is free and that potential entrants are all risk neutral implies that research and development firms will earn zero expected net profits. Hence, the allocation of resources in the research sector will be governed by the following research arbitrage condition,
Substituting (7) and (10) into (11), it can be shown that in equilibrium the innovation process is ex ante symmetrical across intermediate good variants and the corresponding probabilities of success statistically independent and equal to:
Noting for the total capital stock in the economy that \(K_{t}=\int _{0} ^{1}K_{t}(s)\mathrm{d}s\) and for the average productivity parameter that \(A_{t} =\int _{0}^{1}A_{t}(s)\mathrm{d}s,\) following Howitt and Aghion (1998) we can rewrite the final good production function (3) more compactly as:
or in per efficiency units terms as \(y_{t}=k_{t}^{\alpha }\), where \(k_{t}\equiv \frac{K_{t}}{A_{t}L_{t}}\) corresponds to the capital per efficiency unit of labor employed in the final goods sector. This allows for the wage, the real interest rate and the aggregate expected intermediate-good sector profits to be written simply as:
5.2 Households
Let the economy be populated by a constant mass of infinitely-lived identical households. The representative household decides on an optimal time path of consumption, \(C_{t},\) and labor supply, \(L_{t},\) in order to maximize the life-time utility function,
where \(\beta \) is the time-discount factor, \(\omega \) captures the relative disutility of labor compared to the utility of consumption and \(\psi \) is the inverse of the Frisch elasticity of labor supply. Households own both the stock of physical capital and the firms. Thus, their income comes from three sources, labor income, capital rental rates and firm profits. Their budget constraint can hence be written as:
The left-hand side of the equation denotes household expenditures on consumption and investment with \(\delta \) corresponding to the capital depreciation rate. The right-hand side shows the households’ after tax income given the tax rates imposed by the government on labor income, \(\tau _{t}^{l},\) capital income, \(\tau _{t}^{k},\) and firm profits net of R&D costs, \(\tau _{t}^{\pi }.\)
The maximization problem yields two optimality conditions. The intertemporal consumption Euler equation given by,
and the intratemporal arbitrage equation between consumption and labor supply,
5.3 Government
The government in each economy is modeled following Chamley (1986) and Judd (1985). It has a stream of spending \(\{G_{t}\}_{t=0}^{\infty }\) that it aims to finance. For simplicity, we assume this spending to grow at exactly the same rate as the economy, \(G_{t}=A_{t}G_{0},\) so that it corresponds to a fixed share of the economy’s output in every period. To raise revenue it relies on the three tax instruments already discussed in the previous section: a tax on capital income at rate \(\tau _{t}^{k},\) a tax on labor income at rate \(\tau _{t}^{l},\) and a tax on firm net profits at rate \(\tau _{t}^{\pi }.\)Footnote 16\(^{,}\)Footnote 17 This implies the following government budget constraint:
5.4 Aggregate productivity and growth
Our model features an endogenous long-run growth rate which is driven by quality improvements in intermediate goods raising aggregate productivity. Capital accumulation plays only a reinforcing role to this endogenous innovation process, as in Howitt and Aghion (1998), but would eventually come to a halt in the absence of increases in aggregate productivity. These quality improvements in a given economy can in principle come from two sources: innovation of new intermediate good variants and imitation of existing variants from the technology frontier. As explained above, these sources do not operate complementarily but act as substitutes to one another.
As Eq. (9) indicates, innovation will only take place in an economy where the current level of productivity relative to the technology frontier lies above the fixed threshold \(\frac{\theta }{\eta }.\) In that case, aggregate productivity will follow the law of motion \(A_{t+1}=[1+\mu _{t} (\eta -1)]A_{t}\) and its growth rate, \(g_{t},\) will be proportional to the rate of innovation \(\mu _{t}.\) However, if the productivity ratio relative to the frontier, \(a_{t},\) is below the \(\frac{\theta }{\eta }\) threshold, then productivity growth will be driven by imitation. In that case, aggregate productivity will follow the law of motion \(A_{t+1}=\theta \bar{A}_{t}\) and its growth rate can be shown to be inversely proportional to \(a_{t}.\) Thus, we can summarize the productivity dynamics of our model economy as:
6 Equilibrium analysis
Having described all the elements of our model economy, we can now proceed to define and analyze its equilibrium. The dynamic equilibrium of the model will consist of a sequence, starting from period \(t=0,\) of the main endogenous variables \(\{A_{t},K_{t},Y_{t},C_{t},L_{t},D_{t},\Pi _{t},r_{t},w_{t},\mu _{t},a_{t}\}_{t=0}^{\infty }\) for each country given the initial conditions \(\{A_{0},K_{0},G_{0},a_{0}\}\) and a path of fiscal variables \(\{\tau _{t} ^{k},\tau _{t}^{l},\tau _{t}^{\pi }\}_{t=0}^{\infty }.\) The sequence should be such that for the resulting prices all households maximize their utility, all firms maximize their profits, the government obeys its budget constraint, and factor markets clear. Furthermore the resource constraint of the economy has to be satisfied so that:
For the purpose of our analysis, we focus on a stationary equilibrium of the model where variables \(\{A_{t},K_{t},Y_{t},C_{t},D_{t},\Pi _{t},w_{t}\}\) grow at a balanced rate and variables \(\{L_{t},r_{t},\mu _{t},a_{t}\}\) are constant. In our characterization of the equilibrium, we also treat the tax rates as fixed, \(\{\tau ^{k},\tau ^{l},\tau ^{\pi }\}\), so that we can then analyze their comparative static effects on the equilibrium level and growth rate of output. To determine the equilibrium values of all endogenous variables, we follow the approach of Aghion et al. (2013). The details are provided in “Section D” of Appendix. In essence we use equations (13), (17), (18), (19) and (21) substituting out the remaining endogenous variables, to solve for the stationary values of the key endogenous variables \(K_{t},Y_{t},C_{t},\) in per effective worker terms as well as \(L_{t}.\) We then use Eq. (20) to determine the equilibrium growth rate. Based on this approach we can prove the following lemma.
Lemma 1
If \(\delta =1\) and the economy is in a stationary equilibrium with \(L_{t}\) constant at \(L^{*}\) and \(K_{t},Y_{t},C_{t}\) growing at rate \(g^{*},\) then it must be that \(L^{*}=\{\frac{(1-\alpha )(1-\tau ^{l})}{\omega \rho }\}^{\frac{1}{1+\psi }},\)\(k_{t}\equiv \frac{K_{t}}{A_{t}L_{t}}\) is fixed at \(k^{*}=(\frac{\alpha }{\eta }\frac{\beta (1-\tau _{t}^{k})}{1+g^{*}} )^{\frac{1}{1-\alpha }},\)\(y_{t}\equiv \frac{Y_{t}}{A_{t}L_{t}}\) is fixed at \(\ y^{*}=(k^{*})^{\alpha }\) and \(c_{t}\equiv \frac{C_{t}}{A_{t}L_{t}}\) is fixed at \(c^{*}=\rho y^{*}\) with \(\rho =1-\frac{\alpha }{\eta } (\eta -1+\beta )-\frac{\alpha }{\eta }(1-\beta )\tau ^{k}-(1-\alpha )\tau ^{l}.\)
Proof
See Appendix. \(\square \)
6.1 Level and growth effects of tax rates
Having characterized the stationary equilibrium of the model economy, we can now study the level effects and the growth effects resulting from changes in the fixed tax rates on capital, \(\tau ^{k},\) and labor, \(\tau ^{l}.\) In the context of this analysis, we do not consider changes in the tax rate on firm net profits, \(\tau ^{\pi },\) since these profits are always zero in equilibrium, as we already remarked above.
6.1.1 Case I: Lagging economy
We perform this comparative static analysis first for the case of an economy that is far from the technology frontier and where growth is driven by imitation. To determine the equilibrium growth rate of the economy and the corresponding values of all endogenous variables, we first need to pin down the equilibrium value for \(a_{t}\). Dividing the law of motion for aggregate productivity \(A_{t+1}=\theta \bar{A}_{t}\) by \(\bar{A}_{t+1}\) and noting (8) we get that:
Substituting this expression into (20) we obtain the long-run growth rate\(\ g^{*}=\gamma .\) Hence, in this case the long-run growth rate will be exogenous to the economy’s characteristics and equal to that of the technology frontier. This equilibrium will emerge provided that \(\eta <1+\gamma ,\) so that \(a^{*}<\frac{\theta }{\eta },\) as postulated initially. For this equilibrium, we can show the following comparative static effects.
Proposition 1
Consider an economy where \(\eta <1+\gamma \) and \(\delta =1.\) In this economy, an increase in the rate of capital taxation, \(\tau ^{k},\) will lead to an increase in equilibrium labor supply, \(L^{*},\) and a decrease in the long-run level of capital per effective worker, \(k^{*}.\) An increase in the rate of labor taxation, \(\tau ^{l},\) on the other hand, will reduce \(L^{*},\) but have no effect on \(k^{*}.\) Increases in either \(\tau ^{k}\) and \(\tau ^{l}\) do not affect the long-run growth rate of the economy, \(g^{*}.\)
Proof
The proof of the proposition follows from comparative static analysis of the equilibrium values of \(L^{*}\ \)and \(k^{*}\) derived in Lemma 1 and uses the fact that \(g^{*}=\gamma .\)\(\square \)
As the proposition makes clear, in an economy that is far from the technology frontier increases in tax rates have negative-level effects on economic activity, but they do not influence the economy’s long-run growth rate.
6.1.2 Case II: Leading economy
Let us now turn to the case of an economy that is close to the technology frontier and where growth is driven by domestic innovation. In this case, expression (20) implies that the long-run growth rate of the economy is \(g^{*}=\alpha \frac{(\eta -1)^{2}}{\eta }\Phi (G_{0})^{\varphi }(k^{*})^{\alpha }L^{*}.\) This equilibrium will emerge provided that \(\eta \ge 1+\gamma ,\) and in this case is independent of the exact value of \(a_{t}.\) For this equilibrium, we can show the following comparative static effects.
Proposition 2
Consider an economy where \(\eta \ge 1+\gamma \) and \(\delta =1.\) In this economy, an increase in the rate of capital taxation, \(\tau ^{k},\) will lead to an increase in equilibrium labor supply, \(L^{*},\) and a decrease in the long-run level of capital per effective worker, \(k^{*}.\) An increase in the rate of labor taxation, \(\tau ^{l},\) will have the opposite effect reducing \(L^{*}\) and increasing \(k^{*}.\) Increases in \(\tau ^{k}\) and \(\tau ^{l}\) reduce the long-run growth rate of the economy, \(g^{*}.\)
Proof
The proof of the proposition again follows from a comparative static analysis. The effects on \(L^{*}\) can be obtained from the equilibrium value of \(L^{*}\) derived in Lemma 1. To obtain the effects on \(k^{*}\) one needs to implicitly differentiate \(k^{*}=(\frac{\alpha }{\eta }\frac{\beta (1-\tau ^{k})}{1+g^{*}})^{\frac{1}{1-\alpha }}\) after substituting in \(g^{*}=\alpha \frac{(\eta -1)^{2}}{\eta }\Phi (G_{0})^{\varphi }(k^{*})^{\alpha }L^{*}\) and noting the equilibrium value of \(L^{*}.\) To obtain the effects on \(g^{*}\) one needs to implicitly differentiate \(g^{*}=\alpha \frac{(\eta -1)^{2}}{\eta }\Phi (G_{0})^{\varphi }(k^{*})^{\alpha }L^{*}\) after substituting in \(k^{*}=(\frac{\alpha }{\eta }\frac{\beta (1-\tau ^{k})}{1+g^{*}})^{\frac{1}{1-\alpha }}\) and noting the equilibrium value of \(L^{*}.\)\(\square \)
As the proposition makes clear, in an economy that is close to the technology frontier increases in tax rates not only have negative level effects on economic activity, but they also reduce the economy’s long-run growth rate. This is because higher taxes on capital will lower the capital intensity of the economy and higher taxes on labor will lower employment. Both these changes will result in lower profits from the introduction of new intermediate goods. These profits, however, are what stimulates potential innovators in the R&D sector, and they determine the market size for new innovations. As profits go down, there will be fewer innovations each period and, hence, lower growth.
6.2 Growth promoting effects of nonzero capital taxation
Having documented the level effects and the growth effects resulting from isolated changes in the fixed rates of capital and labor incomes taxes, we now proceed to explore how combined fiscal policy changes can affect the long-run growth rate of the economy. In this exploration, we ignore the case of an economy that is far from the technology frontier where the long-run growth rate is effectively exogenous and focus on the case of an economy that is close to the technology frontier and for which changes in the fiscal variables can influence the long-run growth rate, as established in Proposition 2.
Following a similar approach as in Peretto (2003, 2007), we consider two combined fiscal policy changes. The first one is an increase in the capital tax rate, \(\tau ^{k},\) coupled with a corresponding decrease in the labor tax rate, \(\tau ^{l},\) that leaves total tax revenue and, hence, government spending, \(G_{0},\) unchanged. The second one is an increase in \(\tau ^{k}\) coupled with a corresponding increase in \(G_{0}\) that leaves \(\tau ^{l}\) unchanged. To compare the impact of these policy changes on growth relative to the standard policy prescription of zero capital taxation, we will analyze these policy changes starting from an equilibrium where \(\tau ^{k}\) is initially zero and all the revenue that the government needs in order to finance its spending is raised from taxes on labor only.
To facilitate the analysis in the absence of a closed-form solution for \(k^{*}\) and \(g^{*},\) we follow Aghion et al. (2013) and compute an approximate value of the long-run growth rate for values of \(\eta \approx 1.\) The value of 1 for \(\eta \) serves as a good benchmark, since it corresponds to the case where intermediate good producers cannot make any profits and, hence, do not devote any resources to innovation. In the resulting benchmark equilibrium, long-run growth is driven by imitation and is equal to the growth rate of the technology frontier, \(\gamma \). Moreover, when an economy is in that equilibrium changes in the capital tax rate will have no effect on the long-run growth rate.
In this subsection, we explore the extent to which increases in capital taxation above zero will affect the long-run growth rate of a stationary equilibrium in the vicinity of this benchmark equilibrium. While limiting our focus only to cases where \(\eta \approx 1\) may appear as quite restrictive, we should emphasize that it is not. By construction values of \(\eta \) less than 1 are not admissible and, as explained in the previous section, \(\eta \) needs to be greater than \(1+\gamma \) in order for innovation to preferable to imitation. At the same time, values for \(\eta \) substantially larger than 1 are not empirically plausible either. This is because they would imply big jumps in productivity from individual innovations and would also result in large shares of output being devoted to R&D, as evident from (14 ). With this in mind, we establish the following lemma.
Lemma 2
Consider an economy where\(\ \eta \ge 1+\gamma \) and \(\delta =1.\) For values of \(\eta \approx 1\) the long-run growth rate of the economy is equal to:
Proof
See Appendix. \(\square \)
Using this approximate expression for the long-run growth rate, the proposition below establishes that small increases in capital taxation starting from a benchmark equilibrium where the tax rate on capital is zero can, under some conditions, lead to an increase in the long-run growth rate.
Proposition 3
Consider an economy where\(\ \eta \ge 1+\gamma \) but \(\eta \approx 1,\)and \(\delta =1.\) Suppose the economy is in a stationary equilibrium with \(\tau ^{k}=0.\) An increase in \(\tau ^{k}\) coupled with a decrease in \(\tau ^{l}\) that leaves the government budget in balance increases the long-run growth rate of the economy provided that \(\tau ^{l}\) is high enough. Similarly, an increase in \(\tau ^{k}\) coupled with an increase in \(G_{0}\) that leaves the government budget in balance increases the long-run growth rate of the economy provided that \(\tau ^{l}\) is low enough.
Proof
See Appendix. \(\square \)
The main intuition for both results is similar. Around the benchmark equilibrium of \(\eta =1\) the distortions resulting from an increase in capital taxation are limited. If at the same time labor taxation is high, which can have a large adverse effect on labor supply and innovation rates, then a marginal shift of the taxation burden toward capital can boost growth rates. Furthermore, if government spending has a positive impact on innovation rates, a marginal increase in capital taxation used to fund additional government spending can also be growth enhancing in an economy where tax rates are low.
As Proposition 3 makes clear, though, these growth-enhancing effects of capital taxation only apply to economies that are close to the technology frontier. These economies are actively involved in technological innovation for which the domestic market size plays an important role. These effects do not apply to economies that are further away from the technology frontier. For such economies, growth will be exogenous and it will simply be driven by imitation of existing technologies from the frontier. Thus, changes in tax policies should not be expected to influence the rate of long-run growth.
7 Conclusion
One of the main policy prescriptions in the public finance literature is that the optimal tax rate on capital income should be zero. This is because any positive rate of capital taxation is bound to distort the intertemporal allocation of resources in an economy between the present and the future, and thus adversely affects economic growth. In this paper, we start by investigating empirically whether capital taxation is indeed retarding growth in a large panel of 77 developed and developing countries going back to 1965 using different ways of measuring capital taxation. We conduct our empirical analysis using a variety of econometric methods that include the standard panel growth regressions with fixed effects, the GMM estimation techniques proposed by Arellano and Bond (1991) and Blundell and Bond (1998), and the panel error-correction estimation techniques of Pesaran et al. (1999).
In contrast to this stark prescription stemming from theory, in our empirical analysis we do not find that greater reliance on capital taxation has a strong negative effect on economic growth. Measuring reliance on capital taxation in different ways, we actually obtain for several capital taxation measures a positive and statistically significant relationship with a country’s rate of economic growth. Moreover, we demonstrate that the nature of the relationship between growth and capital taxation varies with a country’s level of development with the association being strongly positive for high-income countries but weaker and typically insignificant for low-income countries. This pattern is also robust across econometric specifications and when using different measures of capital taxation.
To rationalize our empirical findings, we propose a multi-country innovation-based growth model where innovations spill over from leading to lagging economies. Our model highlights two channels through which capital taxation can have a positive impact on long-run growth rates: (a) by reducing distortionary labor taxation, and (b) by funding productive government spending. As the analysis of our model demonstrates, these channels apply only to leading economies that are close to the technology frontier and where growth is driven by domestic innovation. For lagging economies that are far from the technology frontier, these channels are not relevant, as growth is driven by imitation of foreign innovations and is effectively exogenous.
Our finding regarding the differential effect of capital taxation on growth rates for leading and lagging economies also suggests that optimal rates of capital and labor taxation may differ between these groups of economies. This could be explored further following the approach of Aghion et al. (2013). Their analysis together with ours implies that the standard theoretical prescription of zero capital taxation seems less relevant for developed economies where domestic innovation is an important engine of growth and fiscal policies can play an important role in boosting that engine. In these economies, it can be beneficial in terms of economic growth to shift part of the burden of taxation to capital. This will occur either when the resulting tax revenue is used to finance government spending that supports innovation or when it is combined with a lowering of the tax burden on labor, which is also an important input in the innovation process.
This conclusion, however, is not equally applicable to less developed economies where the main engine of growth is the imitation of existing technologies. As this process cannot be stimulated by capital taxes, the optimality of zero capital taxation is likely to still apply in these economies. Moreover, low capital taxation might even be a useful way to attract investment by foreign corporations and knowledge transfers from the technology frontier. In our model, these complexities have not been explicitly modeled, as technology transfer is assumed to occur without any costs or frictions. In reality, though, this process may require large capital investments and be subject to fierce competition (International Monetary Fund 2014).Footnote 18 Thus, for less-developed economies maintaining an attractive tax structure for foreign investors with low rates of capital taxation is of higher priority compared to developed economies.
Notes
See Sect. 2 for more details.
As the analysis of Straub and Werning (2014) highlights, though, this result hinges on the assumption made about the intertemporal elasticity of substitution. With an elasticity of substitution below 1, which is not empirically implausible, the optimal rate of capital taxation is no longer zero.
We should also point out that there is an extensive literature that investigates the implications of capital taxation in the case of open economies. See for example Gross (2014), Mayer-Foulkes (2015) and McKeehan and Zodrow (2017) for recent contributions as well as Keen and Konrad (2013) for an overview of this line of research.
The pattern is similar if instead of the total tax revenue we control for the share of government spending in aggregate GDP. This is not surprising, as the two variables are closely related and both reflect underlying differences in the size of government across countries and over time.
We should note here that these regressions can also be estimated using the top marginal and the effective marginal corporate tax rates employed in the previous section and the obtained results are very similar. As these data are only available for a smaller set of countries, however, we chose not to use these measures for the remaining part of our analysis.
From the histogram one may wonder whether the result that we document here is driven by a few outliers that have very low income levels, since the density on the right part of the graph becomes very low. This does not seem to be the case as the exact same result is obtained when these observations are dropped from the sample.
Note that in this case we do not have to employ 5-year averages of the variables. The separation between long-run and short-run coefficients allows us to still account for the effect of the business cycle.
We should note here that the sample of countries used for this estimation is slightly smaller. Countries with fewer than 15 years of data have been omitted from the analysis in this table to ensure convergence of the PMG estimator. For consistency, we do not include these countries also in the sample for the OLS and DFE estimation. Doing otherwise, though, does not affect the results.
In fact we should note here that all coefficients are roughly of a factor five smaller than before, as expected given that we are using annual data instead of 5-year averages. Additionally the coefficient on the log of lagged output is one point lower than before because the dependent variable is now the change in the log of output rather than its level.
We should note here that the PMG estimator is consistent regardless of whether the restriction of homogeneity in the short-run coefficients is accurate, whereas the DFE estimator is efficient when the restriction is true, but inconsistent when it is not. Both approaches can be contrasted against the mean group estimator, which allows for heterogeneity in both short- and long-run coefficients.
This conclusion is also supported by the estimates for the adjustment coefficient, \(\phi \), which are negative and statistically significant in the case of PMG estimates suggesting the existence of a common co-integrating vector.
For example, if positive capital taxation is justified by inequality considerations (Saez 2013), market incompleteness (Aiyagari 1995), lack of fiscal capacity (Gordon and Li 2009) or short-sightedness of politicians (Acemoglu et al. 2011), then optimal rates of capital taxation should be higher in developing countries where these phenomena are more prevalent. If this is the case, then the same observed positive rate of capital taxation will correspond to a large deviation from the optimal rate in developed economies. Hence, it should be more detrimental for growth in developed rather than developing countries.
When considering the evolution of the world technology frontier, we should in principle consider the extent to which the frontier grows as a result of domestically produced innovations. To keep the analysis simple, we ignore this link by focusing our analysis on a small-size economy and refer the reader to Aghion et al. (2005) for more on this point.
This last equation can be obtained from the first-order condition of the monopolist’s profit maximization problem, \(\max _{\{x_{t}(i),K_{t}(i)\}}\{p_{t}(i)x_{t}(i)-r_{t}K_{t}(i)\},\) after the inverse demand for \(x_{t}(i),\) Eq. (5) has been substituted in. Because the optimal price is the same across all variants we drop the reference to i.
This implies that the advantage of an innovating firm in terms of production cost over the competitive fringe is of the same magnitude as the size of the technological improvement embedded in the new intermediate-good vintage. This assumption can be justified if the fringe has access to the technology of the previous vintage of that intermediate good. This would naturally occur if that technology was patent-protected and the patent expired following the arrival of the new vintage.
As implied by our research arbitrage equation (11), net profits are zero in all periods. Thus, the government-imposed rate of profit taxation plays no role in our analysis.
It is important also to note here that the model counterpart of the corporate profit taxation on which we focus in our empirical analysis is the revenue from both capital income and net profits. This is because profits in the model are net of payments to all factors of production.
See Acemoglu et al. (2006) for an example of how such frictions could be introduced in an innovation-based growth framework.
References
Abel, A. B. (2007). Optimal capital income taxation. NBER working paper no. 13354.
Acemoglu, D., Aghion, P., & Zilibotti, F. (2006). Distance to frontier, selection, and economic growth. Journal of the European Economic Association, 4(1), 37–74.
Acemoglu, D., Golosov, M., & Tsyvinski, A. (2011). Political economy of Ramsey taxation. Journal of Public Economics, 95(7–8), 467–475.
Aghion, P., Akcigit, U., & Fernández-Villaverde, J. (2013). Optimal capital versus labor taxation with innovation-led growth. NBER working paper no. 19086
Aghion, P., & Howitt, P. (1992). A model of growth through creative destruction. Econometrica, 60(2), 323–351.
Aghion, P., Howitt, P., & Mayer-Foulkes, D. (2005). The effect of financial development on convergence: Theory and evidence. Quarterly Journal of Economics, 120(1), 173–222.
Aiyagari, S. R. (1995). Optimal capital income taxation with incomplete markets, borrowing constraints, and constant discounting. Journal of Political Economy, 103(6), 1158–1175.
Anagnostopoulos, A., Carceles-Poveda, E., & Lin, D. (2012). Dividend and capital gains taxation under incomplete markets. Journal of Monetary Economics, 59(7), 599–611.
Angelopoulos, K., Economides, G., & Kammas, P. (2007). Tax-spending policies and economic growth: Theoretical predictions and evidence from the OECD. European Journal of Political Economy, 23(4), 885–902.
Arachi, G., Bucci, V., & Casarico, A. (2015). Tax structure and macroeconomic performance. International Tax and Public Finance, 22(4), 635–662.
Arellano, M., & Bond, S. (1991). Some tests of specification for panel data: Monte carlo evidence and an application to employment equations. Review of Economic Studies, 58(2), 277–297.
Arnold, J. M., Brys, B., Heady, C., Johansson, s, Schwellnus, C., & Vartia, L. (2011). Tax policy for economic recovery and growth. Economic Journal, 121(550), F59–F80.
Atkeson, A., Chari, V., & Kehoe, P. J. (1999). Taxing capital income: A bad idea. Federal Reserve Bank of Minneapolis Quarterly Review, 23(3), 3–17.
Atkinson, A. B., & Stiglitz, J. E. (1976). The design of tax structure: Direct versus indirect taxation. Journal of Public Economics, 6(1–2), 55–75.
Blundell, R., & Bond, S. (1998). Initial conditions and moment restrictions in dynamic panel data models. Journal of Econometrics, 87(1), 115–143.
Cass, D. (1965). Optimum growth in an aggregative model of capital accumulation. Review of Economic Studies, 32(3), 233–240.
Centre for Business Taxation. (2017). CBT tax database. Oxford: Oxford University.
Chamley, C. (1986). Optimal taxation of capital income in general equilibrium with infinite lives. Econometrica, 54(3), 607–622.
Conesa, J. C., Kitao, S., & Krueger, D. (2009). Taxing capital? Not a bad idea after all!. American Economic Review, 99(1), 25–48.
Cozzi, G. (2004). Rat race, redistribution, and growth. Review of Economic Dynamics, 7(4), 900–915.
Devereux, M. P., Griffith, R., & Klemm, A. (2002). Corporate income tax reforms and international tax competition. Economic Policy, 17(35), 449–495.
Devereux, M. P., Lockwood, B., & Redoano, M. (2008). Do countries compete over corporate tax rates? Journal of Public Economics, 92(5–6), 1210–1235.
Diamond, P. A., & Mirrlees, J. A. (1971). Optimal taxation and public production I: Production efficiency. American Economic Review, 61(1), 8–27.
Djankov, S., Ganser, T., McLiesh, C., Ramalho, R., & Shleifer, A. (2010). The effect of corporate taxes on investment and entrepreneurship. American Economic Journal: Macroeconomics, 2(3), 31–64.
Easterly, W., & Rebelo, S. (1993). Fiscal policy and economic growth: An empirical investigation. Journal of Monetary Economics, 32(3), 417–458.
Eberhardt, M., & Teal, F. (2011). Econometrics for grumblers: A new look at the literature on cross-country growth empirics. Journal of Economic Surveys, 25(1), 109–155.
European Commission. (2015). Tax reform in EU member states: 2015 report. Directorate General for Taxation & Customs Union, Taxation paper no. 58.
Feenstra, R. C., Inklaar, R., & Timmer, M. P. (2015). The next generation of the penn world table. American Economic Review, 105(10), 3150–3182.
Gemmell, N., Kneller, R., & Sanz, I. (2011). The timing and persistence of fiscal policy impacts on growth: Evidence from OECD countries. Economic Journal, 121(550), F33–F58.
Golosov, M., Troshkin, M., Tsyvinski, A., & Weinzierl, M. (2013). Preference heterogeneity and optimal capital income taxation. Journal of Public Economics, 97(1), 160–175.
Gordon, R. H., & Li, W. (2009). Tax structures in developing countries: Many puzzles and a possible explanation. Journal of Public Economics, 93(7–8), 855–866.
Gross, T. (2014). Equilibrium capital taxation in open economies under commitment. European Economic Review, 70(1), 75–87.
Howitt, P. (2000). Endogenous growth and cross-country income differences. American Economic Review, 90, 829–846.
Howitt, P., & Aghion, P. (1998). Capital accumulation and innovation as complementary factors in long-run growth. Journal of Economic Growth, 3(2), 111–130.
International Monetary Fund. (2014). Spillovers in international corporate taxation. IMF policy paper.
International Monetary Fund. (2015). Fiscal policy and long-term growth. IMF policy paper.
Islam, N. (1995). Growth empirics: A panel data approach. Quarterly Journal of Economics, 110(4), 1127–1170.
Jacobs, B., & Bovenberg, A. L. (2009). Human capital and optimal positive taxation of capital income. International Tax and Public Finance, 17(5), 451–478.
Jones, L. E., Manuelli, R. E., & Rossi, P. E. (1993). Optimal taxation in models of endogenous growth. Journal of Political Economy, 101(3), 485–517.
Judd, K. L. (1985). Redistributive taxation in a simple perfect foresight model. Journal of Public Economics, 28(1), 59–83.
Keen, M., & Konrad, K. A. (2013). The theory of international tax competition and coordination. In E. Saez, M. Feldstein, R. Chetty, & A. J. Auerbach (Eds.), Handbook of public economics (Vol. 5, pp. 257–328). Amsterdam: Elsevier.
Klasing, M. J., & Milionis, P. (2014). Cultural constraints on innovation-based growth. Economic Inquiry, 52(2), 796–810.
Kneller, R., Bleaney, M. F., & Gemmell, N. (1999). Fiscal policy and growth: Evidence from OECD countries. Journal of Public Economics, 74(2), 171–190.
Koopmans, T. C. (1965). On the concept of optimal economic growth. The economic approach to development planning (pp. 225–287). Chicago, IL: Rand McNally.
Lee, Y., & Gordon, R. H. (2005). Tax structure and economic growth. Journal of Public Economics, 89(5–6), 1027–1043.
Mankiw, N. G. (2000). The savers–spenders theory of fiscal policy. American Economic Review, 90(2), 120–125.
Mankiw, N. G., Weinzierl, M., & Yagan, D. (2009). Optimal taxation in theory and practice. Journal of Economic Perspectives, 23(4), 147–174.
Mayer-Foulkes, D. (2015). The challenge of market power under globalization. Review of Development Economics, 2(2), 244–264.
McKeehan, M. K., & Zodrow, G. R. (2017). Balancing act: Weighing the factors affecting the taxation of capital income in a small open economy. International Tax and Public Finance, 24(1), 1–35.
Mendoza, E. G., Milesi-Ferretti, G. M., & Asea, P. (1997). On the ineffectiveness of tax policy in altering long-run growth: Harberger’s superneutrality conjecture. Journal of Public Economics, 66(1), 99–126.
Mendoza, E. G., Razin, A., & Tesar, L. L. (1994). Effective tax rates in macroeconomics: Crosscountry estimates of tax rates on factor incomes and consumption. Journal of Monetary Economics, 34(3), 297–323.
Milesi-Ferretti, G. M., & Roubini, N. (1998). On the taxation of human and physical capital in models of endogenous growth. Journal of Public Economics, 70(2), 237–254.
OECD. (2017). Revenue statistics: Comparative tables. OECD Tax Statistics Database.
Peretto, P. F. (2003). Fiscal policy and long-run growth in R&D-based models with endogenous market structure. Journal of Economic Growth, 8(3), 325–347.
Peretto, P. F. (2007). Corporate taxes, growth and welfare in a Schumpeterian economy. Journal of Economic Theory, 137(1), 353–382.
Pesaran, M. H., Shin, Y., & Smith, R. P. (1999). Pooled mean group estimation of dynamic heterogeneous panels. Journal of the American Statistical Association, 94(446), 621–634.
Piketty, T. (2014). Capital in the twenty-first century. Cambridge: Harvard University Press.
Ramsey, F. P. (1928). A mathematical theory of saving. Economic Journal, 38(152), 543–559.
Roodman, D. (2009). A note on the theme of too many instruments. Oxford Bulletin of Economics and Statistics, 71(1), 135–158.
Saez, E. (2013). Optimal progressive capital income taxes in the infinite horizon model. Journal of Public Economics, 97, 61–74.
Stiglitz, J. E. (2012). The price of inequality: How today’s divided society endangers our future. New York: W. W. Norton.
Straub, L., & Werning, I. (2014). Positive long run capital taxation: Chamley–Judd revisited. NBER working paper no. 20441.
UNU-WIDER. (2017). World income inequality database (version WIID3.4).
Volkerink, B., & de Haan, J. (2001). Tax ratios: A critical survey, no. 5. In OECD tax policy studies. OECD Publications Service.
Widmalm, F. (2001). Tax structure and growth: Are some taxes better than others? Public Choice, 107(3–4), 199–219.
Acknowledgements
This paper has benefited from useful comments and suggestions by Jakob de Haan, Maurizio Iacopetta, Robbert Maseland, Pietro Peretto, and two anonymous referees. The authors would also like to thank seminar participants at the universities of Bologna, Groningen, Nice and St. Gallen as well as conference participants at the 2016 ASSET annual meeting, the 2015 Barcelona GSE summer forum, the 2015 EPCS annual meeting, the 2015 OFCE-SKEMA summer workshop and the 2017 SMYE meeting for fruitful discussions.
Author information
Authors and Affiliations
Corresponding author
Additional information
Publisher's Note
Springer Nature remains neutral with regard to jurisdictional claims in published maps and institutional affiliations.
Appendix
Appendix
1.1 Section A: List of countries in our sample
Our sample consists of the following 77 countries:
Argentina, Australia, Austria, Bahamas, Barbados, Belgium, Belize, Bolivia, Brazil, Cameroon, Canada, Cape Verde, Chile, Colombia, Costa Rica, Czech Republic, Cote d’ Ivoire, Democratic Republic of the Congo, Denmark, Dominican Republic, Ecuador, El Salvador, Estonia, Finland, France, Germany, Ghana, Greece, Guatemala, Honduras, Hungary, Iceland, Indonesia, Ireland, Israel, Italy, Jamaica, Japan, Kazakhstan, Kenya, Korea, Latvia, Luxembourg, Malaysia, Mauritius, Mexico, Morocco, Netherlands, New Zealand, Nicaragua, Niger, Norway, Panama, Paraguay, Peru, Philippines, Poland, Portugal, Rwanda, Senegal, Singapore, Slovak Republic, Slovenia, South Africa, Spain, Swaziland, Sweden, Switzerland, Togo, Trinidad and Tobago, Tunisia, Turkey, Uganda, United Kingdom, United States, Uruguay, Venezuela.
1.2 Section B: Data description and sources
This section provides details on all the variables that we employ in our empirical analysis. It explains how each variable is constructed and on which sources it is based. Table 6 provides the key descriptive statistics for each variable.
GDP per capita figures for all countries are taken from the Penn World Table, Version 9.0 (Feenstra et al. 2015). Specifically, given our focus on growth rates, we employ the real GDP series in constant 2011 national prices (rgdpna), which we divide with the population figures from the same database to obtain the per capita values.
The population growth rate corresponds to the inter-annual rate of change in the total population of each country and is also calculated based on the population data reported in the Penn World Table, Version 9.0.
The investment share corresponds to the ratio of gross fixed capital formation to GDP in current prices reported in the Penn World Table, Version 9.0.
Our human capital growth measure is the growth rate of human capital index provided by the Penn World Table, Version 9.0. The index reflects the stock of human capital in each country and it combines information on average years of schooling for the working age population with return rates to education.
The share of total taxes in GDP is as reported in the OECD Revenue Statistics database (OECD 2017).
The share of corporate taxes in GDP is obtained directly from the OECD Revenue Statistics database. It corresponds to the ratio of the revenue from taxes on income, profits and capital gains of corporations (tax category 1200) over total GDP in a given year.
The corporate tax ratio is also obtained directly from the OECD Revenue Statistics database. It corresponds to the ratio of the revenue from taxes on income, profits and capital gains of corporations over total tax revenue in a given year. It is, thus, given by the formula,
where TotalTax denotes revenue from all tax categories and \(Tax1200\ \) denotes tax revenue from tax category 1200, which is taxes on income, profits and capital gains of corporations.
The broad capital tax ratio is calculated based on data from the OECD Revenue Statistics and the Penn World Table, Version 9.0. It corresponds to the ratio of revenue from several taxes levied on capital over total tax revenue in a given year. The selection of taxes is based on Volkerink and de Haan (2001), and it includes taxes on capital income of individuals, taxes on corporate income, profits and capital gains as well as investment goods, and all forms of property taxation. Specifically, in terms of the tax categories of the OECD database, our broad capital tax ratio is calculated according to the formula:
In the formula, \(\alpha \) corresponds to the labor share of income, as reported in Penn World Table, Version 9.0, TotalTax denotes revenue from all tax categories, and Tax1100 denotes tax revenue from tax category 1100 while the same applies to the other terms in the numerator.
The effective average capital tax rate is calculated based on data from the OECD Revenue Statistics and the Penn World Table, Version 9.0. It corresponds to the ratio of revenue from several taxes levied on capital over a measure of capital income in a given year. The selection of taxes is based again on Volkerink and de Haan (2001). It includes the same taxes on capital income of individuals, taxes on corporate income, profits and capital gains as well as investment goods, and all forms of property taxation. Specifically, in terms of the tax categories of the OECD database, our effective average capital tax rate is calculated according to the formula:
\(\alpha \) denotes the labor share of income, as reported in Penn World Table, Version 9.0 and CapitalIncome is measured as the residual share \((1-\alpha )\) of nominal GDP. Tax1100 again denotes tax revenue from tax category 1100 and the same applies to the other terms in the numerator.
The top marginal corporate tax rate corresponds to the top statutory tax rate imposed by the central government of each country on corporate income excluding eventual surcharges on distributed profits. The data come from Oxford University’s Centre for Business Taxation Database (Centre for Business Taxation 2017). To maximize the coverage of the data we also interpolate missing values in the data based on a linear trend.
The effective marginal corporate tax rate is obtained also from Oxford University’s Centre for Business Taxation Database. These rates are computed following the methodology of Devereux et al. (2002) The coverage of the data is extended by interpolating missing values in the data based on a linear trend.
The narrow labor tax ratio is calculated based on data from the OECD Revenue Statistics and the Penn World Table, Version 9.0. It corresponds to the ratio of taxes on labor income of individuals over total tax revenue in a given year and it is given by the formula:
In the formula \(\alpha \) corresponds to the labor share of income, as reported in Penn World Table, Version 9.0, TotalTax denotes revenue from all tax categories, and \(Tax1100\ \)denotes tax revenue from tax category 1100, which is taxes on income, profits and capital gains of individuals.
The broad labor tax ratio is calculated based on data from the OECD Revenue Statistics and the Penn World Table, Version 9.0. It corresponds to the ratio of revenue from several taxes levied on labor over total tax revenue in a given year. The selection of taxes is based on Volkerink and de Haan (2001) and it includes taxes on labor income of individuals, taxes on security contributions of employees and employers, and all payroll and workforce taxes. Specifically, in terms of the tax categories of the OECD database, our broad labor tax ratio is calculated according to the formula:
In the formula \(\alpha \) corresponds to the labor share of income, as reported in Penn World Table, Version 9.0, TotalTax denotes revenue from all tax categories, and Tax1100 denotes tax revenue from tax category 1100 while the same applies to the other terms in the numerator.
The effective average labor tax rate is calculated based on data from the OECD Revenue Statistics and the Penn World Table, Version 9.0. It corresponds to the ratio of revenue from several taxes levied on labor over a measure of labor income in a given year. The selection of taxes is based again on Volkerink and de Haan (2001). It includes the same taxes on labor income of individuals, taxes on security contributions of employees and employers, and all payroll and workforce taxes, as in the broad labor tax ratio. Specifically, in terms of the tax categories of the OECD database, our effective average labor tax rate is calculated according to the formula:
\(\alpha \) denotes the labor share of income, as reported in Penn World Table, Version 9.0 and LaborIncome is measured the corresponding share \(\alpha \) of nominal GDP. \(Tax1100\ \)again denotes tax revenue from tax category 1100 and the same applies to the other terms in the numerator.
The narrow consumption tax ratio is calculated based on data from the OECD Revenue Statistics. It corresponds to the ratio of general taxes on goods and services over total tax revenue in a given year and it is given by the formula:
TotalTax denotes revenue from all tax categories and Tax5110 denotes tax revenue from tax category 5110, which is general taxes on goods and services.
The broad consumption tax ratio is calculated based on data from the OECD Revenue Statistics. It corresponds to the ratio of revenue from several taxes levied on consumption over total tax revenue in a given year. The selection of taxes is based on Volkerink and de Haan (2001), and it includes general taxes on goods and services, excise taxes, taxes on profits of fiscal monopolies, customs and import duties as well as taxes on specific services and use of goods. Specifically, in terms of the tax categories of the OECD database, our broad consumption tax ratio is calculated according to the formula:
TotalTax denotes revenue from all tax categories, and \(Tax5110\ \)denotes tax revenue from tax category 5110 while the same applies to the other terms in the numerator.
The effective average consumption tax rate is calculated based on data from the OECD Revenue Statistics and the Penn World Table, Version 9.0. It corresponds to the ratio of revenue from several taxes levied on consumption over a measure of private and public consumption spending in a given year. The selection of taxes is based again on Volkerink and de Haan (2001). It includes the same taxes, as in the broad consumption tax ratio, namely general taxes on goods and services, excise taxes, taxes on profits of fiscal monopolies, customs and import duties as well as taxes on specific services and use of goods. In terms of the tax categories of the OECD database, our effective average consumption tax rate is calculated according to the formula:
Here C and G denote private and public consumption spending in current prices, as reported in Penn World Table, Version 9.0. \(Tax5110\ \) again denotes tax revenue from tax category 5110 and the same applies to the other terms in the numerator.
The Gini coefficients are obtained from version 3.4 of the World Income Inequality Database (UNU-WIDER 2017). As for some countries the database reports multiple Gini coefficients from different sources for the same year, in these cases we take the average of the available values. To eliminate also gaps in the series, we also interpolate missing values based on a linear trend.
1.3 Section C: Additional regression results
This section provides additional regression results which were mentioned in the main text but with the details being omitted.
1.3.1 Robustness checks with additional controls
To assess the robustness of our main findings in this section, we document how the estimation results for our main specification change when we include in it a number of important additional controls. These controls include variables that are likely to influence the relationship between capital taxation and economic growth. For this exercise, we focus on the specification from Table 2 that we use most frequently in the paper which interacts the capital taxation measure with the low-income dummy. We estimate this specification separately for each of our three main capital taxation measures and in all cases we use our full sample of countries. The estimation results are presented in Table 7.
Columns 1, 4 and 7 present the estimation results when we include the Gini coefficient as an additional control. This allows us to account for the potential effect that income inequality may have on the relationship between capital taxation and economic growth. In all three columns, we see that the estimates for the Gini coefficient are negative and statistically significant. This suggests that a higher level of income inequality exerts a negative influence on rates of economic growth. Yet, even when controlling for that effect in all three columns we see that our finding remains intact. The baseline effect of capital taxation on growth remains positive for high-income countries and the interaction effect for low-income countries is in all cases negative and statistically significant.
Columns 2, 5 and 8, present the estimation results when we control for a measure of labor taxation. The exact measure of labor taxation that we employ in each of the three columns follows the respective measure of capital taxation. Thus, in column 2 we control for a narrow measure of the labor tax ratio, reflecting just personal income taxes of individuals, in column 5 we control for a broader labor tax ratio and in column 8 we control for the effective average rate of labor taxation. The exact description of all three measures is provided in “Section B” above.
In all three cases, we do not see that the inclusion of these controls dramatically alters our main findings. Moreover, the coefficient estimates that we obtain for our labor tax measure in columns 2 and 5 are statistically insignificant. Only in column 8, we see a clear negative and statistically significant relationship between the effective rate of labor taxation and economic growth, suggesting that high rates of labor taxation are growth retarding. Controlling for this effect slightly weakens the positive association between capital taxation and economic growth for high income countries and makes the corresponding one for low-income countries more negative. Yet, qualitatively it does not alter our main finding.
Columns 3, 6 and 9, present the estimation results when we control for a measure of consumption taxation. Again in this case, we use three measures of consumption taxation that match with our employed measures of capital taxation. In column 3, we control for a narrow consumption tax ratio, reflecting just general taxes on good and services, in column 6 we control for a broader consumption tax ratio, and in column 9 we control for the effective average rate of consumption taxation.
In parallel to the results that we obtain for labor taxation, we find the estimates for both the narrow and the broad consumption tax ratio to be statistically insignificant and not to change the estimates for main regressors. However, for the effective rate of consumption taxation we find it to be positively associated with growth rates. Controlling for this effect, as can be seen, slightly strengthens the positive association between capital taxation and economic growth for high-income countries and makes it more negative for low-income countries. Qualitatively, though, it does not alter our main findings.
Beyond controlling for these variables, in regressions that we do not report here, we have also checked how our estimation results are potentially affected by the inclusion of other related variables. In particular, we have considered the role of political institutions, proxied by a country’s polity score, the role of economic institutions, proxied by the ICRG quality of governance index, and the role of a country’s level of economic freedom, proxied by Heritage Foundation’s economic freedom index. In all cases, however, we found the coefficient estimates for these additional variables to be statistically insignificant and their inclusion not to alter our findings in any important way.
1.3.2 Robustness checks with alternative thresholds
As a further check on our main findings, in this subsection we also explore how our estimation results change when we consider alternative threshold effects that go beyond the simple low-income dummy on which we focus in most of our regression tables. Specifically, for our main specification with the binary threshold dummy we consider three alternative dummies separating our sample of countries based on (a) their share of total tax revenue in GDP, (b) their effective average rate of labor taxation, and (c) their effective average rate of consumption taxation. As in the previous subsection, we perform this robustness check for all three main measures of capital taxation.
For the purpose of this estimation, we follow the same approach as with the estimation of the threshold for our main regression specification. This means that we first estimate a threshold regression for our balanced sub-sample where we allow the effect of capital taxation to vary with each country’s share of total taxation in GDP, its effective labor taxation rate and its effective consumption taxation rate. Based on the estimated threshold value, we construct a dummy variable for our full sample of countries and explore whether the effect of capital taxation on growth varies for countries above and below that threshold.
The resulting estimates, presented in Table 8, provide some evidence that the heterogeneity in the effect of capital taxation on growth across countries is linked with their tax structure. In all cases, we find the estimated interaction effects to be negative. Yet, only in the case of the dummy variables based on total taxation and labor taxation we find a statistically significant interaction term with any of our three main measures of capital taxation. Specifically, the estimation results suggest that an increase in capital taxation tends to have a positive effect on growth in countries where overall taxation is high and where the effective rate of labor taxation is relatively high. For the effective rate of consumption taxation, though, we do not find clear evidence that it influences the relationship between capital taxation and economic growth. These results imply that a shift of the tax burden toward capital can indeed be beneficial particularly in countries where the tax burden is already high and labor is taxed at high rates.
1.4 Section D: Model derivations and proofs
This section presents the derivations for the stationary equilibrium of our model and the proofs omitted from the main text.
1.4.1 Determination of stationary equilibrium
In the stationary equilibrium of our model economy variables \(\{A_{t} ,K_{t},Y_{t},C_{t},D_{t},\Pi _{t},w_{t}\}\) grow at a balanced rate, variables \(\{L_{t},r_{t},\mu _{t},a_{t}\}\) are constant, variables \(\{\tau ^{k},\tau ^{l},\tau ^{\pi },G_{0}\}\) are fixed by policy and variables \(\{a_{0} ,A_{0},K_{0}\}\) are predetermined. In order to fully characterize the equilibrium, we first solve for the constant equilibrium value of \(L_{t},\) the constant per effective worker values of \(\{k_{t},y_{t},c_{t}\},\) where \(x_{t}\equiv \frac{X_{t}}{A_{t}L_{t}},\) and the long-run growth rate \(g^{*}\) which equals the rate of productivity growth. The key equations to determine these values are (13), (17), (18), (19) and (21) and (20). The remaining endogenous variables can be determined by (14), (7) and (9). Dividing both sides with \(A_{t}L_{t},\) (13) can be simply rewritten as:
Similarly manipulating (17) and (18) noting (14) leads to,
Finally, substituting \(G_{t}=A_{t}G_{0}\) in both (19) and (21), noting again (14) and rewriting the resulting expressions in per effective worker terms we obtain:
Eliminating the ratio \(\frac{A_{t+1}}{A_{t}}\) from both (24) and (27) based on (20) allows us to determine the equilibrium values of \(\{k_{t},y_{t},c_{t}\}\) and \(L_{t}\) given \(G_{0}.\) Substituting these values in (20) pins down the long-run growth rate.
1.4.2 Proof of Lemma 1
The proof follows as in Aghion et al. (2013). In a stationary equilibrium with balanced growth, it must be that consumption makes up a constant share of output. Letting \(c_{t}=\rho y_{t},\) noting that \(\delta =1\) and replacing \(c_{t+1}\) and \(c_{t}\) in (24) we get that: \(k_{t+1}\frac{A_{t+1}L_{t+1}}{A_{t}L_{t}}=\beta (1-\tau ^{k})\frac{\alpha }{\eta }y_{t}.\) We then substitute the resulting expression into (27) together with (26). Similar algebraic manipulation of the resulting equation, letting \(c_{t}=\rho y_{t}\) and noting that \(\delta =1,\) yields: \(\rho =1-\frac{\alpha }{\eta }(\eta -1+\beta )-\frac{\alpha }{\eta }(1-\beta )\tau ^{k}-(1-\alpha )\tau ^{l}.\)
Letting \(c_{t}=\rho y_{t}\) in (25) and solving the resulting expression for \(L_{t}\) yields: \(L^{*}=[\frac{(1-\alpha )(1-\tau ^{l})}{\omega \rho }]^{\frac{1}{1+\psi }}.\) Using again expression \(k_{t+1}\frac{A_{t+1}L_{t+1}}{A_{t}L_{t}}=\beta (1-\tau ^{k})\frac{\alpha }{\eta }y_{t}\) noting the constancy of \(L_{t}\) and that \(\frac{A_{t+1}}{A_{t} }=1+g^{*}\) we obtain \(k^{*}=(\frac{\alpha }{\eta }\frac{\beta (1-\tau ^{k} )}{1+g^{*}})^{\frac{1}{1-\alpha }}.\) The equilibrium value of \(y^{*}\) follows directly from (23). \(\square \)
1.4.3 Proof of Lemma 2
The proof also follows as in Aghion et al. (2013). Under the assumption that \(\eta \ge 1+\gamma \) we can treat the long-run growth rate of the economy, \(\bar{g},\) as a function of \(\eta \) with \(\bar{g}(\eta )=\alpha \frac{(\eta -1)^{2}}{\eta }\Phi (G_{0})^{\varphi }[\bar{k}(\eta )]^{\alpha }\bar{L} (\eta ).\)Here \(\bar{L}(\eta )=\{\frac{(1-\alpha )(1-\tau ^{l})}{\omega [1-\frac{\alpha }{\eta }(\eta -1+\beta )-\frac{\alpha }{\eta }(1-\beta )\tau ^{k}-(1-\alpha )\tau ^{l}]}\}^{\frac{1}{1+\psi }}\) and \(\bar{k}(\eta )\) is implicitly defined by \(\bar{k}[1+\alpha \frac{(\eta -1)^{2}}{\eta }\Phi (G_{0})^{\varphi }(\bar{k})^{\alpha }\bar{L}(\eta )]=\beta (1-\tau ^{k} )\frac{\alpha }{\eta }(\bar{k})^{\alpha }.\) Taking a second-order Taylor approximation of \(\bar{g}(\eta )\) around \(\eta =1\) implies that \(\bar{g} (\eta )\approx \bar{g}(1)+(\eta -1)\frac{\mathrm{d}\bar{g}}{\mathrm{d}\eta }|_{\eta =1}+\frac{(\eta -1)^{2}}{2}\frac{d^{2}\bar{g}}{\mathrm{d}\eta ^{2}}|_{\eta =1}.\) Noting that \(\bar{g}(1)=0,\)\(\frac{\mathrm{d}\bar{g}}{\mathrm{d}\eta }|_{\eta =1}=0\) and \(\frac{d^{2}\bar{g} }{\mathrm{d}\eta ^{2}}|_{\eta =1}=2\alpha \Phi (G_{0})^{\varphi }[\alpha \beta (1-\tau ^{k})]^{\frac{\alpha }{1-\alpha }}\{\frac{(1-\alpha )(1-\tau ^{l})}{\omega [1-\alpha \beta -\alpha (1-\beta )\tau ^{k}-(1-\alpha )\tau ^{l}]}\}^{\frac{1}{1+\psi }}\) yields the expression of interest. \(\square \)
1.4.4 Proof of Proposition 3
To establish the first part of the proposition, use Eq. (26) to solve for \(\tau ^{l}\) as an implicit function \(\tau ^{k}.\) Applying the implicit function theorem, compute \(\frac{\mathrm{d}\tau ^{l} }{\mathrm{d}\tau ^{k}}\) and note that \(\lim _{\tau ^{k}\longrightarrow 0}\frac{\mathrm{d}\tau ^{l} }{\mathrm{d}\tau ^{k}}=\frac{-\alpha (1-\alpha )(1-\beta )\tau ^{l}-\alpha (1+\eta )(1-\tau ^{l})[1-\alpha \beta -(1-\alpha )\tau ^{l}]}{(1-\alpha )(1+\eta )[1-\alpha \beta -(1-\alpha )\tau ^{l}]}<0.\) Differentiating Eq. (22) with respect to \(\tau ^{k}\), while treating \(\tau ^{l}\) as a function of \(\tau ^{k}\) yields:
Taking the limit of \(\frac{\mathrm{d}\bar{g}}{\mathrm{d}\tau ^{k}}\) as \(\tau ^{k}\longrightarrow 0\) and using the above derived expression for \(\lim _{\tau ^{k}\longrightarrow 0}\frac{\mathrm{d}\tau ^{l}}{\mathrm{d}\tau ^{k}}\) implies that \(\mathrm{sign}\{\frac{\mathrm{d}\bar{g}}{\mathrm{d}\tau ^{k} }|_{\tau ^{l}}\}=\mathrm{sign}\{G(\tau ^{l})\}\) where \(G(\tau ^{l})\equiv (1+\eta )[1-\alpha \beta -(1-\alpha )\tau ^{l}][\alpha (1-\alpha )(1-\beta )^{2}\tau ^{l}-(1-\tau ^{l})]+(1-\beta )(1-\tau ^{l}).\) As \(G^{\prime }(\tau ^{l} )>0,\ \)while \(G(0)<0\) and \(G(1)>0,\) there exists \(\hat{\tau }^{l}\in (0,1)\) such that if \(\tau ^{l}>\hat{\tau }^{l}\) then \(\lim _{\tau ^{k}\longrightarrow 0} \frac{\mathrm{d}\bar{g}}{\mathrm{d}\tau ^{k}}>0.\)
To establish the second part of the proposition, use Eq. (26) to solve for \(G_{0}\) and replace in Eq. (22). Differentiating Eq. (22) with respect to \(\tau ^{k}\), while treating \(\tau ^{l}\) as a constant yields:
Taking the limit of \(\frac{\mathrm{d}\bar{g}}{\mathrm{d}\tau ^{k}}\) as \(\tau ^{k}\longrightarrow 0\) and simplifying the resulting expression leads to \(\mathrm{sign}\{\frac{\mathrm{d}\bar{g}}{\mathrm{d}\tau ^{k}}|_{G_{0}}\}=\mathrm{sign}\{H(\tau ^{l})\}\) with \(H(\tau ^{l})\equiv \varphi [(1-\alpha \beta )+\eta (1-\alpha \beta )-(1+\eta )(1-\alpha )\tau ^{l}]-\tau ^{l}(1+\varphi )[\alpha +\beta +\eta (1-\alpha \beta )-(1+\eta )(1-\alpha )\tau ^{l}].\) Let \(\tilde{\tau }^{l}\) be the value for which \(H^{\prime }(\tilde{\tau }^{l})=0.\) As \(H^{\prime }(0)<0,\) then \(\tilde{\tau }^{l}>0.\) As \(H(0)>0,\) then it must be that \(\lim _{\tau ^{k}\longrightarrow 0}\frac{\mathrm{d}\bar{g}}{\mathrm{d}\tau ^{k}}|_{G_{0}}>0\) for all \(\tau ^{l}<\tilde{\tau } ^{l}\). \(\square \)
Rights and permissions
OpenAccess This article is distributed under the terms of the Creative Commons Attribution 4.0 International License (http://creativecommons.org/licenses/by/4.0/), which permits unrestricted use, distribution, and reproduction in any medium, provided you give appropriate credit to the original author(s) and the source, provide a link to the Creative Commons license, and indicate if changes were made.
About this article

Cite this article
Kate, F.t., Milionis, P. Is capital taxation always harmful for economic growth?. Int Tax Public Finance 26, 758–805 (2019). https://doi.org/10.1007/s10797-019-09530-3
Published:
Issue Date:
DOI: https://doi.org/10.1007/s10797-019-09530-3