
Abstract
Drawing bar diagrams has been shown to improve performance on mathematical word problems wherein the relational keyword is consistent with the required arithmetic operation. This study extends this by testing the effectiveness of bar diagram drawing for word problems with an inconsistent keyword-arithmetic operation mapping. Seventy-five fifth graders solved consistent and inconsistent word problems while encouraged to draw bar diagrams. For each word problem, we assessed problem type (consistent/inconsistent), performance (correct/incorrect), and bar diagrams (accurate/inaccurate/no drawing). Overall, bar diagram drawing was associated with increased performance on both consistent and inconsistent word problems, but the strongest benefits of drawing were found for inconsistent word problems. For inconsistent word problems, bar diagram accuracy was more clearly related to performance (accurate bar diagrams related to correct answers, but inaccurate ones to incorrect answers) than for consistent word problems. We conclude that bar diagram drawing provides an effective graphical support for solving inconsistent word problems.
Contemporary mathematics education increasingly relies on word problem-solving (Boonen et al., 2016). Word problems are mathematical exercises describing real-life situations in connected text of a few sentences to a paragraph in length instead of in mathematical notation (Rasmussen & King, 2000; Timmermans et al., 2007). Notwithstanding the assumed benefits of word problems regarding students’ motivation and connection with realistic contexts and personal experiences (e.g., van den Heuvel-Panhuizen, 2003), a significant number of students struggle, or even fail, to accurately solve word problems (e.g., De Koning et al., 2017; van der Schoot et al., 2009). Consequently, researchers have started to develop and test remedying problem solving strategies and instructional approaches that offer textual guidance (e.g., De Koning et al., 2017) or serve as graphical aids (e.g., Dewolf et al., 2017). In the present study, we focus on one specific type of graphical approach that has recently attracted a considerable amount of attention from researchers and educational practitioners: the model method. Specifically, our aim was to investigate whether model method drawing supports problem solving performance to a similar extent in word problems that differ in their consistency (i.e., relational term consistent vs. inconsistent with the required mathematical operation).
1 The model method
The model method is a graphical approach for supporting word problem-solving that originated in Singapore as part of the primary mathematics curriculum reform (Kho, 1987; Ng & Lee, 2009) and is increasingly used in various other countries worldwide such as the Netherlands (Kaur, 2019). The core feature of the model method is that children are taught to draw a bar diagram to represent the known and unknown mathematical quantities, as well as their relations, of a word problem (Kho, 1987; Ng, 2004). Specifically, children are encouraged to graphically depict the problem situation that is hidden in the word problem text by representing the relationship(s) among the quantities externally in the form of rectangles. So, all information explicitly or implicitly presented in the word problem is captured in a series of rectangles (i.e., a bar diagram) where each rectangle represents a different variable (and its quantity) from the word problem. The bar diagram thereby serves as a “visual analogue” (Ng & Lee, 2009, p. 62; also see Ng & Lee, 2005) in that it contains all relevant variables, quantities, and relations from a word problem that are needed to solve the word problem. In this sense, the model method targets what is most fundamental for the word problem solution, namely constructing a representation of the situation described in the word problem (e.g., De Corte et al., 1985; Ng & Lee, 2009). Prior research has indeed shown that the model method is a powerful graphical strategy to support word problem solving in various types of word problems including algebraic routine problems (Ng & Lee, 2009), arithmetic routine problems (Ng & Lee, 2005), and non-routine problems (Ho & Lowrie, 2014) as well as for different types of learners including those with learning disabilities (Sharp & Dennis, 2017) and lower mathematical skills (Goh, 2009; Poh, 2007).
2 The model method focuses on consistent word problems
Interestingly, so far, prior research on the use (by students and teachers) and instructional effectiveness of the model method has been characterized by an exclusive focus on consistent word problems (e.g., Lee, Khng, Ng, & Ng Lan Kong, 2013; Ng & Lee, 2005, 2009) while ignoring their inconsistent counterparts (for example, of consistent and inconsistent word problems, see Table 1). In consistent word problems, the required mathematical operation can be derived straightforwardly from the word problem because the words used in the word problem steer towards the mathematical operation that is needed to solve the problem. Look, for example, at Table 1 which shows a compare word problem, one of the most well-known types of word problems in which the consistency of the language used in a word problem is investigated. In a compare word problem, one needs to compute the quantity of a variable by comparing the information given about the relative magnitude of two quantities where one variable serves as the referent set and another variable as the comparison set (Boonen et al., 2016; De Koning et al., 2017; Verschaffel et al., 1992). For the consistent compare problem, the relational keyword “less than” is used to indicate the comparative relationship between the (quantities of) variables in the first and second sentences and is consistent in that the relational keyword in the second sentence aligns with the required mathematical operation which is addition. For solving consistent compare problems, the problem solver simply can rely on the numbers and the comparative keyword(s) given in the text to compute the answer. There is no need to internally or externally represent the described problem situation capturing all solution-relevant elements to come to the correct answer.
In inconsistent word problems, the required mathematical operation cannot directly be derived from the word problem text because the language used in the word problem steers towards an inappropriate mathematical operation. To illustrate, in the inconsistent compare word problem presented in Table 1, “less than” primes a subtraction operation while an addition operation is required. This has to do with the pronominal reference (That is…) at the beginning of the second sentence which refers back to the quantity expressed in the first sentence and thus requires a reversal of the arithmetic operation that needs to be performed. In this case, a correct solution to the word problem requires the problem solver to engage in additional cognitive processing conducive to the construction of a mental representation of the problem situation (Hegarty et al., 1995; Kintsch & Greeno, 1985). Especially Kintsch and Greeno’s (1985) schema theory sheds helpful light on how the language consistency of word problems relates to mental representation processes. According to this theory, the key to solving a word problem is to translate the problem statement into a mental representation of the base type of mathematical situation that is embedded in the problem (and on the basis of which the required arithmetic operations can be planned and executed). To build an effective mental representation, problem solvers above all need to derive the correct relations between the solution-relevant elements from the text base of the word problem. In doing so, they have to utilize top-down comprehension processes to organize the text base, exclude irrelevant information, infer missing information, and most relevantly here, deal with inconsistent relational statements (Kintsch & Greeno, 1985). If problem solvers do not sufficiently engage in these cognitive processes when constructing a mental representation of the situation described in the word problem or do not construct a mental representation at all, and therefore do not reverse the addition operation to the subtraction operation, they commit a reversal error and most likely will solve the word problem incorrectly (Lewis & Mayer, 1987; Schumacher & Fuchs, 2012).
A robust finding in word problem-solving research that is relevant here is that word problems containing consistent language are solved correctly more often than those with inconsistent language (i.e., consistency effect, Lewis & Mayer, 1987; van der Schoot et al., 2009). Connecting this to the model method research conducted so far, it appears that past studies involving compare word problems, such as those by Lee et al. (2013) and Ng and Lee (2005, 2009), and other types of word problems (e.g., fraction problems; Sharp & Dennis, 2017), did not yet test the efficacy of the model method for solving inconsistent word problems even though inconsistent problems in particular may benefit from additional support to accurately represent and solve the word problem.
Also at the theoretical level, no explicit attention is given to the suitability of the model method to provide representational support for solving inconsistent word problems: “The theoretical model we present is for consistent-language compare word problems that require the construction of a single model drawing….” (Ng & Lee, 2009, p. 289/290). According to this theoretical model, which draws on the above discussed processing model for word problem solving by Kintsch and Greeno (1985), solving word problems with the model method consists of three phases. In the text phase, the text presented in the word problem is read with the aim to identify the variables, quantities, and relations that are given as well as what is unknown and is to be found. For the consistent word problem presented in Table 1, this would mean that the store names, prices, and relational keyword are identified. In the structural phase, the text information is represented graphically in the form of rectangles where each rectangle represents a specific piece of information identified in the text (e.g., quantity of 45 euros for the variable jeans at the store Bijenkorf). Hence, there is continuous coordination between the text phase and the structural phase: if one piece of information is represented (e.g., step 1: top rectangle in Fig. 1 representing the price at Bijenkorf), one returns to the text for representing the next piece of information (e.g., step 2: bottom rectangle in Fig. 1 representing the price at C&A). The comparative relation between the two variables in a compare word problem is used to determine how to draw the two rectangles. For example, for the consistent word problem depicted in Table 1, the relational keyword “less than” makes that the quantity of the second variable is smaller (expressed as a shorter rectangle) than that of the first variable (expressed as a longer rectangle), as is illustrated in Fig. 1. The structural phase is completed if all pieces of information are combined into a series of rectangles (i.e., bar diagram). In the procedural-symbolic phase, the bar diagram drawn in the previous phase is used as a basis to formulate the mathematical equation that needs to be solved and the mathematical operations are carried out to solve the problem. Together, the theoretical model assumes that going through these three phases in an iterative manner to graphically depict the word problem helps to represent and solve consistent word problems.
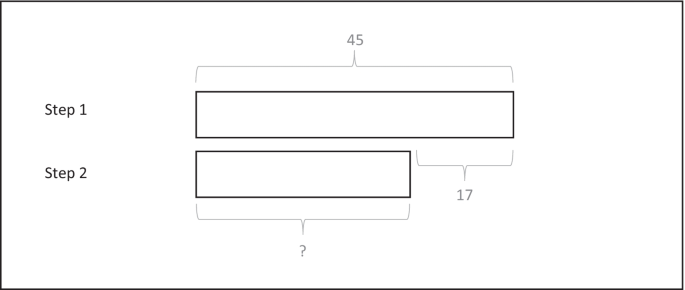
Bar model drawing accurately representing the relations of the consistent word problem presented in Table 1
3 Extending the model method to inconsistent word problems
Although one might be tempted to assume that what works for consistent word problems will probably also work for inconsistent word problems, previous research has indicated that the same instructional support may impact consistent and inconsistent word problems differently (e.g., De Koning et al., 2017). Based on the assumptions of the abovementioned theoretical account, the continuous interactions between one’s thought processes and drawing using the model method might be especially helpful for solving inconsistent word problems: the solution-relevant elements identified in the text (text phase) form the basis for the drawing process, while engaging in model method drawing in turn helps problem solvers to reflect on the problem situation (structural phase) such that it reshapes one’s interpretation of the word problem, helps to see through relations that they were not aware of before, encourages them to consider additional pieces of information, and things alike (all text phase), which is then again externalized in a revised drawing (construction phase). In other words, graphically representing the word problem text influences one’s cognitive representation of the problem situation and hence the mathematical operation that one considers appropriate for the word problem.
In case of inconsistent word problems, this would mean that model method drawing would serve a crucial function in that it helps the problem solver to re-analyze and critically reflect on the word problem text. Such cognitive consequences of having to graphically externalize the solution-relevant elements and their relations are thought to support the representation process (cf. van Meter, Aleksic, Schwarz, & Garner, 2006) and are therefore likely to contribute to the realization that in an inconsistent compare word problem, the comparative keyword steers towards an inappropriate mathematical operation. These interactions between drawing and cognitive processing are supposed to help problem solvers to reverse the comparative keyword to an appropriate arithmetic operation and hence to arrive at the correct solution on inconsistent word problems. If we apply this to the inconsistent word problem presented in Table 1, problem solvers first identify the relevant elements in an inconsistent word problem and then graphically represent the variable presented in the first sentence in a bar diagram (see Fig. 2, step 1). Subsequently, they use the textual information and the drawing to determine how to mentally and graphically represent the variable presented in the second sentence in relation to the first variable. If this processing results in the realization that the relational keyword “less than” needs to be reversed to an addition operation, a longer rectangle is drawn for the second variable (see Fig. 2, step 2).
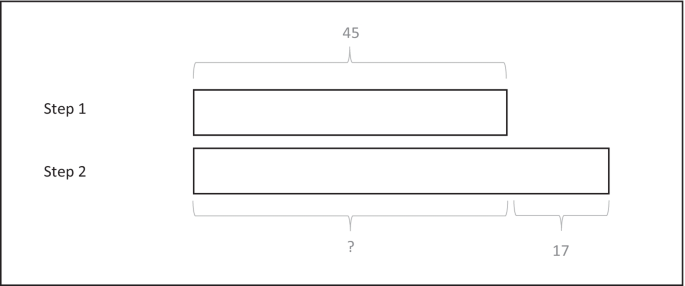
Bar model drawing accurately representing the relations of the inconsistent word problem presented in Table 1
The above is in line with previous research showing that self-generated drawing has a positive effect on mathematics performance for tasks like word problem solving (e.g., Boonen et al., 2016) and solving mathematical modelling problems (e.g., Rellensman, Schukajlow & Leopold, 2020). Comparable beneficial effects of drawing have been reported outside the mathematical domain such as in the comprehension of science topics from text (e.g., Schwamborn et al., 2010). Recent lines of research on the role of drawing in word problem-solving have focused on various aspects related to drawing such as the effects of strategic knowledge about drawing (i.e., students’ views on the characteristics of a drawing that fit a given problem), the type of drawing (e.g., situational vs. mathematical; number lines, diagrams), and the accuracy of drawing (i.e., the correctness of representation of the relevant objects and relations, including the correct labeling of the drawing with numbers) on word problem solving performance (e.g., Chu et al., 2017; Csíkos et al., 2012; Gvozdic & Sander, 2020; Krawitz & Schukajlow, 2020; Munez et al., 2013; Ott, 2020; Rellensmann et al., 2019, 2020). For the present study, particularly, the research on the accuracy of drawing is relevant as this work shows that benefits of drawing for word problem solving are strongly related to the accuracy of the drawing with more accurate drawings correlating with better word problem solving performance (e.g., De Bock et al., 1998).
Also in using the model method, the drawing of accurate bar diagrams appears crucial for word problem-solving performance. Yan (2002) and Ng and Lee (2009), for example, demonstrated that the errors students made in solving word problems were less likely to arise from computational problems (cf. De Corte et al., 1985), but rather were due to students experiencing problems with drawing an accurate bar diagram. Particularly, problems with understanding the word problem, determining the solution steps with help of the model method, and deciding what the correct model is to be drawn, should be have been indicated as hindrances to solving word problems (Goh, 2009; Ng & Lee, 2009). This makes clear that understanding the relations between the different pieces of information and drawing an accurate bar diagram that corresponds to this are critical for the model method to be successful, although it does not guarantee that a correct answer is given (Ho & Lowrie, 2014). Given that such relational processing is most relevant for solving inconsistent word problems, it seems plausible that the accuracy of the drawn bar diagram is most critical in inconsistent word problems. In consistent word problems, a correct answer may be given without drawing a (correct) bar diagram as the appropriate mathematical procedure can be read off directly from the problem text and the construction of a representation is not a prerequisite (Hegarty et al., 1995). In other words, drawing no or an inaccurate bar diagram likely hinders word problem-solving performance most in inconsistent word problems. By taking into account both consistent and inconsistent word problems as well as the accuracy of the drawn bar diagram, the present study contributes to better understanding of the use and effectiveness of the model method and extends previous research on (accuracy of) drawing in word problem solving (e.g., Krawitz & Schukajlow, 2020).
4 The present study
In this study, we addressed the question of whether the positive effects of bar model drawing on consistent compare word problem performance can also be found for inconsistent compare word problems. The study was conducted among fifth-grade primary school children who attended a school that used the model method as an instructional approach in their mathematics curriculum. The children completed a set of consistent and inconsistent compare word problems and they were encouraged to use the model method while they solved the word problems. Both the word problems and the drawn bar diagrams were scored for accuracy. Given that prior research has indicated a positive influence of model method drawing on solving consistent word problems (e.g., Ng & Lee, 2009), we expected that drawing a correct bar diagram would be positively associated with problem-solving performance on consistent word problems and would yield a slightly higher number of correctly solved consistent word problems than when no or an inaccurate bar diagram was drawn. For inconsistent word problems, we expected the accuracy of the drawn bar diagram to have a more pronounced influence. Assuming that drawing a bar diagram supports one’s understanding of the problem situation described in the word problem text, a relatively higher number of accurate bar diagrams than inaccurate bar diagrams or no bar diagrams were expected and these accurately drawn bar diagrams were expected to be more likely associated with a correct answer on an inconsistent word problem than when drawing no or an inaccurate bar diagram.
5 Method
5.1 Participants
The participants were 75 fifth-grade children (46 boys, Mage = 9.70 years, SDage = 0.03; 29 girls, Mage = 9.83 years, SDage = 0.35) from three regular primary schools located in the Netherlands. The participating schools used the instructional method Rekenwonders for teaching mathematics; this method is the only Dutch mathematics method that uses the model method as the core problem-solving approach in mathematics instruction. This means that all participating children were familiar with schematically representing mathematical exercises according to the model method and had experience using it for solving mathematical tasks. All children participated voluntarily and received a small gift as an appreciation for their participation. Children’s parents provided informed consent based on printed information about the purpose of the study.
5.2 Materials
The inconsistency task was used for assessing word problem-solving performance. This task is a well-established and frequently used instrument for measuring one’s proficiency in solving arithmetic word problems (Daroczy et al., 2015). The inconsistency task used in this study contained 24 one-step compare word problems (available at https://osf.io/fnxzj/) that were based on van der Schoot et al. (2009). Each compare word problem was presented in Dutch and consisted of three sentences. The first sentence presented an assignment statement in which the value of the first variable was expressed (e.g., At the Bijenkorf, a sweater costs 45 euros.). The second sentence contained a relational statement expressing the value of the second variable in relation to the first variable (e.g., At the C&A, a sweater costs 17 euros less than at the Bijenkorf). The third sentence asked participants to indicate the price of the second variable (e.g., How much will you pay at C&A?).
In half of the compare word problems (i.e., 12 problems), the relational keyword used in the second sentence (“more/less than”) was consistent with the required mathematical operation, whereas in the other half, the relational keyword was inconsistent with it. In consistent compare word problems (see Table 1), the relation between the values of the first and second variables is explicitly and unambiguously indicated in the first two sentences. This makes that the relational keyword in the second sentence (e.g., less than) primes the appropriate arithmetic operation (e.g., subtraction). In inconsistent compare word problems (see Table 1), the second sentence contains a pronominal reference relating the value of the second variable to the value of the first variable from the first sentence (e.g., That is 17 euros less than at the C&A). Hence, in inconsistent compare word problems, the relational keyword (e.g., less than) primes an inappropriate arithmetic operation (e.g., subtraction) instead of the required arithmetic operation (e.g., addition).
To ensure comparability across all compare word problems, we applied several rules derived from prior research (e.g., Boonen et al., 2016; De Koning et al., 2017; van der Schoot et al., 2009). The rules were tailored to our sample in consultation with the children’s teachers so that all compare word problems could be solved by every child. This was done to reduce the possibility that the execution of the required arithmetic operations would be a determining factor in students’ word problem solving. This resulted in the following rules: (1) answers to each problem always required a subtraction or addition operation, (2) answers and numerical values in the problems contained no fractions or negative numbers, (3) numerical values occurred only once in the same problem, (4) answers to each problem were between 13 and 75, and (5) numerical values in consistent and inconsistent word problems were matched for magnitude.
Three versions of paper-and-pencil booklets were created that each contained 24 (12 consistent, 12 inconsistent) compare word problems. Each page of the booklet contained (1) one compare word problem followed by a text box in which participants could write their answer (top half of the page) and (2) an empty box in which participants could draw their schematic representation (i.e., bar model) of the compare word problem (bottom half of the page). In all three versions, the problems were presented in a random order while taking into account that problems of the same type were not presented more than two times consecutively. The versions differed in the order in which the problems were presented. The internal consistency of the inconsistency task (all consistent and inconsistent word problems together) as used in the present study was high (Cronbach’s α = 0.87).
5.3 Procedure
The experiment took place in the children’s classroom at their school and was conducted by three trained research assistants in a single session. The research assistants told the children that they were expected to complete a booklet of arithmetic word problems. They verbally instructed the children to complete the problems as they would normally do and encouraged them once to schematically represent each problem by drawing a bar model in the indicated box to help them solve that problem (note that the word problem booklet did not contain additional drawing prompts). There was no practice with drawing because children were already familiar with bar model drawing from their regular lessons. It was explicitly mentioned that their word problem-solving performance would not be graded, but that they still should try to perform to the best of their abilities. After having placed the children’s desks in a test situation (all desks separated from each other, lined up in separate rows), the booklets were distributed. After all children had received a booklet (one of the three randomly assigned versions) and had filled out their demographic information (i.e., age, gender) on the first page, they were told to start solving the problems. Children were given 60 min to individually complete the booklet and could do something for themselves (e.g., reading, drawing) when they were done. At the end of the experiment, all booklets were collected and children were given a small gift.
5.4 Data-analysis
For each compare word problem in the inconsistency task, it was known whether it was a consistent or inconsistent word problem because of the “word problem type” (consistent vs. inconsistent; an independent variable in the study). Each word problem was additionally scored for the following aspects: (1) word problem performance (the dependent variable), which was determined by indicating for each word problem whether the provided answer was correct (yielding 1 point) or incorrect (yielding 0 points), and (2) bar diagram (the second independent variable in the study), which was determined for each word problem by categorizing the drawing as “no bar diagram”, “accurate bar diagram”, or “inaccurate bar diagram”. The category “no bar diagram” was assigned if no drawing was made for solving the compare word problem. A drawing was categorized as “accurate bar diagram” if a complete bar diagram was drawn in which all values and relations expressed in the compare word problem were correctly represented. If a bar diagram drawing incorrectly represented (or missed) one or more values and/or relations, it was coded as an “inaccurate bar diagram”. Please note that we did not subdivide further into number and type of errors within this category as we were primarily interested in the accuracy of the drawn bar diagrams and wanted to avoid ending up with (too) many categories containing just a few instances of bar diagram drawings that would be difficult to interpret. For the scoring of (1) and (2), there were no missing values. A randomly selected subset of 50 bar diagram drawings was coded by two independent raters. Given that the inter-rater reliability of these coded drawings was high (Cohen’s Kappa [κ] = 0.96), the remaining bar diagram drawings were coded by one rater.
We ran multilevel logistic regressions using the lme4 R-package (Bates et al., 2015) to see how word problem type, bar diagram, and the interaction between word problem type and bar diagram were related to word problem performance, while correcting for nesting within students. Specifically, we ran (1) an intercept only model to determine the amount of variability between participants in word problem performance, (2) a model with the main effects of bar diagram and word problem type on word problem performance, and (3) a model with the main effects of bar diagram and word problem type as well as their interaction. In these analyses, word problem type was a dummy variable (0 = consistent, 1 = inconsistent) and bar diagram was included using two dummies that compare an inaccurate drawing to the no drawing condition (dummy 1) and an accurate drawing against no drawing (dummy 2). In multilevel logistic regression models, R-squared can be defined in different ways due to the presence of multiple variance components. Here we use the pseudo-R-squared as implemented by Nakagawa and Schielzeth (2013) which gives an estimate of the total variance explained on all levels in the model. This statistic should be interpreted with caution, however, since there is no proper estimator for explained variance in multilevel logistic regression models that works well all the time and for all purposes. Pairwise comparisons between all possible conditions were corrected for inflated type I error rates using the Sidak correction to prevent inflated type I error rates. All analyses were run in R version 3.6.1 (R Core Team, 2019); see https://osf.io/fnxzj/ for the annotated R code.
6 Results
6.1 Descriptive information
Participants produced a bar diagram drawing in 904 (50.99%) out of the total number of 1773 word problems: 644 (71.23%) were identified as an accurate bar diagram drawing and 260 (28.77%) were categorized as an inaccurate bar diagram drawing. The category “no bar diagram drawing” contained 869 cases (49.01%). For consistent word problems, out of the 889 consistent word problems in 453 (50.98%) of the cases, a bar diagram was drawn, whereas in 436 (49.04%) of the cases, no bar diagram was drawn. If a bar diagram was drawn, in 385 (84.99%) of the cases, an accurate bar diagram was drawn, whereas in 68 (15.01%) of the cases, an inaccurate bar diagram was produced. For inconsistent word problems, out of the 884 inconsistent word problems in 451 (51.02%) of the cases, a bar diagram was drawn, whereas in 433 (48.98%) of the cases, no bar diagram was drawn. If a bar model was drawn, in 259 (57.43%) of the cases, an accurate bar model was drawn, but in 192 (42.57%) cases, an inaccurate bar diagram was produced. Participants’ performance on each consistent and inconsistent compare word problem (i.e., correct vs. incorrect) subdivided into the type of bar diagram drawing they had produced (i.e., none, accurate, inaccurate) for that compare word problem is depicted in Fig. 3.
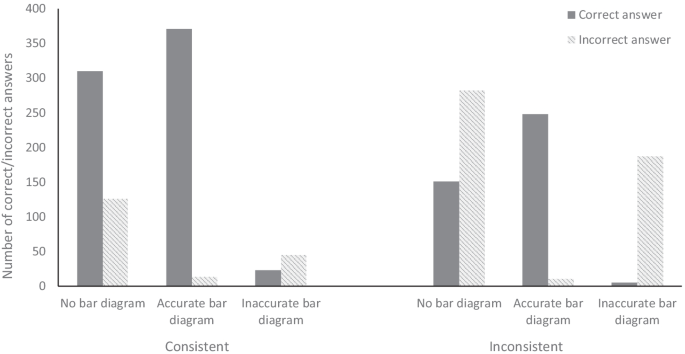
Number of correctly and incorrectly solved consistent (left) and inconsistent (right) word problems in each bar diagram category (no, accurate, inaccurate)
6.2 Statistical testing
An intercept only model showed that 26.7% of the total variance in accuracy of word problem solving was on the student level. The pseudo-R2 of this model is equal to 0.27.
Next, we ran the main effects model to test the overall effect of word problem type and bar diagram on word problem performance. Results showed that there was a significant effect of word problem type with fewer correct answers being given on inconsistent word problems than on consistent word problems, b = − 1.93, se = 0.162, p < 0.001. The probability of a right answer is 83.2% for consistent problems compared to 41.7% for inconsistent ones. In other words, we obtained a consistency effect (e.g., Lewis & Mayer, 1987; van der Schoot et al., 2009). There was also a significant effect of bar diagram: fewer correct answers were given when an inaccurate bar diagram was drawn than when no bar diagram was drawn, b = − 2.36, se = 0.417, p < 0.001; more correct answers were given when an accurate bar diagram was drawn than when no bar diagram was drawn, b = 4.76, se = 0.425, p < 0.001; and more correct answers were given when an accurate bar diagram was drawn than when an incorrect bar diagram was drawn, b = 7.12, se = 0.507, p < 0.001 (all after correction for multiple testing using the Sidak correction). The pseudo-R2 of this model is equal to 0.77, and the probability of a correct answer for the no bar diagram, incorrect bar diagram, and accurate bar diagram was 45.8%, 7.4%, and 99.0%, respectively.
Results of the model that takes into account the interaction between word problem type and bar drawing showed that there was a significant interaction between these two factors, Χ2diff (2) = 23.41, p < 0.001. The pseudo-R2 of this model is equal to 0.77. When no bar diagram was drawn, there were more incorrect answers on inconsistent word problems than on consistent word problems, b = − 2.07, se = 0.184, p < 0.001. Drawing an inaccurate bar diagram resulted in more incorrect answers on inconsistent word problems than on consistent word problems and this difference was larger than when no bar diagram was drawn, b = − 3.27, se = 0.594, p < 0.001. There were no significant differences in word problem-solving performance between consistent and inconsistent word problems when an accurate bar diagram was drawn, b = − 0.06, se = 0.442, p = 0.887. If no bar diagram was drawn, the probability of a correct response for consistent and inconsistent problems is 70.4% and 23.1%, respectively. If a wrong bar diagram was drawn, these probabilities are 26.9% and 1.4%, respectively, while the probability of a correct response for consistent and inconsistent problems is 98.9% and 98.8% when an accurate bar diagram is drawn. An additional sensitivity analysis with students’ performance on a standardized mathematics test (Cito mathematics) as a control variable showed that adding mathematics performance to the analysis did not change this pattern of results. Together, our results show that when an inaccurate bar diagram is drawn, poorer performance is obtained on both consistent and inconsistent word problems, yet inaccurate drawing appears most disadvantageous for inconsistent word problems (also see Table 2). For inconsistent word problems, an all-or-nothing picture emerged: if an accurate bar diagram was drawn, there was a close to 100% accuracy in word problem-solving performance, while if an inaccurate bar diagram was drawn, word problem-solving performance accuracy was close to zero.
7 Discussion
This study investigated the extent to which drawing a bar diagram affects problem-solving performance for compare word problems. We were particularly interested in whether drawing a bar diagram can improve performance on inconsistent compare word problems and how this compares to drawing bar diagrams on consistent compare word problems. Overall, results showed that producing accurate bar diagrams benefited problem-solving performance on both consistent and inconsistent word problems relative to drawing inaccurate bar diagrams or not drawing. This is in line with our predictions and confirms previous findings showing that bar diagram drawing supports problem-solving success in consistent word problems (e.g., Ng & Lee, 2009). An important contribution our study makes is that we show that drawing bar diagrams can also support word problem-solving performance on inconsistent word problems.
7.1 The “all-or-nothing” of drawing for inconsistent word problems
The results of our study show that there is a positive impact of drawing bar diagrams on both consistent and inconsistent word problems, with effects of drawing being the most pronounced on inconsistent word problems. It is important to consider that, as hypothesized, this positive impact strongly depends on the accuracy of the drawn bar diagram, which is in line with earlier research showing that the accuracy (or quality) of drawing influences word problem-solving performance (e.g., Krawitz & Schukajlow, 2020; Ott, 2020; Rellensmann et al., 2019, 2020). That is, bar diagram drawing is mostly supportive to problem solving on inconsistent word problems if an accurate bar diagram is drawn. For inconsistent word problems, drawing resulted in an accurate bar diagram and subsequently in a correct answer in a large majority of the cases. Such a high percentage of correct problem solutions was not realized when no bar diagrams were drawn, indicating a benefit of engaging in drawing accurate bar diagrams. However, if an inaccurate bar diagram was drawn, which occurred relatively less often than accurate drawings, this hardly ever was accompanied with a correct answer. In fact, the chance of a correct answer after drawing an inaccurate diagram was only 2.60%, whereas this chance for consistent word problems was 33.82%. Together, when controlling for students’ mathematical abilities, drawing accurate bar diagrams has a positive impact on word problem solving performance, whereas drawing inaccurate bar diagrams has a detrimental effect on word problem-solving performance, and both effects are more pronounced for inconsistent word problems. This suggests that drawing a bar diagram for inconsistent word problems resembles an “all-or-nothing” principle where the accuracy of the drawn bar diagram (i.e., accurate vs. inaccurate) is tightly coupled with the correctness of the answer on the word problem (i.e., correct vs. incorrect answer).
Our interpretation of this is that the “all” (i.e., association between accurate bar diagrams and correct problem solutions) represents a situation where the instruction to draw encouraged students to reflect on their mental processes. Being confronted with the expectation to draw a bar diagram likely stimulated students to invest mental resources to more critically analyze the word problem and their approach to solve the problem. The engagement in cognitive activities such as identifying and relating the key variables in the word problem has proven to be associated with word problem solving success (e.g., Daroczy et al., 2015; van der Schoot et al., 2009). Several studies indicate that such deeper-level thinking strategies are particularly supportive for improving performance on inconsistent word problems (e.g., De Koning et al., 2017). In this scenario, students are therefore more likely to reverse the arithmetic operation (e.g., subtraction) primed by the relational keyword (e.g., less than) to the appropriate arithmetic operation (e.g., addition). Consequently, their chance to solve an inconsistent word problem correctly is improved.
In contrast, the “nothing” (i.e., association between inaccurate bar diagrams and incorrect problem solutions) in our view reflects students’ attempts to solve an inconsistent word problem while they are insufficiently investing mental resources to accurately mentally represent the described problem situation. That is, they do not take the requirement to draw as an opportunity to carefully and critically analyze the word problem (or may not succeed in this) resulting in the typical reversal error (Schumacher & Fuchs, 2012) that underlies the lower performance on inconsistent word problems. By externalizing these thought processes in a bar diagram (e.g., making one bar longer instead of shorter than the other), the drawing likely visually reinforces students’ inadequate problem-solving approach. Students may perceive this as confirmation that they used an appropriate problem solving approach and do not additionally engage in the deeper cognitive processes required to correctly solve the word problem. This could explain why drawing inaccurate bar diagrams resulted in lower problem-solving performance than not drawing, as without drawing such a visual reinforcement is not available to prevent students from engaging in additional cognitive processing.
For consistent word problems, the relation between bar model drawing and problem-solving success has less of such an all-or-nothing character. The overall pattern of findings indicates that accurate bar diagram drawings most likely coincide with a correct answer on a consistent word problem, more so than respectively not drawing or drawing inaccurate bar diagrams. However, in contrast to inconsistent word problems, on consistent word problems, there were relatively fewer inaccurate bar diagrams but such inaccurate drawings resulted in a correct answer more often than was the case for inconsistent word problems. This suggests that potential harmful effects of drawing an inaccurate bar diagram (e.g., visual reinforcement) are less likely to occur when solving consistent word problems. This is related to the fact that consistent word problems may be solved by relying on a rather superficial problem-solving strategy (Hegarty et al., 1995). For example, to solve consistent word problems, students may simply concentrate on the numbers and relational keyword given in the word problem, and without engaging in deeper cognitive processing, arrive at the correct answer. If students in this situation attempt to draw a bar diagram for the consistent problem because they were expected to do so, their drawing might be inaccurate for several reasons. For example, students might insufficiently master the model method approach resulting in a poorly worked out model (which is unlikely in this study because we tested a sample that was familiar with this method) or they might not finish the drawing because it is not needed to correctly answer the word problem. Additionally, when students draw an inaccurate bar diagram and still are able to provide a correct answer, it is possible that students might have noticed the mismatch between the inaccurate bar diagram and the situation described in the word problem. This may have triggered them to mentally adjust their representation of the word problem and mentally execute the required arithmetic computation to provide the correct answer without additionally changing the initially drawn bar diagram. Although these interpretations, as well as the ones provided for inconsistent word problems, appear plausible, they need confirmation in future work that extends the current study with a close examination of the actual problem-solving process. This may provide insight into the extent to which and in what ways cognitive processing and drawing bar diagrams influence each other.
7.2 Implications
We can tentatively draw a number of educational implications from our results. These implications, which need further ratification, are intended to inform teachers and educational designers about some issues related to drawing bar diagrams during word problem solving. First, asking students to draw a bar diagram during word problem solving improves performance on both consistent and inconsistent word problems. Yet, benefits of drawing compared to not drawing are larger for inconsistent than for consistent word problems. Additionally, it should be noted that the implication that drawing has comparable effects on problem-solving performance for students of varying mathematical abilities should be treated with caution given that we did not have sufficient power to perform interaction analyses, and thus needs corroborating evidence from future studies. Second, our results suggest that carefully analyzing an inconsistent word problem before or during drawing—presumably elicited by the requirement to draw—supports creating accurate bar diagrams and improves problem-solving performance. Third, it appeared that once an inaccurate bar diagram was drawn for an inconsistent word problem, it was unlikely that students were able and/or willing to arrive at the correct problem solution. Therefore, using drawing as a control mechanism for the correctness of an answer is likely to be ineffective when solving inconsistent word problems, at least without feedback on the accuracy of the given answer and/or the drawing and prompts to reflect on their problem-solving approach. Fourth, simply indicating that students should draw bar diagrams while solving word problems does not guarantee that they will create a drawing nor that they create accurate drawings. It would therefore be advisable to complement this instruction with explicit guidance in how to draw and/or to increase the likelihood that students perceive drawing as processing support rather than as optional. For example, a to-be-completed bar diagram could be presented together with the word problem such that students only have to insert the numbers at the right location or, as a more complex variant, are required to draw the second bar and decide whether this should be longer or shorter than the already given bar. A considerable amount of research has shown that using partially completed problems where students need to complete some key solution steps results in fewer errors, increased motivation, and shorter solution times than when having to solve the problem without such guidance (cf. completion effect, Sweller et al., 2011).
8 Conclusion
The present study shows that bar diagram drawing is an effective approach to support word problem-solving performance, particularly for inconsistent word problems. This is a promising finding given that with inconsistent word problems learners typically fail to convert the given relation keyword into the appropriate arithmetic operation. Our results indicate that this high probable conversion error can be prevented to a large extent by engaging in externally visualizing the problem situation in a bar diagram. With this, the current study contributes to an emerging line of research aimed at improving the performance on inconsistent word problems, which thus far has only concentrated on testing the efficacy of verbal/linguistic approaches (De Koning & van der Schoot, 2019; De Koning et al., 2017); here we add to this research by showing that a graphical approach to processing inconsistent word problems can support problem-solving success.
References
Bates, D., Maechler, M., Bolker, B., & Walker, S. (2015). Fitting linear mixed-effects models using lme4. Journal of Statistical Software, 67(1), 1–48. https://doi.org/10.18637/jss.v067.i01
Boonen, A. J. H., De Koning, B. B., Jolles, J., & van der Schoot, M. (2016). Word problem solving in contemporary math education: A plea for reading comprehension skills training. Frontiers in Psychology: Educational Psychology, 7, 191. https://doi.org/10.3389/fpsyg.2016.00191
Chu, J., Rittle-Johnson, B., & Fyfe, E. R. (2017). Diagrams benefit symbolic problem-solving. British Journal of Educational Psychology, 87(2), 273–287. https://doi.org/10.1111/bjep.12149
Csíkos, C., Szitányi, J., & Kelemen, R. (2012). The effects of using drawings in developing young children’s mathematical word problem solving: A design experiment with third-grade Hungarian students. Educational Studies in Mathematics, 81(1), 47–65. https://doi.org/10.1007/s10649-011-9360-z
Daroczy, G., Wolska, M., Meurers, W. D., & Nuerk, H.-C. (2015). Word problems: A review of linguistic and numerical factors contributing to their difficulty. Frontiers in Psychology, 6, 348. https://doi.org/10.3389/fpsyg.2015.00348
De Bock, D., Verschaffel, L., & Janssens, D. (1998). The predominance of the linear model in secondary school students’ solutions of word problems involving length and area of similar plane figures. Educational Studies in Mathematics, 35, 65–83. https://doi.org/10.1023/A:1003151011999
De Corte, E., Verschaffel, L., & De Win, L. (1985). The influence of rewording verbal problems on children’s problem representations and solutions. Journal of Educational Psychology, 77, 460–470. https://doi.org/10.1037/0022-0663.77.4.460
De Koning, B. B., & van der Schoot (2019). Can “you” make a difference? Investigating whether perspective-taking improves performance on inconsistent mathematical word problems. Applied Cognitive Psychology. https://doi.org/10.1002/acp.3555
De Koning, B. B., Boonen, A. J. H., & van der Schoot, M. (2017). The consistency effect in word problem solving is effectively reduced through verbal instruction. Contemporary Educational Psychology, 49, 121–129. https://doi.org/10.1016/j.cedpsych.2017.01.006
Dewolf, T., Van Dooren, W., & Verschaffel, L. (2017). Can visual aids in representational illustrations help pupils to solve mathematical word problems more realistically? European Journal of Psychology of Education, 32, 335–351. https://doi.org/10.1007/s10212-016-0308-7
Goh, S. P. (2009). Primary Five pupils’ difficulties in using the model method for solving complex relational word problems (Unpublished master dissertation). National Institute of Education, Nanyang Technological University.
Gvozdic, K., & Sander, E. (2020). Learning to be an opportunistic word problem solver: Going beyond informal solving strategies. ZDM-Mathematics Education, 52(1), 111–123. https://doi.org/10.1007/s11858-019-01114-z
Hegarty, M., Mayer, R. E., & Monk, C. A. (1995). Comprehension of arithmetic word problems: A comparison of successful and unsuccessful problem solvers. Journal of Educational Psychology, 87, 18–32. https://doi.org/10.1037/0022-0663.87.1.18
Ho, S. Y., & Lowrie, T. (2014). The model method: Students’ performance and its effectiveness. The Journal of Mathematical Behavior, 35, 87–100. https://doi.org/10.1016/j.jmathb.2014.06.002
Kaur, B. (2019). The why, what and how of the ‘Model’ method: A tool for representing and visualising relationships when solving whole number arithmetic word problems. ZDM-Mathematics Education, 51, 151–168. https://doi.org/10.1007/s11858-018-1000-y
Kho, T. H. (1987). Mathematical models for solving arithmetic problems. In Proceedings of the 4th Southeast Asian conference on mathematics education (ICMI-SEAMS), Volume 4 (pp. 345–351). Singapore: Institute of Education.
Kintsch, W., & Greeno, J. G. (1985). Understanding and solving word arithmetic problems. Psychological Review, 92, 109–129. https://doi.org/10.1037/0033-295X.92.1.109
Krawitz, J., & Schukajlow, S. (2020). When can making a drawing hinder problem solving? Effect of the drawing strategy on linear overgeneralizations and problem solving. Frontiers in Psychology, 11, 506. https://doi.org/10.3389/fpsyg.2020.00506
Lee, K., Khng, K. H., Ng, S. F., Kong, N. L., & J. (2013). Longer bars for bigger numbers? Children’s usage and understanding of graphical representations of algebraic problems. Frontline Learning Research, 1, 81–96. https://doi.org/10.14786/flr.v1i1.49
Lewis, A. B., & Mayer, R. E. (1987). Students’ miscomprehension of relational statements in arithmetic word problems. Journal of Educational Psychology, 79, 363–371. https://doi.org/10.1037/00220663.79.4.363
Munez, D., Orrantia, J., & Rosales, J. (2013). The effect of external representations on compare word problems: Supporting mental model construction. The Journal of Experimental Education, 81(3), 337–355. https://doi.org/10.1080/00220973.2012.715095
Nakagawa, S., & Schielzeth, H. (2013). A general and simple method for obtaining R2 from generalized linear mixed-effects models. Methods in Ecology and Evolution, 4, 133–142. https://doi.org/10.1111/j.2041210x.2012.00261.x
Ng, S. F. (2004). Developing algebraic thinking in early grades: Case study of the Singapore primary mathematics curriculum. The Mathematics Educator, 8, 39–59.
Ng, S. F., & Lee, K. (2005). How primary five pupils use the model method to solve word problems. The Mathematics Educator, 9, 60–83.
Ng, S. F., & Lee, K. (2009). The model method: Singapore children’s tool for representing and solving algebraic word problems. Journal for Research in Mathematics Education, 40, 282–313. www.jstor.org/stable/40539338
Ott, B. (2020). Learner-generated graphic representations for word problems: An intervention and evaluation study in grade 3. Educational Studies in Mathematics, 105, 91–113. https://doi.org/10.1007/s10649-020-09978-9
Poh, B. K. (2007). Model method: Primary three pupils’ ability to use models for representing and solving word problems (Unpublished master dissertation). National Institute of Education, Nanyang Technological University.
Rasmussen, C. L., & King, K. D. (2000). Locating starting points in differential equations: A realistic mathematics education approach. International Journal of Mathematical Education in Science and Technology, 31, 161–172. https://doi.org/10.1080/002073900287219
R Core Team (2019). R: A language and environment for statistical computing. R Foundation for Statistical Computing, Vienna, Austria. https://www.R-project.org/.
Rellensmann, J., Schukajlow, S., & Leopold, C. (2020). Measuring and investigating strategic knowledge about drawing to solve geometry modelling problems. ZDM-Mathematics Education, 52, 97–110. https://doi.org/10.1007/s11858-019-01085-1
Rellensmann, J., Schukajlow, S., & Leopold, C. (2019). Measuring and investigating strategic knowledge about drawing to solve geometry modelling problems. ZDM-Mathematics Education, 52, 97–110. https://doi.org/10.1007/s11858-019-01085-1
Schumacher, R. F., & Fuchs, L. S. (2012). Does understanding relational terminology mediate effects of intervention on compare word problem? Journal of Experimental Child Psychology, 111, 607–628. https://doi.org/10.1016/j.jecp.2011.12.001
Schwamborn, A., Mayer, R. E., Thillmann, H., Leopold, C., & Leutner, D. (2010). Drawing as a generative activity and drawing as a prognostic activity. Journal of Educational Psychology, 102, 872–879. https://doi.org/10.1037/a0019640
Sharp, E., & Dennis, M. S. (2017). Model drawing strategy for fraction word problem solving of fourth-grade students with learning disabilities. Remedial and Special Education, 38, 181–192. https://doi.org/10.1177/0741932516678823
Sweller, J., Ayres, P., & Kalyuga, S. (2011). Cognitive load theory. Springer.
Timmermans, R. E., Van Lieshout, E. C. D. M., & Verhoeven, L. (2007). Gender related effects of contemporary math instruction for low performers on problem-solving behavior. Learning and Instruction, 17, 42–54. https://doi.org/10.1016/j.learninstruc.2006.11.005
Van den Heuvel-Panhuizen, M. (2003). The didactical use of models in realistic mathematics education: An example from a longitudinal trajectory on percentage. Educational Studies in Mathematics, 54, 9–35. https://doi.org/10.1023/B:EDUC.0000005212.03219.dc
van der Schoot, M., Bakker-Arkema, A. H., Horsley, T. M., & Van Lieshout, E. C. D. M. (2009). The consistency effect depends on markedness in less successful but not successful problem solvers: An eye movement study in primary school children. Contemporary Educational Psychology, 34, 58–66. https://doi.org/10.1016/j.cedpsych.2008.07.002
van Meter, P., Aleksic, M., Schwartz, A., & Garner, J. (2006). Learner-generated drawing as a strategy for learning from content area text. Contemporary Educational Psychology, 31, 142–166. https://doi.org/10.1016/j.cedpsych.2005.04.001
Verschaffel, L., De Corte, E., & Pauwels, A. (1992). Solving compare problems: An eye movement test of Lewis and Mayer’s consistency hypothesis. Journal of Educational Psychology, 84, 85–94. https://doi.org/10.1037/0022-0663.84.1.85
Yan, K. C. (2002). The model method in Singapore. The Mathematics Educator, 6, 47–64.
Author information
Authors and Affiliations
Corresponding author
Additional information
Publisher's note
Springer Nature remains neutral with regard to jurisdictional claims in published maps and institutional affiliations.
Rights and permissions
Open Access This article is licensed under a Creative Commons Attribution 4.0 International License, which permits use, sharing, adaptation, distribution and reproduction in any medium or format, as long as you give appropriate credit to the original author(s) and the source, provide a link to the Creative Commons licence, and indicate if changes were made. The images or other third party material in this article are included in the article's Creative Commons licence, unless indicated otherwise in a credit line to the material. If material is not included in the article's Creative Commons licence and your intended use is not permitted by statutory regulation or exceeds the permitted use, you will need to obtain permission directly from the copyright holder. To view a copy of this licence, visit http://creativecommons.org/licenses/by/4.0/.
About this article

Cite this article
de Koning, B.B., Boonen, A.J.H., Jongerling, J. et al. Model method drawing acts as a double-edged sword for solving inconsistent word problems. Educ Stud Math 111, 29–45 (2022). https://doi.org/10.1007/s10649-022-10150-8
Accepted:
Published:
Issue Date:
DOI: https://doi.org/10.1007/s10649-022-10150-8