
Abstract
A large number of covariates can have a negative impact on the quality of causal effect estimation since confounding adjustment becomes unreliable when the number of covariates is large relative to the number of samples. Propensity score is a common way to deal with a large covariate set, but the accuracy of propensity score estimation (normally done by logistic regression) is also challenged by the large number of covariates. In this paper, we prove that a large covariate set can be reduced to a lower dimensional representation which captures the complete information for adjustment in causal effect estimation. The theoretical result enables effective data-driven algorithms for causal effect estimation. Supported by the result, we develop an algorithm that employs a supervised kernel dimension reduction method to learn a lower dimensional representation from the original covariate space, and then utilises nearest neighbour matching in the reduced covariate space to impute the counterfactual outcomes to avoid the large sized covariate set problem. The proposed algorithm is evaluated on two semisynthetic and three real-world datasets and the results show the effectiveness of the proposed algorithm.
1 Introduction
Estimating the causal effect of an action (also known as exposure, intervention or treatment in literature) on an outcome is a central problem in scientific discovery and it is the essential task for decision making in many areas, such as medical treatments, government policy marking, and economics (Rubin 1974; Pearl 2009; Imbens and Rubin 2015).
A key to accurate causal effect estimation is confounding control as uncontrolled confounding variables can introduce spurious association between the treatment and the outcome, biasing the causal effect estimation. Properly designed and executed randomisation in a randomised control trial (RCT) is the gold standard for confounding control (Deaton and Cartwright 2018). However, it is often impossible or too costly to conduct RCTs. As a result, it is desirable to estimate causal effects from observational data, and data-driven causal effect estimation has attracted much attention in recent years (Imbens and Rubin 2015; Xie and Cai 2019; Häggström 2018).
Controlling or adjusting for a deconfounding set (also known as adjustment set in literature) is an effective way to eliminate confounding bias in causal effect estimation using observational data (Pearl 2009; VanderWeele and Shpitser 2011; Shpitser et al. 2010). The size of the deconfounding set can significantly affect the performance of a causal effect estimator (Abadie and Imbens 2006; Benkeser and Carone 2017), and a small sized deconfounding set is preferred (De Luna and Waernbaum 2011; Witte and Didelez 2019).
There are two general approaches for determining a proper deconfounding set, each with its own limitations: (1) Including all covariates in the deconfounding set. This is a straightforward approach, but a large sized deconfounding set leads to the reduction of statistical gain (De Luna and Waernbaum 2011; 2) Selecting a subset of covariate variables as a deconfounding set, based on a criterion, mostly, the back-door criterion or its variations (Pearl 2009; Maathuis and Colombo 2015). However, the underlying causal graphs required by these criteria are usually unknown. It is possible to learn causal structures from data (Spirtes and Glymour 2000; Pearl 2009), but from data alone we can only learn a Markov equivalence class of causal graphs (Maathuis and Kalisch 2009; Maathuis and Colombo 2015), hence it is impossible to recover a unique causal graph from the data except in some very special cases (e.g. a small number of variables with sparse relationships among them).
Another line of research is focused on using dimension reduction techniques to create a small set of variables in a new feature space for confounding adjustment. An early and notable example is propensity score (Rubin 1974; Rosenbaum and Rubin 1983), which reduces a covariate set to a scalar, specifically, the probability of an individual receiving the treatment given the covariates. However, propensity score estimation also suffers from the problem of a large sized covariate set (Hahn 1998; Van Der Laan and Starmans 2014; Luo and Zhu 2017). Recently, some advances have been made along the direction of dimension reduction for causal effect estimation (details in the Related work section). However, it is not clear whether or not dimension reduction guarantees unbiased causal effect estimation.
In this paper, we prove that the deconfounding set obtained under Sufficient Dimension Reduction (SDR) is sufficient to control confounding bias, based on the causal graphical modelling theory. This result opens the door for developing new methods for causal effect estimation with a large number of covariates. We then propose a method, CESD, the Causal Effect estimator by using Sufficient Dimension reduction. This method utilises the kernel dimension reduction (Fukumizu et al. 2004) which satisfies the SDR conditions to learn a deconfounding set from data. The advantage of kernel dimension reduction is its ability to capture the conditional independence by using covariance operators on the reproducing kernel Hilbert spaces (RKHS) (Aronszajn 1950; Hofmann and Schölkopf 2008). The main technical contributions of the work are summarised as follows.
-
We have developed a theorem to show that the deconfounding set obtained under SDR is sufficient for controlling confounding bias in causal effect estimation based on the theory of causal graphical modelling. To the best of our knowledge, this is the first work that proves that the reduced covariate set by SDR is a proper deconfounding set.
-
With the support of the theorem, we develop a data-driven algorithm, CESD, which learns a deconfounding set satisfying the conditional independence in RKHS and utilises the nearest neighbour matching with the deconfounding set for average causal effect estimation.
-
The experimental results on two semisynthetic and three real-world datasets have demonstrated the effectiveness of CESD in causal effect estimation, compared with the state-of-the-art methods. The experiments also investigate and demonstrate the superiority of the deconfounding set found by CESD over those found by using propensity score based methods.
2 Related work
Our work is closely related to representation learning for causal effect estimation, which aims to transform the original covariate space into a new representation space. The learned representation set or reduced set is used in various ways in causal effect estimation, including for propensity score estimation, outcome regression and distribution balancing. In the following, we review the related work based on their ways of using a learned representation set.
A doubly robust estimator makes use of propensity score and outcome regression to reduce possible misspecification of one model for causal effect estimation (Van Der Laan and Rubin 2006; Funk and Westreich 2011). Sufficient dimension reduction methods have recently attracted attention in improving the performance of doubly robust estimators (Liu and Ma 2018; Ma and Zhu 2019; Ghosh and Ma 2021). Liu et al. adopted sufficient dimension reduction for predicting propensity scores (Liu and Ma 2018). Ma et al. utilised sparse sufficient dimension reduction to estimate propensity scores and recover the outcome model (Ma and Zhu 2019). Ghosh et al. considered efficient semiparametric sufficient dimension reduction methods in all nuisance models, and then combined these into classical imputation and inverse probability weighting (IPW) estimators (Ghosh and Ma 2021). However, doubly robust estimators require specific parameter assumptions for the propensity score model and the outcome prediction model. These models may be inconsistent with data and hence result in estimation bias (Benkeser and Carone 2017). Furthermore, the convergence rate of the learning of the propensity score model or the outcome prediction model can be slow (Allison 2008; Altman et al. 2004; Han and Wellner 2019).
The most relevant work to ours is the matching method developed by Luo and Zhu (2020). The work considered sufficient dimension reduction for building models on sub-datasets containing the treated samples and the control samples to construct two low-dimensional representation sets as the balance representation for matching, but not for identifying a deconfounding set. When the number of samples in a dataset is small, dividing it into two sub-datasets will reduce the performance of the sufficient dimension reduction method. Another piece of relevant work was done by Nabi et al. (2017). The authors designed a semi-parametric causal sufficient dimension reduction method to reduce the dimension of treatment variables. By contrast, our work reduces the dimension of covariates.
Recently, a number of deep learning methods have been developed for causal effect estimation from observational data (Shalit et al. 2017; Yao et al. 2018; Yoon et al. 2018; Kallus 2020). With these methods, the learning of representation sets aims to balance the distributions of the treated and control groups. The advantage of deep learning methods is that they can capture complex nonlinear representations and handle high-dimensional datasets with large sample size. However, massive parameter turning is very difficult, and low interpretability limits their applications.
Additionally, many machine learning models have been designed for causal inference such as trees-based methods (Hill 2011; Athey and Imbens 2016; Künzel and Sekhon 2019), re-weighting methods (Rosenbaum and Rubin 1983; Kuang et al. 2017), sparse learning for selecting confounders (i.e. outcome-adaptive lasso Shortreed and Ertefaie 2017 and group sparsity Greenewald et al. 2021). These methods select or re-weight the original covariates, while our work aims to learn a representative set as the deconfounding set from a set of pretreatment variables. There is also another line of work on estimating bounds or unbiased causal effect in the presence of latent variables (Kallus et al. 2019; Yadlowsky et al. 2018; Cheng et al. 2020, 2022). When there is strong domain knowledge about an instrumental variable, the causal effect can be estimated from data with latent variable too (Martens and Pestman 2006; Hernán and Robins 2006; Athey and Tibshirani 2019). Since instrumental variable based methods do not rely on the unconfoundedness assumption, they are not directly related to our work.
3 Notations, assumptions and problem setup
3.1 Notations and assumptions
We consider a binary treatment variable W (\(W=1\) for treated and 0 for control). The potential outcomes Y(w) is relative to a specific treatment \(W=w\) \((w\in \{0, 1\})\). For each sample (individual) i, there is a pair of potential outcomes, \((Y_{i}(0), Y_{i}(1))\). Only one of the potential outcomes can be observed, and the other one is counterfactual (Rubin 1974; Robins 1986). We use \(Y_i \in {\mathbb {R}}\) to denote the observed outcome of sample i, and we have \(Y_{i}=w_i*Y_{i}(1)+(1-w_i)*Y_{i}(0)\). We omit the subscript i when the meaning is clear.
Let \({\mathbf {X}}\in {\mathbb {R}}^{p\times 1}\) be a set of p pretreatment variables. We make the pretreatment assumption, i.e. each variable in \({\mathbf {X}}\) is measured before assigning the treatment W and observing the response Y. This is a realistic assumption as it reflects how a sample is obtained in many application areas such as economics and epidemiology (Hill 2011; Imbens and Rubin 2015; Abadie and Imbens 2016). Given a dataset \({\mathbf {D}}\) containing n samples of \(({\mathbf {X}}, Y)\), the average causal effect (ACE) and average causal effect on the treated samples (ACT) can be estimated as follows.
where w, \(w'\) and \({\mathbb {E}}(\cdot )\) refer to \(W=1\), \(W=0\) and the expectation function, respectively. \({\mathbf {Z}}\) is a deconfounding set and is what we focus on in this paper. To estimate ACE or ACT from observational data, we need the following two assumptions which are commonly used in causal inference literature (Imbens and Rubin 2015).
Assumption 1
(unconfoundedness) The potential outcomes are independent of the treatment variable W given the set of pretreatment variables \({\mathbf {X}}\). Formally,  .
.
Assumption 2
(Overlap) Every sample has a nonzero probability to receive treatment 1 or 0 when conditioned on the pretreatment variables \({\mathbf {X}}\), i.e. \(0< P(W=1|{\mathbf {X}}) < 1\).
The unconfoundedness assumption means that there is “no hidden confounder” in the system. The unconfoundedness assumption is not testable since the counterfactual outcomes are unobserved (Imbens and Rubin 2015). To avoid missing potential confounders, in data collection, people attempt to collect all possibly relevant information. Consequently, the set of variables \({\mathbf {X}}\) may contain irrelevant variables with respect to the causal effect estimation of W on Y. It is desirable to find a precise deconfounding set \({\mathbf {Z}}\) from \({\mathbf {X}}\) to accurately estimate the causal effect of W on Y. In this paper, we propose that \({\mathbf {X}}\) can be decomposed into a set of confounding variables \({\mathbf {Z}}\) and a set of variables \({\mathbf {Q}}\) which is not directly related to the treatment W (refer to Fig. 1 and details in Sect. 4). Furthermore, as we will discuss the case with \({\mathbf {Q}}\) is more general than the case without \({\mathbf {Q}}\) since the latter case means that all collected variables are confounders and this is almost impossible to achieve in practice. The purpose of this paper is to find a deconfounding set \({\mathbf {Z}}\) such that  holds, i.e. the spurious association between W and Y is blocked by the set \({\mathbf {Z}}\). In this paper, we use a causal graphical model to represent the underlying data generation mechanism.
A directed acyclic graph (DAG) \({\mathcal {G}}\) is a graph that includes directed edges and does not contain directed cycles. In a DAG \({\mathcal {G}}\), a path is a sequence of consecutive edges. A directed edge “\(\rightarrow \)” denotes a cause-effect relationship, e.g. \(X_i\rightarrow X_j\) indicates that \(X_i\) is a direct cause (or parent) of \(X_j\), and equivalently \(X_j\) is a direct effect (or child) of \(X_i\). A node \(X_i\) is a collider if there are two (or more) edges pointing to it, i.e. \(\rightarrow X_i \leftarrow \). A DAG is computable with the joint data distribution when three key assumptions are satisfied, i.e. causal Markov condition, causal sufficiency and faithfulness (Pearl 2009; Spirtes and Glymour 2000). Causal Markov condition requires that any node in \({\mathcal {G}}\) is independent of all its non-descendants conditioning on the set of its parent nodes. Causal sufficiency states that all common causes of any pair are represented in \({\mathcal {G}}\), and faithfulness requires that the independencies entailed in \({\mathcal {G}}\) with the causal Markov condition are satisfied in the data, and vice versa. The independencies between variables in a DAG \({\mathcal {G}}\) can be read off the DAG based on d-separation, as defined below.
Definition 1
(d-separation; Pearl 2009) A path \(\pi \) in a DAG \({\mathcal {G}}\) is said to be d-separated (or blocked) by a set of nodes \({\mathbf {Z}}\) if and only if (1) \(\pi \) contains a chain \(X_i \rightarrow X_k \rightarrow X_j\) or a fork \(X_i \leftarrow X_k \rightarrow X_j\) such that the middle node \(X_k\) is in \({\mathbf {Z}}\), or (2) \(\pi \) contains a collider \(X_k\) such that \(X_k\) is not in \({\mathbf {Z}}\) and no descendant of \(X_k\) is in \({\mathbf {Z}}\).
When a DAG \({\mathcal {G}}\) is given, the back-door criterion can be used to determine if \({\mathbf {Z}}\subseteq {\mathbf {X}}\) is sufficient for identifying the unbiased causal effects of W on Y.
Definition 2
(Back-door criterion; Pearl 2009) For an ordered pair of variables (W, Y), a set of variables \({\mathbf {Z}}\) is said to satisfy the back-door criterion in a given DAG \({\mathcal {G}}\) if
-
1.
\({\mathbf {Z}}\) does not contain a descendant node of W;
-
2.
\({\mathbf {Z}}\) blocks every back-door path between W and Y (i.e. each path between W and Y that contains an arrow into W).
If we can find a set of variables \({\mathbf {Z}}\) which satisfies the back-door criterion, then \({\mathbf {Z}}\) is a proper deconfounding set or adjustment set, and ACE (or ACT) can be unbiasedly estimated from data by adjusting for \({\mathbf {Z}}\) as shown in Eq.(1) (or Eq.(2)). In order to describe how to identify a deconfounding set \({\mathbf {Z}}\), we need to use a manipulated DAG.
Definition 3
(Manipulated DAG \({\mathcal {G}}_{{\underline{W}}}\); Pearl 2009) Given a DAG \({\mathcal {G}}\), \({\mathcal {G}}_{{\underline{W}}}\) denotes a manipulated DAG of \({\mathcal {G}}\) where all outgoing edges from W are removed from \({\mathcal {G}}\).
Based on the definition, we have the following corollary.
Corollary 1
In a manipulated DAG \({\mathcal {G}}_{{\underline{W}}}\), if a set \({\mathbf {Z}}\) blocks all back-door paths from W to Y, then  .
.
Proof
In the manipulated DAG \({\mathcal {G}}_{{\underline{W}}}\), the outgoing edges from W have been removed and only all back-door paths between W and Y are retained. Hence, if a set \({\mathbf {Z}}\) blocks all back-door paths between W and Y, then  in \({\mathcal {G}}_{{\underline{W}}}\). \(\square \)
3.2 Problem setup
We aim at searching for a deconfounding set \({\mathbf {Z}}\) which is a low-dimensional representation of the pretreatment variables \({\mathbf {X}}\). The problem definition is given as follows.
Problem 1
Given a dataset \({\mathbf {D}}\) generated from an underlying DAG \({\mathcal {G}}\) that contains the treatment variable W, the outcome variable Y, and all the pretreatment variables \({\mathbf {X}}\). The goal of the work is to determine a deconfounding set from the original covariate space \({\mathbf {X}}\) by learning a low-dimensional representation set \({\mathbf {Z}}\) from \({\mathbf {X}}\) such that  in the manipulated DAG \({\mathcal {G}}_{{\underline{W}}}\).
When the deconfounding set \({\mathbf {Z}}\) is found, the causal effect of W on Y can be estimated unbiasedly by adjusting for \({\mathbf {Z}}\) as in Eq.(1) (or Eq.(2)).
4 Theory and algorithm
In this section, we first prove that the reduced covariates set \({\mathbf {Z}}\) by sufficient dimension reduction (SDR) is sufficient to remove confounding bias in causal effect estimation. Then we present the CESD algorithm.
4.1 Sufficient condition for identifying a deconfounding set
Let us consider the treatment assignment as a binary classification problem, i.e. the probability density function of W given \({\mathbf {X}}\) is \(P_{W|{\mathbf {X}}}(w|x)\). We assume that there exists a projection \(\varvec{\Psi }\in {\mathbb {R}}^{p\times r}\), where \(r<p\), such that

where \(\varvec{\Psi }^{T}{\mathbf {X}}\) is the orthogonal projection of \({\mathbf {X}}\) onto the column subspace of \(\varvec{\Psi }\), and the column subspace of \(\varvec{\Psi }\) refers to the dimension reduction space (DRS) (Cook 1996, 2009). Hence, it is to search for the subspace \(\varvec{\Psi }\) given an i.i.d. sample \(\{(x_1, y_1), \dots , (x_n, y_n)\}\) from \(P_{{\mathbf {X}}}\) and \(P_{Y|{\mathbf {X}}}\) as discussed by the literature (Cook 1996; Fukumizu et al. 2004). There is not an additional assumption in the causal inference part. The primary interest is the central DRS since it has a well-known invariant property (Cook 1996, 2009).
Definition 4
(Central DRS; Cook 1996) The column space of \(\varvec{\Psi }\) is a central DRS if the column space of \(\varvec{\Psi }\) is a DRS with the smallest possible dimension r.

A graphical representation of sufficient dimension reduction,  holds (Fukumizu et al. 2004), where \({\mathbf {X}}\) is decomposed into \((\mathbf {Z, Q})\)
In this work, we aim to find the central DRS \(\varvec{\Psi }\) which is the minimum and unique dimension-reduction subspace (Cook 1996). Identifying a projection \(\varvec{\Psi }\) which makes Eq.(3) hold is equivalent to searching for a projection \(\varvec{\Psi }\) which makes W and \(({\mathbf {I}}-\varvec{\Psi } ^{T}){\mathbf {X}}\) conditionally independent given \(\varvec{\Psi }^{T}{\mathbf {X}}\). That is, \({\mathbf {X}}\) can be decomposed into \(({\mathbf {Z}}=\varvec{\Psi }^{T}{\mathbf {X}}, {\mathbf {Q}}=({\mathbf {I}}-\varvec{\Psi }^{T}){\mathbf {X}})\), in which \({\mathbf {Z}}\) is associated with W, and \({\mathbf {Q}}\) is independent of W given \({\mathbf {Z}}\), i.e.  (See Fig. 1). Instead of using SDR to decompose \({\mathbf {X}}\) into \({\mathbf {Z}}\) and \({\mathbf {Q}}\), one may learn a lower dimensional subspace of the original space \({\mathbf {X}}\). However, this is not preferable for the following reasons. Firstly, directly learning a lower dimensional space of \({\mathbf {X}}\) would not provide us with the decomposition of \({\mathbf {X}}\) into \({\mathbf {Z}}\) and \({\mathbf {Q}}\), and hence does not give a clear causal structure based explanation as SDR does. Secondly, the irrelevant information for causal effect estimation (i.e. the information contained in \({\mathbf {Q}}\)) will be in the learned lower dimensional space and such irrelevant information may reduce the quality of causal effect estimation in the subsequent step.
Now we show in the following theorem that finding a deconfounding set from \({\mathbf {X}}\) can be converted to the problem of learning the reduced covariate set \({\mathbf {Z}}\) by SDR.
Theorem 1
Let \({\mathcal {G}}\) be the underlying causal DAG that contains the treatment variable W, the outcome variable Y, and all the pretreatment variables \({\mathbf {X}}\). If there exists a central DRS (the column space of \(\varvec{\Psi }\)) such that  , where \({\mathbf {Z}}= \varvec{\Psi }^{T}{\mathbf {X}}\) and \({\mathbf {Q}}=({\mathbf {I}}-\varvec{\Psi } ^{T}){\mathbf {X}}\), then \({\mathbf {Z}}\) is a proper deconfounding set for estimating the average causal effect of W on Y unbiasedly.
Proof
Under the pretreatment assumption, there is no descendant node of W in \({\mathbf {X}}\). Under the unconfoundedness assumption, there are no hidden confounders between W and Y. In the manipulated DAG \({\mathcal {G}}_{{\underline{W}}}\), there are only back-door paths between W and Y. Hence, all back-door paths between W and Y are blocked by the set of \({\mathbf {X}}\), i.e.  holds in \({\mathcal {G}}_{{\underline{W}}}\).
We now prove that if the column space of \(\varvec{\Psi }\) is a central DRS, then \({\mathbf {Z}}\) is sufficient to block all back-door paths between W and Y. We have \({\mathbf {Z}}= \varvec{\Psi }^{T}{\mathbf {X}}\) and \({\mathbf {Z}}\) satisfies  by the property of SDR since the column space of \(\varvec{\Psi }\) is a central DRS. We have
  in \({\mathcal {G}}_{{\underline{W}}}\) and \({\mathbf {X}}=(\mathbf {Z, Q})\); then,
  holds in \({\mathcal {G}}_{{\underline{W}}}\). Because
  is satisfied based on the property of SDR, then
  holds in \({\mathcal {G}}_{{\underline{W}}}\) by the contraction property of conditional independence. According to the decomposition property of conditional independence,
  is sufficient to infer
  in \({\mathcal {G}}_{{\underline{W}}}\). As there are only back-door paths between W and Y in \({\mathcal {G}}_{{\underline{W}}}\), \({\mathbf {Z}}\) is sufficient to block all such paths since
  holds in \({\mathcal {G}}_{{\underline{W}}}\). Therefore, \({\mathbf {Z}}\) is a proper deconfounding set. \(\square \)
Theorem 1 shows that the reduced covariates set \({\mathbf {Z}}\) by SDR is sufficient for removing confounding bias when estimating the causal effects of W on Y from data. Furthermore, Theorem 1 guarantees the soundness of any SDR method for estimating causal effects from data. We provide two causal DAG in Fig. 2 to interpret the causal relationships between the ordered pair (W, Y) and the decomposed sets \((\mathbf {Z, Q})\). In the next section, we will propose a data-driven method based on Theorem 1 for estimating causal effects from data.
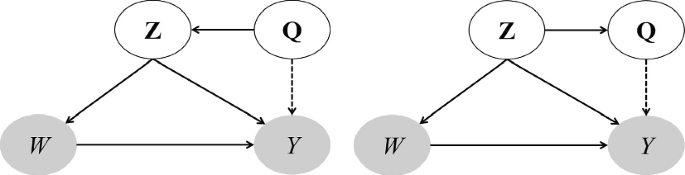
There are two possible causal DAGs to interpret the causal relationships between the ordered pair (W, Y) and the decomposed sets \((\mathbf {Z, Q})\). Under the pretreatment assumption, variables in \({\mathbf {Z}}\) are direct cause of both W and Y, and \({\mathbf {Q}}\) contains variables which are direct causes (left DAG) (or direct effect (right DAG)) of \({\mathbf {Z}}\) and possibly direct causes of Y
4.2 Deconfounding set identification using SDR
In this section, we use a kernel-based SDR method to identify a deconfounding set from data. We utilise the cross-covariance operators on reproducing kernel Hilbert space (RKHS) (Aronszajn 1950) \({\mathcal {H}}\) to establish an objective function for dimensionality reduction. By default, we use the Gaussian kernel, i.e. \(k(x_i, x_j) = exp(-\frac{\parallel x_i - x_j\parallel ^{2}}{2\delta ^{2}})\), where \(\delta \) is the kernel width.
Given two RKHS, \(({\mathcal {H}}_1, k_1)\) and \(({\mathcal {H}}_2, k_2)\), which are over the measured spaces \((\Omega _1, {\mathfrak {B}}_1)\) and \((\Omega _2, {\mathfrak {B}}_2)\), with the positive kernels \(k_1\), \(k_2\) and they are measurable. For the pair of W and \({\mathbf {X}}\) on \(\Omega _1 \times \Omega _2\), the cross-covariance operator from \({\mathcal {H}}_1\) to \({\mathcal {H}}_2\) is defined by the relation:
for all \(f\in {\mathcal {H}}_1\) and \(g\in {\mathcal {H}}_2\). Hence, the conditional covariance operator \(\Sigma _{WW|{\mathbf {Z}}}\) on \({\mathcal {H}}_1\) can be defined as follows.
Theorem 7 in (Fukumizu et al. 2004) shows that \(\Sigma _{WW|{\mathbf {Z}}}\ge \Sigma _{WW|{\mathbf {X}}}\) for any \({\mathbf {Z}}\), and  . That is, minimising \({\hat{\Sigma }}_{WW|{\mathbf {Z}}}\) is the most informative direction for searching for the optimal \({\mathbf {Z}}\). Hence, searching for a set of reduced covariates \({\mathbf {Z}}\) such that
  holds is equivalent to optimising the minimised conditional covariance operator \({\hat{\Sigma }}_{WW|{\mathbf {Z}}}\). The determinant of \({\hat{\Sigma }}_{WW|{\mathbf {Z}}}\) can be written as follows.
where \({\hat{\Sigma }}_{[W{\mathbf {Z}}][W{\mathbf {Z}}]} = \begin{pmatrix} {\hat{\Sigma }}_{WW} &{} {\hat{\Sigma }}_{W{\mathbf {Z}}}\\ {\hat{\Sigma }}_{{\mathbf {Z}}W} &{} {\hat{\Sigma }}_{{\mathbf {Z}}{\mathbf {Z}}} \end{pmatrix} = \begin{pmatrix} ({\hat{K}}_{W} + \epsilon {\mathbf {I}}_{n})^{2} &{} {\hat{K}}_{W}{\hat{K}}_{{\mathbf {Z}}} \\ {\hat{K}}_{{\mathbf {Z}}}{\hat{K}}_{W} &{} ({\hat{K}}_{{\mathbf {Z}}} + \epsilon {\mathbf {I}}_{n})^{2} \end{pmatrix}\), and \(\epsilon \) is a positive regularization parameter. \({\hat{K}}_{W}\) and \({\hat{K}}_{{\mathbf {Z}}}\) are the centralized Gram matrices defined as follows.
where \((G_{W})_{i,j} = k(w_i, w_j)\), \((G_{{\mathbf {Z}}})_{i,j} = k({\mathbf {Z}}_i, {\mathbf {Z}}_j)\) and \({\mathbf {1}}_n=(1,\dots ,1)^{T}\) is a vector with all elements equal to 1.
To solve Eq.(6), gradient descent with line search can be used. The matrix of parameters is updated iteratively by
where the trace norm in Eq.(9) can be rewritten as \(2\epsilon Tr[{\hat{\Sigma }}^{-1}_{WW|{\mathbf {Z}}}{\hat{K}}_{W}({\hat{K}}_{{\mathbf {Z}}}+\epsilon {\mathbf {I}}_{n})^{-1} \frac{\partial {\hat{K}}_{{\mathbf {Z}}}}{\partial \varvec{\Psi }}({\hat{K}}_{{\mathbf {Z}}}+\epsilon {\mathbf {I}}_{n})^{-2}{\hat{K}}_{{\mathbf {Z}}}{\hat{K}}_{W}]\), and \(\beta \) is optimised through golden section search (Fukumizu et al. 2004). All of these matrices in Eq. (9) can be obtained directly based on Eqs. (7) and Eq.(8). Therefore, the problem of identifying a deconfounding set \({\mathbf {Z}}\) can be achieved by optimising Eq.(6).
4.3 NNM using the discovered deconfounding set
Given the learned deconfounding set \({\mathbf {Z}}\) by SDR, we can employ the commonly used estimators, such as Nearest Neighbour Matching (NNM) (Abadie and Imbens 2006; Rubin 1973), Inverse Probability Weighting (IPW) (Hernán and Robins 2020) parametric g-computation (Robins 1986) and doubly robust estimators (Ghosh and Ma 2021; Liu and Ma 2018) to achieve unbiased causal effect estimation. In this work, we choose NNM because of its simplicity. Our focus here is to show unbiased estimations can be achieved with the covariate set derived by using SDR, without involving a more complicated causal effect estimator. Moreover, NNM is non-parametric and does not require any parametric assumptions needed by some other methods such as IPW and doubly robust estimator.
In the following, we show the steps of employing NNM to infer the counterfactual outcome, denoted as \(Y^{*}_i(w_i)\) after obtaining the deconfounding set \({\mathbf {Z}}\). With NNM, the unobserved or counterfactual outcome of an individual i is imputed by the observed outcome of an individual j who has similar covariates (\({\mathbf {Z}}\) values) in the opposite treated group. The Mahalanobis distance is used to measure the distance of each pair \((z_i, z_j)\) over the space of the deconfounding set \({\mathbf {Z}}\) as follows.
where \(z_i\) and \(z_j\) are the value vectors of the deconfounding set \({\mathbf {Z}}\) of the i-th and j-th individuals. The strategy of NNM can be formalized as follows.
where \({\mathbf {D}}_{(1-w_i)}\) is the dataset with the treatment of \(1-w_i\).
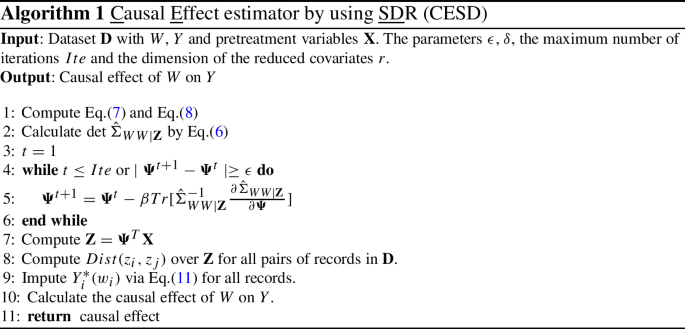
The complete procedure of CESD is listed in Algorithm 1. The first line calculates \({\hat{K}}_{W}\) and \({\hat{K}}_{{\mathbf {Z}}}\), where the kernel width \(\delta \) is set to 5 for CESD. Line 2 is to calculate \(\det {\hat{\Sigma }}_{WW|{\mathbf {Z}}}\). Lines 3 to 6 aim to obtain the central DRS \(\varvec{\Psi }\) by optimising Eq.(6). Line 7 is to obtain the deconfounding set \({\mathbf {Z}}\). Line 8 calculates the Mahalanobis distance of each pair of individuals over the space of \({\mathbf {Z}}\). Line 9 imputes the counterfactual outcome \(Y^{*}_i(w_i)\) for each factual outcome. Line 10 calculates the causal effects by Eq.(1) or Eq.(2) according to the different requirements.
Theorem 2
(Soundness of the CESD algorithm) Let \({\mathcal {G}}\) be the underlying causal DAG that contains the treatment variable W, the outcome variable Y, and the set of all pretreatment variables \({\mathbf {X}}\). CESD can estimate the causal effect of W on Y unbiasedly.
Proof
The column space of \(\varvec{\Psi }\) is optimal by minimising Eq.(6) because \(\Sigma _{WW|{\mathbf {Z}}}\ge \Sigma _{WW|{\mathbf {X}}}\) for any \({\mathbf {Z}}\), and  . In other words, \({\mathbf {Z}}=\varvec{\Psi }^{T}{\mathbf {X}}\) contains the same information as \({\mathbf {X}}\) relative to (W, Y) for causal effect estimation. By Theorem 1, \({\mathbf {Z}}\) is a proper deconfounding set. Therefore, the causal effect of W on Y is unbiasedly estimated by CESD. \(\square \)
Complexity analysis: Three parts contribute to the time complexity of CESD. The calculation of \(\det {\hat{\Sigma }}_{WW|{\mathbf {Z}}}\) involves matrix multiplication, which has a time complexity of \(\mathbf{O }(np^{2})\). Solving Eq.(6) requires a linear search with time complexity \(\mathbf{O }(np)\). The calculation of NNM has a time complexity of \(\mathbf{O }(nr^{2})\). Therefore, the time complexity of CESD is \(\mathbf{O }(np^{2})\) since \(r<p\).
5 Experiments
Evaluating causal effect estimators is very challenging since we rarely have the ground truth of causal effects on real-world datasets. We chose five datasets for the evaluation. The two semi-synthetic real-world datasets, IHDP (Hill 2011) and Twins (Louizos et al. 2017) are commonly used in literature for evaluating causal effect estimators (Hill 2011; Yao et al. 2018; Yoon et al. 2018). With IHDP and Twins, the ground truth causal effects are known and hence biases (errors) can be calculated. The other three real-world datasets, Job training (Jobs) (LaLonde 1986), Cattaneo2 (Ghosh and Ma 2021) and RHC (Connors et al. 1996a) are well studied in literature (Imai and Ratkovic 2014; Liu and Ma 2018; Loh and Vansteelandt 2021). The empirical causal effect on Job training and Cattaneo2 are available in the literature (Imai and Ratkovic 2014; Liu and Ma 2018). The estimated conclusion of RHC is available in the literature (Connors et al. 1996a; Loh and Vansteelandt 2021), i.e. applying RHC leads to a higher mortality 180 days than not applying RHC.
To evaluate the performance of CESD, we compare it against eight state-of-the-art causal effect estimators, including two methods developed in statistics area which reduce the dimension of covariate set through transformation, PSM (propensity score matching with logistic regression; Rubin 1973) and CBPS (covariate balancing propensity score; Imai and Ratkovic 2014); MDM (the classical matching method based Mahalanobis Distance in the original covariate set space; Rubin 1979); PAW (the set of causes of W with PSM) and PAY (the set of causes of Y with PSM), which are the two recent methods using causal structure learning in combination with traditional propensity score for reducing the dimensionality of covariate sets; and two machine learning based methods which use SDR, Shrinkage (Inverse probability weighting estimator based on SDR for average causal effect estimation; Ghosh and Ma 2021) and MSDR (matching using SDR; Luo and Zhu 2020). Additionally, we use CausalForest, Random forest regression for estimating causal effect (Wager and Athey 2018), benchmark the performance of the proposed method, since it is a recent method and regarded as one of the most accurate methods for causal effect estimation.
Implementation. We implement CESD by using the \({\mathbf {R}}\) packages KDRcppFootnote 1 (for the kernel dimension reduction part of CESD) and Matching (Ho and Imai 2007) (for NNM), respectively. MDM is implemented by the function Match in the \({\mathbf {R}}\) package Matching. PSM is programmed by the functions glm and Match in the \({\mathbf {R}}\) packages stats (Team RC 2017) and Matching, respectively. The implementation of CBPS is based on the functions CBPS and Match in the \({\mathbf {R}}\) packages CBPS and Matching, respectively. PAW and PAY are implemented by the functions pcSelect and Match in the \({\mathbf {R}}\) packages pcalg and Matching, respectively. CausalForest is implemented by the functions rpart and estimate.causalTree in the \({\mathbf {R}}\) packages rpart and grf, respectively. The implementation of Shrinkage is based on the function semipar\(\_\)imputation in the \({\mathbf {R}}\) package SDRcausalFootnote 2. MSDR is implemented by the functions dr and Match in the \({\mathbf {R}}\) packages dr and Matching, respectively.
Parameter settings The parameter family is set to binomial for the function glm. The parameter estimand in the function Match is set as ATT for Jobs, and is set as ATE for the other four datasets. For the function CBPS, ATT is set to 1 for Jobs, and 0 for the other four datasets. For CausalForest, we set the number of trees to 200 and the default values are used for the parameters. For Shrinkage, MSDR, and CESD, the dimension of the reduced covariate set r is set to 2. For CESD, following the literature (Fukumizu et al. 2004), the parameters \(\epsilon \), \(\delta \) and Ite are set as 0.0001, 5 and 20 respectively.
Evaluation metrics. We evaluate the performance of all algorithms using standard deviation (SD), the root-mean-square error (RMSE) and the estimation bias (%) (relative error) when the ground truth is available. We use the empirically estimated interval to evaluate the performance of all algorithms when the ground truth is not available. We also visualise the estimated causal effects of all algorithms and their confidence intervals with a confidence level of 95% on all datasets.
5.1 Experiments on the two semisynthetic real-world datasets
5.1.1 IHDP
The IHDP dataset is an observational dataset from a randomised trial based on the Infant Health and Development Programme (IHDP), which investigated the effects of intensive high-quality care on low-birth-weight and premature infants (Hill 2011). The indicator variable, representing with/without intensive high-quality care, is used as a treatment variable. IHDP consists of 747 samples with 24 pretreatment variables, among which 608 are control units (samples) and 139 are treated units. The simulated outcomes are generated by using setting “A” in the \({\mathbf {R}}\) package npciFootnote 3, and the ground truth of the causal effect, i.e. 4.36 is obtained by the noiseless outcome according to the same procedures suggested by Hill (2011).
The experimental results of all estimators are listed in Table 1 and display the estimated causal effects and their confidence intervals with a confidence level of 95% in Fig. 3. From Table 1, estimates from CESD, CBPS, PSM, and MDM are lower than 10% in their biases and this is a very good performance in causal effect estimation. This shows that CESD is at least competitive with other state-of-the-art methods and demonstrates that the reduced set \({\mathbf {Z}}\) preserves all deconfounding information for causal effect estimation. By considering the confidence intervals, it is difficult to see the relative performance in the table, and hence we do visualisation.
According to the visualization of the results in Fig. 3, these algorithms can be divided into two groups: Group I includes methods whose estimates are close to the ground truth, i.e. MDM, PSM, CBPS, Shrinkage, MSDR, and CESD; the remaining methods (including PAW, PAY, and CausalForest) are in Group II. The methods in Group I have better performance than those in Group II. The performance of CESD is competitive with the methods in Group I and better than the methods in Group II.

Estimated causal effects on the IHDP dataset w.r.t. a 95% confidence interval. The red line represents the ground truth ACE
5.1.2 Twins
The Twins dataset is collected from twin births in the USA between 1989 and 1991, with infants having birth weights less than 2,000g (Almond and Chay 2005). We remove samples with missing values from the original dataset and have 4,821 twin pairs left with 40 covariates. The weight of an infant is considered the treatment variable: W=1 for a baby who is heavier in the twin pair; W=0 otherwise. The mortality after one year is the outcome. The ground truth causal effect is -0.025. To simulate a randomised experiment, we follow Louizos et al.’s suggestion (Louizos et al. 2017) to randomly select one of the two twins as the observed infant and hide the other by applying the setting: \(W_i|x_i\sim Bern(sigmoid(\beta ^{T}{\mathbf {x}}+\varepsilon ))\), where \({\mathbf {x}}\) denotes the set of 40 covariates, and \(\beta ^{T}\sim {\mathcal {U}}((-0.1,0.1)^{40\times 1})\) and \(\varepsilon \sim {\mathcal {N}}(0,0.1)\).
The experimental results of all methods are presented in Table 2 and visualised in Fig. 4. From Table 2, we observe that estimates from PAY, CBPS, PSM, CESD and MSDR are lower than 10% in their biases and this is a very good performance in causal effect estimation. This again shows that CESD is at least competitive with other state-of-the-art methods and demonstrates that the reduced set \({\mathbf {Z}}\) preserves all deconfounding information for causal effect estimation. By considering the confidence intervals, it is difficult to see the relative performance in the table, and hence we do visualisation.

Estimated causal effects on the Twins dataset w.r.t. a 95% confidence interval. The red line represent the group truth ACE
In Fig. 4, the performance of the estimators can be divided into Group I, including PSM, CBPS, PAY, MSDR, and CESD, whose results are close to the true ACE, and Group II, including the remaining methods. The methods in Group I have better performance than those in Group II. The results show SDR works for finding deconfounding sets.
5.2 Evaluation with three real-world datasets
5.2.1 Jobs
The Job training dataset (or Jobs) is a widely used benchmark dataset in causal inference, which consists of the original LaLonde dataset (297 treated samples and 425 control samples) (LaLonde 1986) and the Panel Study of Income Dynamics (PSID) observational group (2,490 control samples) (Imai and Ratkovic 2014). There are 9 covariates, including age, schooling in years, indicators for black, marital status, school degree, previous earnings in 1974 and 1975, and whether the 1974 earnings variable is missing. The job training status, i.e. with/without job training, is defined as the treatment variable W. The earnings in 1978 are defined as the outcome variable Y. Because the dataset contains records of people taking part in the training only, as in LaLonde (1986), we estimate the ACT using CESD and all comparing methods against the ground truth ACT, which is $886 with a standard error of $448 (Imai and Ratkovic 2014).
We summarise the results of all methods in Table 3 and visualise them in Fig. 5. From Table 3, with the Jobs dataset, CESD and CBPS achieve very good performance in terms of the biases in causal effect estimations. Note that the ground truth is an estimate and biases may not be reliable. The confidence interval is a more reliable indicator. We use the visualisation for further analysis.

Estimated causal effects on the Jobs dataset. The two dotted lines denote the empirical estimated interval with a 95% confidence interval
In Fig. 5, we see that CBPS and CESD are in Group I, where the methods’ estimates fall within the empirical estimation interval, and other methods, in Group II, are not in the interval. CESD achieves competitive results with CBPS. This further shows that SDR works for deconfounding bias.
5.2.2 Cattaneo2
The Cattaneo 2 (Cattaneo 2010) is usually used to study the ACE of maternal smoking status during pregnancy (W) on a baby’s birth weight (in grams)Footnote 4. Cattaneo2 consists of the birth weights of 4,642 singleton births in Pennsylvania, USA (Almond and Chay 2005; Cattaneo 2010). Cattaneo2 contains 864 smoking mothers (W=1) and 3,778 nonsmoking mothers (W=0). The dataset contains several covariates: mother’s age, mother’s marital status, an indicator for the previous infant where the newborn died, mother’s race, mother’s education, father’s education, number of prenatal care visits, months since last birth, an indicator of firstborn infant and indicator of alcohol consumption during pregnancy. The authors (Almond and Chay 2005) found a strong negative effect of maternal smoking on the weights of babies, that is, about 200g to 250g lighter for a baby with a mother smoking during pregnancy by statistical analysis on all covariates.
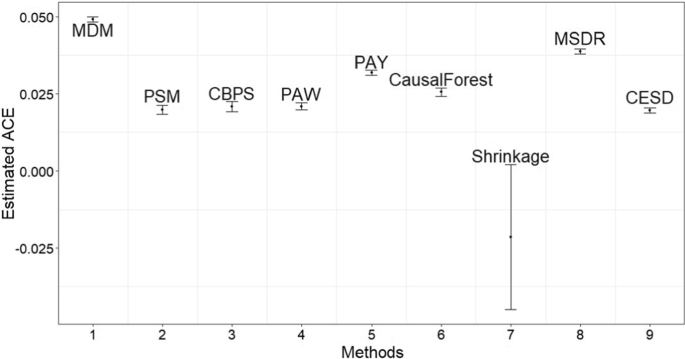
All results on this dataset are shown in Table 4 and displayed in Fig. 6. From Table 4, the range of the estimated causal effects of smoking on a baby’s birth weight is -285.36g to -152g. The estimated ACE by CESD is -221.47g, which is consistent with the original study (Almond and Chay 2005). In Fig. 6, we see that only the estimated ACE by CESD falls within the empirically estimated interval (-250g, -200g). It further shows that CESD can be used in real applications.
5.2.3 Right heart catheterization
Right heart catheterization (RHC) is a real-world dataset obtained from an observational study regarding a diagnostic procedure for the management of critically ill patients (Connors and Speroff 1996). The RHC dataset can be downloaded from the \({\mathbf {R}}\) package HmiscFootnote 5. RHC contains information on hospitalised adult patients from five medical centres in the USA. These hospitalised adult patients participated in the Study to Understand Prognoses and Preferences for Outcomes and Risks of Treatments (SUPPORT). Treatment W indicates whether a patient received an RHC within 24 hours of admission. The outcome Y is whether a patient died at any time up to 180 days after admission. The original RHC dataset has 5,735 samples with 73 covariates. We preprocess the original data, as suggested by Loh et al. (Loh and Vansteelandt 2021), and the final dataset contains 2,707 samples with 72 covariates.
The experimental results on this dataset are represented in Table 4 and visualised in Fig. 7. In the experimental results, we can see that the CESD results are consistent with those of PSM, CBPS, PAW, PAY, and CausalForest. The estimated causal effects by the methods indicate that applying RHC leads to higher mortality within 180 days than not applying RHC. The conclusion is consistent with the literature (Connors and Speroff 1996; Loh and Vansteelandt 2021).

Estimated causal effects on the Cattaneo2 dataset w.r.t. a 95% confidence interval. The two dotted lines represent the empirical estimated interval (–250g, –200g)
Estimated causal effects on the RHC dataset w.r.t. a 95% confidence interval
Overall, CESD performs consistently better than the classic MDM, SDR-based methods (Shrinkage and MSDR), and the tree-based method causal forest. This is because CESD has identified the deconfounding set \({\mathbf {Z}}\) for causal effect adjustment, while the other four methods (classic MDR, Shrinkage, MSDR and CausalForest) do not have a precise adjustment set for deconfounding. Note that propensity score based methods, such as PSM, PAW and PAY, perform inconsistently, sometimes better and sometimes worse than CESD. The propensity score is theoretically sound for adjustment (Imbens and Rubin 2015; Rosenbaum and Rubin 1983; Rubin 2007), but when the data and the parameters specified for the propensity score estimation model are not consistent, a poor performance will be obtained. CBPS is an exception among the propensity score based methods, since it mitigates the effect of the potentially misspecified parameters of the propensity score estimation model by selecting parameter values that maximise the resulting covariate balance and thus improve the robustness of propensity score matching. The competitiveness of CESD to CBPS shows the promise of SDR in causal effect estimation. We note that CESD has a lower variance than CBPS with all the datasets, and this is because CBPS includes irrelevant information from variables that do not contribute to confounding control.
In summary, based on all experimental results with the five datasets, we can conclude that CESD achieves estimates that are close to true or empirically estimated causal effect values in all datasets and is consistently in the high performing group across all the datasets, and CESD is the only method that is in the high-performing group across all five datasets. The closest high-performing method is CBPS from a widely used \({\mathbf {R}}\) package CBPS for causal effect estimation. All these results demonstrate the robustness of CESD.

The distributions of propensity scores (left four) and reduced covariate dimensions, grouped by the treatment variable W (red for the control group and green-blue for the treated group) on the Cattaneo2 dataset
5.3 The quality of matching
To investigate further into the reasons for better performance of CESD compared with the other methods, we look into the matching process for the Cattaneo2 dataset, which is crucial for causal effect estimation methods that are based on propensity score such as, PSM, PAW, PAY, and CBPS. These methods all reduce the covariate set to a one-dimension propensity score for matching. We show the distributions of the estimated propensity scores in the treated and control groups in Fig. 8 (left four subfigures). We see the obvious mismatch of propensity score distributions in the two groups, which leads to the loss of power in matching and results in a large variance in the estimated causal effects (Stuart 2010). When the covariate set is reduced to two dimensions by kernel dimension reduction in CESD, we can see that the distributions of each reduced dimension in the treated and control groups (the curves in the right panel in Fig. 8) largely overlap. The overlap improves matching in causal effect estimation and this provides an explanation for the good performance of CESD.
6 Conclusion
We have proposed a novel solution for average causal effect estimation through sufficient dimension reduction. In theory, we have proven the soundness of the solution where the reduced low-dimensional covariates are sufficient to remove confounding bias based on the theory of causal graphical modelling, under the assumptions of pretreatment variables and unconfoundedness. We have developed CESD, a data-driven algorithm based on kernel dimension reduction, to estimate causal effects from observational data. Experimental results on two semisynthetic and three real-world datasets demonstrate that CESD performs consistently well in comparison with the state-of-the-art methods. This suggests that CESD is a high performing and consistent method, and is potentially useful in various applications for average causal effect estimation.
References
Abadie A, Imbens GW (2006) Large sample properties of matching estimators for average treatment effects. Econometrica 74(1):235–267
Abadie A, Imbens GW (2016) Matching on the estimated propensity score. Econometrica 84(2):781–807
Allison PD (2008) Convergence failures in logistic regression. SAS Global Forum 360:1–11
Almond D, Chay KY et al (2005) The costs of low birth weight. Q J Econ 120(3):1031–1083
Altman M, Gill J et al (2004) Numerical issues in statistical computing for the social scientist. Wiley, New Jersey
Aronszajn N (1950) Theory of reproducing kernels. Trans Am Math Soc 68(3):337–404
Athey S, Imbens G (2016) Recursive partitioning for heterogeneous causal effects. Proc Natl Acad Sci 113(27):7353–7360
Athey S, Tibshirani J et al (2019) Generalized random forests. Annals Stat 47(2):1148–1178
Benkeser D, Carone M et al (2017) Doubly robust nonparametric inference on the average treatment effect. Biometrika 104(4):863–880
Cattaneo MD (2010) Efficient semiparametric estimation of multi-valued treatment effects under ignorability. J Econom 155(2):138–154
Cheng D, Li J, et al. (2020) Causal query in observational data with hidden variables. In: Proceedings of European Conference on Artificial Intelligence, pp 2551–2558
Cheng D, Li J et al (2022) Toward unique and unbiased causal effect estimation from data with hidden variables. IEEE Trans Neural Netw Learn Syst 68:1–13
Connors AF, Dawson NV et al (1996) Outcomes following acute exacerbation of severe chronic obstructive lung disease. the support investigators (study to understand prognoses and preferences for outcomes and risks of treatments). Am J Resp Crit Care Med 154(4):959–967
Connors AF, Speroff T et al (1996) The effectiveness of right heart catheterization in the initial care of critically iii patients. J Am Med Assoc 276(11):889–897
Cook RD (1996) Graphics for regressions with a binary response. J Am Stat Assoc 91(435):983–992
Cook RD (2009) Regression graphics: ideas for studying regressions through graphics. Wiley, New Jersey
De Luna X, Waernbaum I et al (2011) Covariate selection for the nonparametric estimation of an average treatment effect. Biometrika 98(4):861–875
Deaton A, Cartwright N (2018) Understanding and misunderstanding randomized controlled trials. Soc Sci Med 210:2–21
Fukumizu K, Bach FR et al (2004) Dimensionality reduction for supervised learning with reproducing kernel hilbert spaces. J Mach Learn Res 5:73–99
Funk MJ, Westreich D et al (2011) Doubly robust estimation of causal effects. Am J Epidemiol 173(7):761–767
Ghosh T, Ma Y et al (2021) Sufficient dimension reduction for feasible and robust estimation of average causal effect. Statistica Sinica 31(2):821
Greenewald K, Shanmugam K, et al. (2021) High-dimensional feature selection for sample efficient treatment effect estimation. In: Proceedings of International Conference on Artificial Intelligence and Statistics, pp 2224–2232
Häggström J (2018) Data-driven confounder selection via Markov and Bayesian networks. Biometrics 74(2):389–398
Hahn J (1998) On the role of the propensity score in efficient semiparametric estimation of average treatment effects. Econometrica 66(2):315–331
Han Q, Wellner JA (2019) Convergence rates of least squares regression estimators with heavy-tailed errors. Annals Stat 47(4):2286–2319
Hernán MA, Robins JM (2006) Instruments for causal inference: an epidemiologist’s dream? Epidemiology 17(4):360–372
Hernán MA, Robins JM (2020) Causal inference: what if. Chapman & Hall/CRC, Boca Raton
Hill JL (2011) Bayesian nonparametric modeling for causal inference. J Comput Gr Stat 20(1):217–240
Ho DE, Imai K et al (2007) Matching as nonparametric preprocessing for reducing model dependence in parametric causal inference. Polit Anal 15(3):199–236
Hofmann T, Schölkopf B et al (2008) Kernel methods in machine learning. Annals Stat 36(3):1171–1220
Imai K, Ratkovic M (2014) Covariate balancing propensity score. J R Stat Soc : Ser B (Stat Methodol) 76(1):243–263
Imbens GW, Rubin DB (2015) Causal inference in statistics, social, and biomedical sciences. Cambridge University Press, Cambridge
Kallus N (2020) Deepmatch: Balancing deep covariate representations for causal inference using adversarial training. In: Proceedings of International Conference on Machine Learning, pp 5067–5077
Kallus N, Mao X, et al. (2019) Interval estimation of individual-level causal effects under unobserved confounding. In: Proceedings of International Conference on Artificial Intelligence and Statistics, pp 2281–2290
Kuang K, Cui P, et al. (2017) Estimating treatment effect in the wild via differentiated confounder balancing. In: Proceedings of ACM SIGKDD Conference on Knowledge Discovery & Data Mining, pp 265–274
Künzel SR, Sekhon JS et al (2019) Metalearners for estimating heterogeneous treatment effects using machine learning. Proc Natl Acad Sci 116(10):4156–4165
LaLonde RJ (1986) Evaluating the econometric evaluations of training programs with experimental data. Am Econ Rev 76(4):604–620
Liu J, Ma Y et al (2018) An alternative robust estimator of average treatment effect in causal inference. Biometrics 74(3):910–923
Loh WW, Vansteelandt S (2021) Confounder selection strategies targeting stable treatment effect estimators. Stat Med 40(3):607–630
Louizos C, Shalit U, et al. (2017) Causal effect inference with deep latent-variable models. In: Proceedings of Conference on Neural Information Processing Systems, pp 6446–6456
Luo W, Zhu Y (2020) Matching using sufficient dimension reduction for causal inference. J Business Econ Stat 38(4):888–900
Luo W, Zhu Y et al (2017) On estimating regression-based causal effects using sufficient dimension reduction. Biometrika 104(1):51–65
Ma S, Zhu L et al (2019) A robust and efficient approach to causal inference based on sparse sufficient dimension reduction. Annals Stat 47(3):1505
Maathuis MH, Colombo D (2015) A generalized back-door criterion. Annals Stat 43(3):1060–1088
Maathuis MH, Kalisch M et al (2009) Estimating high-dimensional intervention effects from observational data. Annals Stat 37(6A):3133–3164
Martens EP, Pestman WR et al (2006) Instrumental variables: application and limitations. Epidemiology 17(3):260–267
Nabi R, McNutt T, et al. (2017) Semiparametric causal sufficient dimension reduction of high dimensional treatments. http://arxiv.org/abs/1710.06727
Pearl J (2009) Causality. Cambridge University Press, Cambridge
Robins J (1986) A new approach to causal inference in mortality studies with a sustained exposure period-application to control of the healthy worker survivor effect. Math Modell 7(9–12):1393–1512
Rosenbaum PR, Rubin DB (1983) The central role of the propensity score in observational studies for causal effects. Biometrika 70(1):41–55
Rubin DB (1973) Matching to remove bias in observational studies. Biometrics 29:159–183
Rubin DB (1974) Estimating causal effects of treatments in randomized and nonrandomized studies. J Educ Psychol 66(5):688
Rubin DB (1979) Using multivariate matched sampling and regression adjustment to control bias in observational studies. J Am Stat Assoc 74(366a):318–328
Rubin DB (2007) The design versus the analysis of observational studies for causal effects: parallels with the design of randomized trials. Stat Med 26(1):20–36
Shalit U, Johansson FD, et al. (2017) Estimating individual treatment effect: generalization bounds and algorithms. In: Proceedings of International Conference on Machine Learning, pp 3076–3085
Shortreed SM, Ertefaie A (2017) Outcome-adaptive lasso: variable selection for causal inference. Biometrics 73(4):1111–1122
Shpitser I, VanderWeele T, et al. (2010) On the validity of covariate adjustment for estimating causal effects. In: Proceedings of the 26th Conference on Uncertainty in Artificial Intelligence, AUAI Press, pp 527–536
Spirtes P, Glymour CN et al (2000) Causation, prediction, and search. MIT press, Cambridge
Stuart EA (2010) Matching methods for causal inference: a review and a look forward. Stat Sci: Rev J Instit Math Stat 25(1):1–21
Team RC (2017) R: A language and environment for statistical computing. vienna, austria: R foundation for statistical computing; 2016
Van Der Laan MJ, Rubin D (2006) Targeted maximum likelihood learning. Int J Biostat 2(1):871
Van Der Laan MJ, Starmans RJ (2014) Entering the era of data science: targeted learning and the integration of statistics and computational data analysis. Advances in Statistics 2014:1–19
VanderWeele TJ, Shpitser I (2011) A new criterion for confounder selection. Biometrics 67(4):1406–1413
Wager S, Athey S (2018) Estimation and inference of heterogeneous treatment effects using random forests. J Am Stat Assoc 113(523):1228–1242
Witte J, Didelez V (2019) Covariate selection strategies for causal inference: classification and comparison. Biometrical J 61(5):1270–1289
Xie F, Cai R et al (2019) An efficient entropy-based causal discovery method for linear structural equation models with iid noise variables. IEEE Trans Neural Netw Learn Syst 31(5):1667–1680
Yadlowsky S, Namkoong H, et al. (2018) Bounds on the conditional and average treatment effect with unobserved confounding factors. http://arxiv.org/abs/1808.09521
Yao L, Li S, et al. (2018) Representation learning for treatment effect estimation from observational data. In: Proceedings of Conference on Neural Information Processing Systems, pp 2638–2648
Yoon J, Jordon J, et al. (2018) Ganite: Estimation of individualized treatment effects using generative adversarial nets. In: Proceedings of International Conference on Learning Representations, pp 1–22
Acknowledgements
We thank the action editor and the reviewers for their valuable comments. We wish to acknowledge the support from the Australian Research Council (under grant DP200101210) and the National Natural Science Foundation of China (under Grant 61876206). The first author was also supported by China Scholarship Council.
Funding
Open Access funding enabled and organized by CAUL and its Member Institutions.
Author information
Authors and Affiliations
Corresponding authors
Ethics declarations
Conflict of interest
The authors declare that they have no conflict of interest.
Additional information
Responsible editor: Sriraam Natarajan.
Publisher's Note
Springer Nature remains neutral with regard to jurisdictional claims in published maps and institutional affiliations.
Rights and permissions
Open Access This article is licensed under a Creative Commons Attribution 4.0 International License, which permits use, sharing, adaptation, distribution and reproduction in any medium or format, as long as you give appropriate credit to the original author(s) and the source, provide a link to the Creative Commons licence, and indicate if changes were made. The images or other third party material in this article are included in the article’s Creative Commons licence, unless indicated otherwise in a credit line to the material. If material is not included in the article’s Creative Commons licence and your intended use is not permitted by statutory regulation or exceeds the permitted use, you will need to obtain permission directly from the copyright holder. To view a copy of this licence, visit http://creativecommons.org/licenses/by/4.0/.
About this article

Cite this article
Cheng, D., Li, J., Liu, L. et al. Sufficient dimension reduction for average causal effect estimation. Data Min Knowl Disc 36, 1174–1196 (2022). https://doi.org/10.1007/s10618-022-00832-5
Received:
Accepted:
Published:
Issue Date:
DOI: https://doi.org/10.1007/s10618-022-00832-5