
Abstract
The increasing interest from technology enthusiasts and organisational practitioners in big data applications in the supply chain has encouraged us to review recent research development. This paper proposes a systematic literature review to explore the available peer-reviewed literature on how big data is widely optimised and managed within the supply chain management context. Although big data applications in supply chain management appear to be often studied and reported in the literature, different angles of big data optimisation and management technologies in the supply chain are not clearly identified. This paper adopts the explanatory literature review involving bibliometric analysis as the primary research method to answer two research questions, namely: (1) How to optimise big data in supply chain management? and (2) What tools are most used to manage big data in supply chain management? A total of thirty-seven related papers are reviewed to answer the two research questions using the content analysis method. The paper also reveals some research gaps that lead to prospective future research directions.
1 Introduction
The technologies continue to rapidly change to meet the 21st century corporate needs worldwide. With this growth, professionals from various organisations started to understand the values of applying big data concepts. One major value of applying big data analytics is to improve the process of making decisions on supply chain configurations (Gupta et al. 2019; Nguyen et al. 2018). Business entities are increasingly overwhelmed by the stream of endless data overflowing from an extensive range of channels. Companies that capitalise on such data and use it for decision-making end up gaining a competitive advantage, particularly streamlining their end-to-end supply chain functions(Govindan et al. 2018; Nguyen et al. 2018). Supply chain functions refer to procurement, manufacturing, warehousing, logistics and transportation, and demand management (Nguyen et al. 2018). For example, one value of applying big data in supply chain management (SCM) is to improve customers’ satisfaction by predicting orders, leading to reducing prices and control risks (Govindan et al. 2018).
The term “big data” can be defined as an increasingly growing volume of data from different sources with various structures that noticeably challenges industrial organisations on the one hand and presents them with a complex range of valuable storage and analysis capabilities on the other hand (Addo-Tenkorang and Helo 2016). Besides, big data comprises information collected from internet-enabled electronic devices such as tablets and smartphones, especially voice recordings, videos, and social media (Chen et al. 2015). “SCM” is generally defined as the management of relationship flow as well as the flow of material, information, and resources within and across a network, including upstream and downstream organisations (Rai 2019).
Big data is accelerating the evolution of supply chain design and management (Tao et al. 2018). Also, big data analytics can enhance capacity utilisation, enable companies to create new business models, improve customer experience, reduce fraud, improve supplier quality level, and expand end-to-end supply chain visibility facilitating prescriptive and predictive analytics (Zhan and Tan 2020). Top executives rely on big data analytics for decision-making to enhance visibility and provide more comprehensive insights on overall SCM. The large data sets with enhanced variability and variety are generated to enable analysts to identify any anomalies and patterns and make predictive insights to improve the SCM practice (Barbosa et al. 2018). Big data has enabled companies to adopt a responsive supply chain, especially understanding market trends and customer behaviours allowing them to predict demand in the market (Nguyen et al. 2018; Zhan and Tan 2020). Therefore, the effective utilisation of big data in supply chain operations leads to an increasing in the value of organisations by processing proper decisions (Govindan et al. 2018). The low uptake of big data analytics has been attributed to the firm’s minimal capacity to identify suitable data and data security threats.
In particular, the significant data optimisation foundation is to find an alternative means to achieve higher performance considering the cost-effective conditions. Also, optimisation means doing the best strategy related to a set of selected constraints, which include significant factors such as reliability, productivity, efficiency, longevity, strength, and utilization (Roy et al. 2018) introduced a survey that shows certain optimisation technologies and the associated useful applications for many organisations.
An example of using optimization in supply chain is found in Amazon, which has revolutionized the game by providing extremely fast delivery timeframes and alerts for projected delivery times and minute-by-minute tracking. Moreover, every step of UPS’s shipping process includes supply chain data analysis. As packages move through the supply chain, radars and sensors collect data. Big data tools then optimize the delivery routes to ensure that packages reach on time. Overall, UPS has saved 1.6 million gallons of gasoline in its trucks each year, greatly lowering delivery costs (Parmar 2021).
Therefore, some of the studies have proven the positive impacts of using big data on supply chain performance through case studies. In this regard, Nita (2015) by applying heterogeneous mixture learning to big data showed that systematization and accuracy increase in demand forecasting can decrease the distribution costs and disposal losses in the food supply chain. Papanagnou and Matthews-Amune (2018) through the use of the multivariate time series analysis technique (VARX) concluded that customer-generated content from various internet sources such as Google, YouTube, and newspapers can improve demand forecasting accuracy in the short term and response to demand volatility in retail pharmacy settings. Zhong et al. (2015) proposed an RFID-enabled approach to extract logistics data. Through case studies, they showed the feasibility and practicality of the proposed approach which can reveal rich knowledge for further advanced decision-makings like logistics planning, production planning and scheduling, and enterprise-oriented strategies. Lee et al. (2018) applied data mining and optimization methods to real-life cases from a liner shipping company considering weather data to optimize vessel speed, fuel cost, and service level. They demonstrated that this approach provides better fuel consumption estimates compared to the benchmark method which ignores the weather impact.
To help managers make better use of the available big data and obtain competitive advantages, a big data infrastructure is required. Managers require strategies to organise and combine diverse streams of data to build a coherent picture of a given situation, rather than simply generating enormous amounts of data using existing software (Tan et al. 2015). In addition, scientific methodologies are now necessary for storing, analysing, and displaying big data so that businesses may make benefit from the information assets that are available to them (Grover and Kar 2017; Roy et al. 2018) highlights some aspects of data management techniques that have been applied in SCM. For example, using Hadoop as a platform to manage massive data has been mentioned in this survey. However, we assume that some beneficial techniques can still manage and control big data aside from Hadoop.
As a result, big data management and big data optimisation are two essential pillars of using big data in SCM. Big data management refers to the infrastructures and frameworks to process and manage data as well as data storing tools and techniques. On the other hand, big data optimisation addresses the methods, techniques, and tools that can be applied to big data to make data-driven decisions leading to improvement in the performance of the supply chain. Moreover, it determines how and in what extent, big data can help a supply chain take advantage of the huge amount of its gathered data and transform it into valuable knowledge. Understanding how big data can be optimised and managed will reduce firms’ operational costs, given the improved track-and-trace capabilities and lower forecast errors, which help avoid lost sales and increase companies’ profit.
Therefore, understanding how big data can be optimised and managed can help reduce firms’ operational costs, given the improved track-and-trace capabilities and lower forecast errors, which help avoid lost sales. In particular, the significant data optimisation foundation is to find an alternative means to achieve higher performance considering the cost-effective conditions. Also, optimisation means doing the best strategy related to a set of selected constraints, which include significant factors such as reliability, productivity, efficiency, longevity, strength, and utilization (Roy et al. 2018) introduced a survey that shows certain optimisation technologies and the associated applications applicable in many organisations. It highlights some aspects of data management techniques that have been applied in SCM. For example, using Hadoop as a platform to manage massive data has been mentioned (Roy et al. 2018). However, we assume that some beneficial techniques can still manage and control big data aside from Hadoop.
Big data applications in SCM appear to be discussed and reported in the literature often; however, this topic has different angles which are not well defined. There are some fragmentation and missing coverage in the literature due to some reasons: (1) the supply chain scope has a major evolution over the last two decades from being synonymous with logistics (Cooper et al. 1997) to be a melting pot of primary and supporting activities, spanning everything from purchasing to operations management, logistics and transportation, distribution and retail, relationship management, and information technology (Giunipero et al. 2008); (2) different disciplines have handled SCM often, using various nomenclature, preventing the development of a unified body of knowledge (Maestrini et al. 2017); and (3) optimisation techniques and identifying the capabilities of big data technologies have rarely been studied in their entirety, but rather in parts and pieces, such as comprehensive classifying big data analytics in SCM in (Nguyen et al. 2018) or broadly discussing the technologies of managing the massive data (Gupta et al. 2019). The coverage of these topics often considers only one portion of its value in the supply chain, without in-depth discussion on the processes involved, the obstacles, and providing examples from the industry. Despite this, the academic literature lacks a complete summary of the issue.
Therefore, we conducted a systematic literature review that (1) investigates the tools and techniques of optimising big data in SCM, (2) provides comprehensive coverage of the applied big data management solutions in industries, and (3) summarises the potential solutions that may address the research gaps. The current systematic literature review provides an analysis of the literature contents, which is able to introduce a full picture of how big data is optimised and managed in SCM. To achieve the goals, this systematic literature review answers the following questions:
-
1)
How to optimise big data in SCM?
-
2)
What tools are most used to manage big data in SCM?
These two research questions have been addressed using the bibliometric analysis and content analysis methods. While the methodology reported in the review of (Nguyen et al. 2018), has provided robust steps to conduct the systematic review, they did not use bibliometric analysis that can assist in discovering the urgent and published areas of research. Instead, they used descriptive analysis to use a set of analytical and structural groups of a classification framework. (Gupta et al. 2019; Tiwari et al. 2018) also used descriptive analysis and (Arunachalam et al. 2018) employed both bibliometric and thematic analysis in their literature review. As mentioned by Govindan et al. (2018) and Mishra et al. (2018), bibliometric analysis is to suggest the urgent clusters and encourage scholars to further expand and collaborate the knowledge in the supply chain field. Thus, these limitations of the adopted methodology in (Nguyen et al. 2018) yield us to introduce our modification on it.
This paper aims to contribute to the development of big data in the supply chain, focusing on two major aspects of big data: big data management and optimisation. Also, to present what solutions, techniques, and tools have been utilised to optimise and manage big data contributing to the research field in SCM. This paper combines the coverage of two applications of big data management and optimisation which may affect the way we approach studying these technologies in SCM.
This paper contains three main sections apart from the introduction and the conclusion. Section two incorporates related work, research methodology of the systematic literature review, and bibliometric analysis of the literature. Section three presents findings and discussion on materials evaluation. Then a brief discussion on the major gaps and the future directions is presented in section four.
2 Research methodology
2.1 Related work
Based on our collections of articles related to big data applications in SCM, we created a small database of related review articles to compare between their scopes, research methodologies, and their coverage. Although there are several literature reviews of big data analytics in the area of SCM, the majority of them are based on SCM applications of big data analytics (Addo-Tenkorang and Helo 2016; Anitha and Patil 2018; Arunachalam et al. 2018; Barbosa et al. 2018; Brinch 2018; Chaudhuri et al. 2018; Chehbi-Gamoura et al. 2020; Govindan et al. 2018; Gupta et al. 2019; Mishra et al. 2018; Nguyen et al. 2018; Tiwari et al. 2018). Table 1 presents a summary of such studies, including the authors’ names, year of publication, and the main focus and the limitations of their work. Past literature has also been evaluated since it partially deals with big data applications in supply chain and emphasises its contributions to researchers’ grasp of supply chain. Although the past literature provides the essential initial points of our study, there are some identified limitations (in addition to the limitations shown in Table 1 for each study): (i) the methodology of the review and its steps are not well illustrated; (ii) a minimal literature review on supply chain performing cross-maps with big data optimisations techniques; and (iii) there is a lack of defining, comparing, and presenting big data management tools in SCM.
Consequently, the scope of this systematic literature review focuses on both big data management and optimisation studies in SCM in recent years that gives our work a novel multidimensional structure unlike previous literature reviews that mostly focused on big data analytics. We believe that this study will overcome these previous limitations by (i) introducing a definition of big data optimisation, and how big data is optimised, what techniques are used to optimise big data in supply chain and (ii) comparing the common tools of managing big data, and its applications in the industrial context. We adopted a review methodology and modified it by involving a reporting flowchart and content analysis method to provide useful insights to increase the reliability of our study and allow its adoption. Content analysis is also a systematic method that allows users to make correct inferences from a vocal, graphical, or structured text to define and measure certain occurrences y systematically and objectively (Downe-Wamboldt 1992).
2.2 Research methodology
In order to achieve this study’s objectives, the paper used an adopted systematic review methodology introduced by Nguyen et al. (2018). However, the methodology of Nguyen et al. (2018) lacks reporting the literature in a comprehensive approach and utilising textual analysis for the reported articles. Thus, the research methodology in this paper attempts to address these limitations in three points which are:
-
1
The research methodology involves only three main stages: collecting materials, bibliometric analysis, and categorising the documents.
-
2
The materials were assessed and evaluated during the collecting materials stage because we involved a reporting flowchart (PRISMA). The reporting flowchart is to enhance the quality of the tractability and reporting of the system (Moher et al. 2009). The reporting flowchart is preferred during the literature search process to record the included and excluded studies (Yang et al. 2017). The significance of PRISMA flow diagram lies in assessing the logical stages of the literature reporting process as well as defining the process boundaries (Vu-Ngoc et al. 2018). PRISMA is a 27-item checklist that covers the abstract, introduction, methodology, findings, and discussion of the paper to improve transparency in systematic reviews (Page et al. 2021). The reporting flowchart helps assess the materials and evaluate their inclusion or exclusion before analysing them, which has not been done in the methodology of (Nguyen et al. 2018).
-
3
Involving a bibliometric analysis of the collected documents to provide insights and meaningful information about these documents. The Bibliometrix R-package was chosen because it offers a variety of metrics for keyword analysis, author scientific publications, country-author collaborations, and a conceptual structure (Aria and Cuccurullo 2017). Bibliometrix R-package supports analysing the extracted materials from the three databases which are Scopus and Web of Science databases. Therefore, other applications of bibliometric analysis lack the combination between all three databases to perform such a comprehensive analysis.
2.2.1 Collecting materials
In this step, a process of searching and collecting materials relevant to the topic is involved. For building a database for the records obtained from the searching process, the PRISMA flowchart (Moher et al. 2009) is adopted to eliminate the observed results of documents based on certain criteria to build a database for the records obtained from the searching process. Notably, three main databases were used to collect research papers relevant to the scope of this literature. These databases are Scopus, ProQuest, and Web of Science, which are deemed as comprehensive and most powerful databases (Yang et al. 2017). Then, a distinguished set of keywords is identified in (Table 2) to synthesise the literature. Consequently, the keywords were grouped into two groups (A and B).
Group (A) contains keywords are to seek relevant records of big data and Group (B) consists of keywords are to find results pertinent to SCM. Most importantly, some of the keywords involve a wildcard (*) character to provide comprehensive results and include as many records as possible and avoid missing any relevant effect. Keywords from both groups (A) and (B) are joint using operator “AND” in the research, and operator “OR” used within the same group. Table 3 shows the three different strings that combine keywords from Table 2.
The search string differs from a database to another one because it is often difficult to reproduce the exact same query between databases. For example, some databases offer only searching in titles and abstracts but excluding the keywords such as ProQuest which may result in less detail of reporting the literature. However, full-text mining might be a useful option (Penning de Vries et al. 2020). There are at least two (not necessarily unique) methods of leveraging data and text mining to choose articles for additional review, as mentioned by (O’Mara-Eves et al. 2015) as cited in (Penning de Vries et al. 2020). The technique of extracting knowledge and structure from unstructured material is known as text mining (Hearst 1999). Though not yet firmly proven, text mining’s potential for automatically eliminating studies should be viewed as encouraging. It can be utilised with a high degree of confidence in highly technical and clinical domains, but additional research is needed in other fields for development and evaluation.
Another alternative is searching using subject headings which refers to regulated vocabulary terms, to identify the subject matter of an article (Guidance for students and staff: literature searching n.d.). Utilizing relevant subject headings may improve the search and enable one to locate additional details on the selected topic (Guidance for students and staff: literature searching n.d.).
The search is done based on all likely pairs between the two categories of keywords considering the four stages of PRISMA flowchart diagram as shown in Fig. 1.

PRISMA flowchart for reporting the results of searching documents of the literature
Identification stage
the first results by combining Group A and Group B keywords were 2963 from Scopus and 6842 documents from ProQuest and Web of Science databases, without any searching filters. After deleting the duplicates, 8090 documents were found.
Screening stage
using the document type filter in each database, we selected only peer-reviewed papers, final documents and, English writing published in the last ten years. The choice of the last ten years is because big data applications, especially big data analytics, became a phenomenon globally since 2011 (Nguyen et al. 2018). Thus, the excluded results were 6203, and 1887 documents were included screened. The results are only shown in the period of the last ten years. The purpose of this stage is to screen the documents to check their eligibility in the next stage.
Eligibility stage
in this stage, we chose only Computer Science, Administration, and Business subject areas for each document. This is to ensure the relevance of the documents to our scope. During this stage, there were 1773 excluded articles in different subjects’ areas that are not relevant to our topic and the research questions. Another exclusion reason is that documents from 2010 to 2014 did not clearly describe the application of big data optimisation and management in supply chain. Hence, only 114 records were included since they are in the same domain, Computer Science and Business, and in the period from 2015 to 20th of June 2021.
Inclusion stage
After the eligibility stage, we assessed each article of the 114 articles by reading the title, the abstract, the keywords, the objectives of the paper, and the conclusion. We found 77 papers that are irrelevant which we could not find our answers to the research questions. Thus, these 77 papers were removed, and only 37 peer-reviewed documents were included in our database. We then stored the relevant information to prepare it for bibliometric analysis.
2.2.2 Bibliometric analysis of the literature
This section presents a comprehensive bibliometric analysis to discover more about the previous studies associated with the relationship between big data optimisation and management in SCM. The bibliometric analysis was done using a bibliometric package embedded in the R language. The bibliometric package supports the process of importing data from different databases such as Scopus, Web of Science, and PubMed and assists researchers in building data metrics (Aria and Cuccurullo 2017). Before applying the analysis, the data file was processed to ensure that the necessary attributes are available. Some useful metrics can be found from the analysis and are presented in Figs. 2, 3, 4 and 5, and 6.
2.2.2.1 Insights of journals portfolios.
To understand the role of several journals found in the literature, we created a table of top ten journals that published articles in the field of big data and supply chain, but mainly related to our research focus which is optimization and management of big data. Table 4 shows the number of articlesFootnote 1 in each journal indicating the highest and lowest number of publications. All the journals are sorted by counting the number of publications. Interestingly, there is a lack of publications on our focus of big data optimization and big data management from year 2010 to 2013. However, from 2014, there has been an increase of publications, whereas the peak of publications was in 2018. Journals insights are helpful for whom interested publish in the future as it offers an overview of metrics of the research.
2.2.2.2 The number of annually published articles.
With a total of 37 papers published on this topic, Fig. 2 shows the annual number of articles published from 2015 to 2020 on big data applications in SCM. Noticeably, in 2018, the number of records increased dramatically to 12 documents.

Annual number of published articles from 2015 to 2020
2.2.2.3 The most common keywords.
Figure 3 (Words Cloud) shows the frequency of keywords used in the literature. For example, “big data,” “decision-making,” “manufacture,” “supply chains,” “big data applications,” “information management,” “data handling,” “data acquisition,” and “digital storage” are the hot spots of the research, which shows a high frequency mentioned in many studies. Interestingly, other keywords also have a remarkable frequency of appearance in the literature, which also could be helpful to answer the research questions such as “cloud computing,” “internet of things,” “artificial intelligence,” “data analytics,” and “industry 4.0”.

Words Cloud of the frequency of keywords
Figure 3 highlights the most common keywords discussed and studied by scholars in big data applications in SCM. The keywords “optimisation” and “big data management” have not been involved highly being focused on. The benefit of the words cloud is to show how many times a number of keywords have been involved in the research field. If there is a slight appearance of these keywords, this indicates a lack of literature on relevant topics.
2.2.2.4 Conceptual structure map and co-occurrence network.
The co-word analysis aims to represent the conceptual structure of a framework by relying on the co-occurrence. There are three various useful mapping types of the conceptual structure that can be generated from the conceptual structure-function. These are a conceptual structure map, factorial map of the highest cited documents, and a factorial map for the most contributed papers. This paper visualised a conceptual structure map (Fig. 4), which shows two clusters of the authors’ keywords. Authors’ keywords mean the keywords that have been noted by authors in their articles (Aria and Cuccurullo 2017). The two clusters are obtained by using the Multidimensional Scaling method (MDS). The two clusters are obtained by using the Multidimensional Scaling method (MDS). Both clusters indicate that the classified keywords are the most in the attention of big data and supply chain researchers. Both dimensions correspond to the most used keywords in SCM and represent those keywords from the big data analysis field.

Conceptual Structure Map using Multidimensional Scaling method (MDS)
The Keywords Co-occurrence Network (KCN) aims to focus on extracting the knowledge components from any scientific research through testing the links between the keywords found in the literature (Aria and Cuccurullo 2017). Figure 5 shows two clusters of the most occurrence keywords grouped in two different colours (red and blue), indicating these keywords’ frequent appearance between different types of studies.

Co-occurrence Network
2.2.2.5 Three-fields plot.
Figure 6 shows the visualisation of three main fields of the biography and the relationship between them using a Sankey diagram (Aria and Cuccurullo 2017). The left-field represents the keywords; the middle field shows authors, and the right field is for the most frequent words in the titles. Commonly, the “big data” keyword has been in the direction of several researchers. Meanwhile, “data,” “big,” “supply,” “analytics,” and “chain” are more used in the title of the papers. Figure 6 also helps identify the researchers’ focus on different aspects of SCM and applying big data analytics.

Three-field plot link between authors, titles, and keywords in the literature
Although Bibliometrix R-tool provided rich analysis for this study, there are other useful visualisation tools including Bibexcel, Gephi, Pajek, and VOSviewer (Donthu et al. 2021). As a result, relevant outcomes could be produced to offer solutions to certain study concerns. In addition, other bibliometric analysis methods, like citation analysis, could be used. A co-citation network is formed when two publications are connected when they are listed as references in another article. Co-citation analysis enables researchers to locate the most significant publications as well as learn about theme clusters (Donthu et al. 2021). Through the incorporation of additional categories of searched documents including business periodicals, case studies, and newspaper articles, a detailed assessment can be conducted in the near future by utilising more databases to obtain more data insights on the search themes (Alsolbi et al. 2022). In terms of the subject’s scope of study and scalability, expanding the types of papers and sources can be more beneficial.
2.2.3 Categories selection
The category selection step aims at using analytical categories and structural dimensions to conceptualise the classification framework (Nguyen et al. 2018). In this paper, two structural dimensions have been selected to create different layers of the framework: big data management and big data optimisation. For the dimension of big data management, two categories of data architecture and storing data techniques are considered. Based on the approach of papers, the dimension of big data optimisation is divided into two categories of big data impacts on supply chain performance and optimisation techniques and applications, as shown in Table 5.
In terms of supply chain functions, five main functions are procurement, manufacturing and production, logistics and transportation, warehousing, and demand management, as used in the review of (Nguyen et al. 2018). We also considered the general SCM for papers having a general perspective. The outcomes of the categorisation are shown in Table 4. Interestingly, most of these papers addressed big data optimisation and a small number of them dealt with both structural dimensions (Roy et al. 2018; Tan et al. 2015; Vieira et al. 2020; Zhong et al. 2016). Interestingly, most of these papers addressed big data optimisation, and a small number of them dealt with both structural dimensions.
3 Findings and discussion
Several studies on big data applications involve the processes of collecting, processing, analysing, and visualising beneficial information through technical means associated with machine learning. Some useful articles and reviews introduced different searching models, classification frameworks, empirical studies, surveys, and literature reviews. Both studies (Grover and Kar 2017; Nguyen et al. 2018) encouraged us to study more about big data applications in the supply chain domain.
However, conducting big data studies can be challenging as technology is evolving rapidly. With regards to supply chain functions, which are procurement, manufacturing, warehousing, logistics and transportation, and demand management (Nguyen et al. 2018), there are only a few studies that sought to tackle the optimisation approaches such as routing and order-picking challenges in warehousing by the use of big data. Such problems have been frequently addressed using mathematical modelling, simulation, and heuristic and metaheuristic solution algorithms (Ardjmand et al. 2020; Cano et al. 2020; Schubert et al. 2020; (Shavaki and Jolai 2021a, b). The review indicated that there is little known of real-time optimisation models to enhance the effectiveness of the production and logistics process (Nguyen et al. 2018). There is a shortage of studies on how big data can be managed in the supply chain. There are conceptual models of data infrastructure, big data management solutions, and proposed approaches to tackle the huge amount of big data.
To better answer the research questions in this paper, we reviewed and analysed each paper’s main work, the contribution to the research field, and synthesised it with other similar articles.
3.1 How to optimise big data in SCM?
The usage of big data in SCM allows businesses to gain a variety of short-term advantages in their operations (Chen et al. 2015). For instance, analysing point of sale data can help with pricing and special services for each customer group, while analysing inventory and shipping data can minimise lead times and increase product availability, and consequently increase sales amount (Chen et al. 2015), the optimisation of quality-product trade-off can help in producing high-quality products with lower costs (Mubarik et al. 2019). Moreover, the use of Radio Frequency Identification (RFID) can help small markets in improving the decision-making process in logistics functions (Navickas and Gruzauskas 2016). Behavioural analytics and fraud detection solutions are the other applications of big data in SCM (Patil 2017).
The research question sought to investigate how big data in the supply chain can be optimised. To answer this question, we firstly review previous studies on the effects of big data usage on supply chain performance to clarify big data’s potential to improve and facilitate SCM, and then we will elaborate on big data optimisation in SCM. Several scholars have empirically investigated the impacts of using big data on the performance of supply chain by using statistical methods in a generic supply chain (Chen et al. 2015; Gunasekaran et al. 2017; Hofmann and Rutschmann 2018). Also, researchers have studied the effects of applying big data in a specific industry, such as food and beverage supply chains (Irfan and Wang 2019), pharmaceutical industry (Asrini et al. 2020; Shafique et al. 2019), oil and gas industry (Mubarik et al. 2019), services and humanitarian supply chains (Dubey et al. 2018; Fernando et al. 2018), and mining and minerals industry (Bag 2017).
Chen et al. (2015) investigated the influence of big data analytics (BDA) usage on organisational performance considering both the antecedents and consequences of the BDA usage through a TOE (technology organisation environment) framework. Their findings showed that BDA has a positive impact on both asset productivity and business growth.
Irfan and Wang (2019) looked at how data-driven capabilities affected supply chain integration and firm competitiveness in Pakistan’s food and beverage industry. They adopted the structural equation modelling approach to test their hypotheses on collected survey data. Asrini et al. (2020) investigated the effects of supply chain integration, learning, big data analytics capabilities, and supply chain agility on the firm’s performance by the use of structural equation modelling approach in the pharmaceutical companies in Indonesia. (Mubarik et al. 2019) explored the influence of big data supply chain analytics and supply chain integration on supply chain efficiency across the board, including forecasting and supplier management, sourcing, production, inventory management, and transportation. To measure the relationships, they used covariance-based structural equation modelling.
Fernando et al. (2018) also used structural equation modelling to investigate the effects of big data analytics on data protection, innovation capacity, and supply chain efficiency. Dubey et al. (2018) used the ordinary least square regression to test the impact of big data and predictive analytics on visibility and coordination in humanitarian supply chains. Shafique et al. (2019) used partial least square structural equation modelling (PLS-SEM) to investigate the relationship between big data predictive analytics acceptance and supply chain success in the pharmaceutical logistics industry in China. They also used the” variance accounted for” form of mediation to assess the role of RFID technology in mediation.
Bag (2017) employed partial least square regression analysis to examine the correlation between buyer-supplier relationships, big data and prescriptive analytics, and supply chain performance in managing supply ambiguities in companies of mining and minerals manufacturing in South Africa. Hofmann (2017) focused on how big data could be used to optimise supply chain processes by reducing the bullwhip effect. He used an existing system dynamics model to simulate the effects of big data levers such as velocity, length, and variety on the bullwhip effect in a two-stage supply chain, taking into account several starting points derived from previous research. The results revealed that the lever velocity has a great potential to enhance the performance in the supply chain.
In addition to the studies mentioned above that demonstrate the positive impact of big data on supply chain performance, the systematic literature review proved that big data optimisation is widely applied in all functional areas within SCM. In demand management, Nita (2015) systematised demand forecasting using heterogeneous mixture learning technology in the food supply chain. Hofmann and Rutschmann (2018) studied the impacts of big data analytics on demand forecasting accuracy. Papanagnou and Matthews-Amune (2018) proposed using the VARX model to evaluate the impact of independent variables obtained from various internet-based sources on inhibitory sales trends data to improve forecasting accuracy. Boone et al. (2019) provided an overview of how customer insights focused on big data and related technologies could improve supply chain sales forecasting.
In logistics and transportation, companies prefer optimisation as a suitable approach since it strengthens predictive analytics (Nguyen et al. 2018). In this regard, a holistic Big Data approach was proposed by Zhong et al. (2015) to mine massive RFID-enabled shop floor logistics data for the frequent trajectory to quantitatively evaluate logistics operations and machines. Another experimental study to obtain a decision support optimisation in logistics has been introduced by the authors of Lee et al. (2018). They relied on weather historical big data to decide the optimal speed that reduces the fuel consumption while vessels are serving. They proposed a novel approach to parse weather data and use data mining techniques to learn about the influence of the weather on fuel consumption. The results of their experiment showed that better fuel consumption obtained forecasts from fuel consumption function. Also, suggested routes are introduced in the study to provide enhanced decisions. These studies contributed to adding examples of how big data can be optimised, relying on logistics issues.
In manufacturing and production, there is a growing interest among scholars to investigate the real-time optimisation models to enhance the effectiveness of the production processes. Simulation and modelling are increasingly being adopted in the development of real-time manufacturing control systems whereby tracking devices like RFID and sensors provide a sufficient and consistent flow of instantaneous data (Zhong et al. 2015). In their study, Ji et al. (2017) used a Bayesian network to create a cause-and-effect relationship between the data to forecast direct food production and market demand accurately. As another big data application, IoT is involved in SCM because it helps in improving operational efficiencies and creating opportunities for cutting costs in the sourcing, procurement, production, and distribution processes (Aryal et al. 2018; Kim 2017). Adopting IoT in SCM is already applied in many companies such as United Parcel Service (UPS), which reduced the idling time and costs of services (Aryal et al. 2018). The installation of sensors in products can help a company to trace the movement of all the goods from the warehouse to the customer through interconnected devices. Effective inventory management is enhanced by IoT as embedded technology on items communicates and gives alerts on lead times, stock-outs, and product availability (Aryal et al. 2018; Barbosa et al. 2018).
The systems and equipment in the network can respond by initiating another manufacturing process or triggering procurement requests to the raw material’ suppliers in case of low stock. Furthermore, there are still few studies on improving order-picking processes such as sorting, routing, and batching by using big data optimisation.
In terms of big data models, it is evident from the trend assessment that prescriptive analytics appears in more frequently published literature in the management of big data analytics-driven SCM compared to predictive and descriptive analytics. One of the reasons is that predictive analytics has become mainstream in most areas, and domain-related scholarly publications are limited. That does not mean that predictive analytics is out. Seyedan and Mafakheri (2020) provide an overview of predictive BDA for the supply chain, including customer analysis, demand prediction, and trend analysis. Demand forecasting in closed-loop supply chains is regarded as one area in demand in both research and practice. Likewise, the application of IoT devices in conjunction with AI and analytical approaches also has significant potential.
Regarding predictive analytics, time series, deep learning, machine learning (e.g., support vector machines), models for demand forecasting and classification are some of the predominant approaches being applied in production to improve planning and control and equipment maintenance in the manufacturing process.
Furthermore, classification is a critical big data analytics model that helps in improving procurement research and logistics. Critically, the association is a popular model used in descriptive analytics, and it is usually applied across the diverse functional areas in the supply chain from procurement, warehousing, logistics, to demand management. Similarly, in most of the studies reported in the literature of (Nguyen et al. 2018), the visualisation model is treated less significantly mostly as a supplement of other state-of-the-art data mining models. The literature review of Govindan et al. (2018) presented opportunities of how big data can be collected from different sources, such as ERP systems, logistics and orders, newsfeeds, manufacturing environment, surveillance videos, radio frequency-based identification tracking, customers behaviours patterns, and product lifecycle operations. Dealing with the massive datasets leads researchers to consider techniques of optimising big data (Govindan et al. 2018). The findings of this study show that optimising big data in SCM has many benefits, including cost reduction. Noticeably, this paper stated comprehensively what chances and places where optimisation can occur; however, there is still a gap in covering how big data can be optimised with the introduced technologies in this paper.
Hofmann and Rutschmann (2018) presented a table of advanced applications of analytics to enhance the predictions in supply chain retail through some optimisation tools. These optimisation tools, such as a price optimisation tool, optimise forecasting of amounts of cashiers relying on the number of visitors of a store. Doolun et al. (2018) presented one other interesting study of optimisation in the supply chain, which applies a data-driven hybrid analytical approach to overcome a supply chain location-allocation problem with four echelons. The main problem they focused on is to find the locations of warehouses and plants that should be operating with minimum costs of supply, considering the requirement of maximising the customer demands. A data-driven analytical hybrid NSDEA algorithm was involved in this experiment to select the best control variables. Therefore, they chose five variant of hybrid algorithms that were validated to locate the number of warehouses and plants among different sites. The study concludes that NSDEA is one of the powerful tools that can be considered to determine the solutions of that case of the Malaysian electronic auto parts supply chain.
Lamba and Singh (2018) used three separate multi-criteria decision- making (MCDM) techniques to inve(Lamba and Singh 2018)stigate the relationships between big data enablers in operations and SCM, including interpretive structural modelling, fuzzy complete interpretive structural modelling, and decision-making trial and evaluation laboratory.
Liu and Yi (2018) examined the issues surrounding big data information (BDI) investment decision-making and its implications for supply chain coordination. They looked at a supply chain with a producer and a retailer, with the manufacturer as the leader of the Stackelberg Game, determining the wholesale price, and the retailer as the follower, deciding the order quantity. Based on the Stackelberg Game philosophy and teamwork theory, four BDI investment modes and a coordination tactic have been proposed to evaluate the value of the supply chain after investing in BDI in each investment mode. This paper provides theoretical guidance for supply chain managers about BDI investment decisions and their consequences.
An optimisation experiment done by Zhao et al. (2017) presents a multi-objective model for managing a green supply chain scheme to minimise the risks as a result of hazardous materials, carbon emission, and economic costs. Big data analytics were used to capitalise on the model parameters. In the model, they had adopted three scenarios (aimed to reduce the hazardous materials, carbon, and economic costs) to improve the process of the green supply chain. Results show that reducing carbon risks and emissions can be determined through optimisation. Although this study is relevant to our questions, the authors did not mention in detail what was done to optimise big data in this study. The big data term mentioned in the paper was to extract the parameters-related data. Involving big data analytics in supply chain optimisation is a standard experiment however, steps of how big data was analysed to lead to an optimised approach is crucial to add to the literature and provide an adequate answer.
As a summary of the findings this section, Table 6 displays a list of applied research methods and tools in the reviewed papers to optimise big data in the SCM field. From this table, optimisation methods have been used more than the other techniques in this area.
While this paper is about big data optimisation, and management in SCM, the review would not be complete without some pertinent comments about other frameworks that have approached SCM. One such framework is using system models. System modelling approaches such as system dynamics (Feng 2012; Rabelo et al. 2011), agent-based modelling (Arvitrida 2018; Behdani et al. 2013), and network modelling are frequently employed in supply chain modelling, analysis, and optimisation. These techniques have been applied to small data. When it comes to big data, these techniques could still prove to be useful in helping define conceptual models, thereby enabling better model building with big data. Although previous studies addressed big data optimisation in various problems either within a general supply chain or in a specific function and demonstrated the capabilities of big data to improve supply chain performance, there are still gaps in the literature that need to be dealt with. We discussed these gaps in Sect. 4.
3.2 What tools are most used to manage big data in SCM?
As the second research question, the literature review sought to summarise big data management tools and technologies among supply chain organisations. Table 7 shows the main work and ideas of reviewed papers in big data management. It is evident that big data management conceptual models, and infrastructures of storage of vast amounts of data remain challenging for many organisations.
With the development of industry 4.0 in the business world, every object linked with a supply chain is continuously generating data in structured (data generated with the formal structure like records, files, docs, and tables), semi-structured (data contains distinct semantic elements but does not have formal nature), or unstructured (data without any identifiable formal structure such as blogs, audio, video, image, etc.) forms Biswas and Sen (2016). Big data experts believe that, in the next coming years, unstructured data will be the major proportion of the total generated data (Zhan and Tan 2020). For example, data collected from a variety of sources, such as sensors and digital cameras, in the service and manufacturing industries are usually unstructured, heterogeneous, incompatible, and non-standardised (Zhong et al. 2016). To cope with these difficulties, companies must pre-process the unstructured data and develop a shared data warehouse to store relatively homogeneous information (Lamba and Singh 2017). The availability of a large amount of data gathered from various sources has increased the risk of privacy and security of data (Fernando et al. 2018).
However, big data analysis platforms and tools have enabled managers to examine large data sets in all forms to discover useful information such as hidden patterns and market trends, helping organisations improve business decision-making (Grover and Kar 2017). For instance, Papanagnou and Matthews-Amune (2018) investigated the use of structured data from sales in conjunction with non-structured data from customers to enhance inventory management. Biswas and Sen (2016), in their Big Data architecture, addressed both structured and unstructured data so that the structured data was derived by extract transform and load (ETL) mechanisms and is populated into a data warehouse. The unstructured data was managed by the Hadoop Distributed File System (HDFS) and MapReduce systems of the Hadoop cluster and is also stored in the NoSQL database. Tan et al. (2015) (which presented analytics infrastructure framework) tried to harvest available unstructured data of company SPEC (a leading eyeglasses manufacturer in China) to create ideas for new products’ innovation and operations improvement. This company uses Apache Mahout for machine learning algorithms, Tableau for big data visualisation, Storm for analysing real-time computation systems, and InfoSphere for big data mining and integration. Zhan and Tan (2020) analysed the unstructured data generated from multiple sources of LLY Company (a leading Chinese athletics products – shoes and sporting equipment – manufacturer on a global scale). This company uses the main technologies of big data such as Hadoop, HBase, and Spark SQL.
It is stated by Tan et al. (2015) that the existing software remains challenging for managing a massive amount of data. Data varies in its types and resources, leading to difficulty generalising the analytics tools and management systems. Despite the overwhelming task of collecting and assessing the voluminous data, top management must prioritise the use of big data analytics to enhance SCM. There are big data management tools that can be applied to supply chain analytical operations, such as Hadoop, which is an open-source platform for performing analyses on stored data (Grover and Kar 2017). Since there are many challenges in storing big data, using Apache Storm is beneficial in supply chain networks. Apache Storm is an open-source framework that provides a streaming process linked to clustering data (Grover and Kar 2017).
Despite the various big data management technologies, organisations of the supply chain, which aim to apply technologies of big data management, may face critical issues when selecting a suitable platform. Table 8 shows the most reported big data management tools that have been most cited in the literature.
Another important concern of the managers is the potential of these platforms to be used in different data life cycle phases from generation to destruction. (Chen and Zhao 2012) divided data life cycle into seven stages including data generation, transfer, use, share, storage, archival and destruction. Table 6 also displays each platform can be used in what stages. Interestingly, it was noted by Tan et al. (2015) that analytics infrastructure is required to structure and relate different bunches of information to the objectives.
Tan et al. (2015) summarised the analytic techniques into four main categories: Burbidge’s connectome Concept, Influence diagram, Cognitive Mapping and Induction Graph. They also described each of these techniques, their strengths, their weaknesses, and useful software. Finally, they proposed an analytics infrastructure framework using deduction graph techniques to assist managers in decision-making process (Fig. 7). By applying this framework to the SPEC company, the results were in the preference of SPEC executives. The framework would help managers to build a visual decision path that captures the logic behind the number of decisions taking during the competence set method for evaluating. The significance of this framework is counted in a better approach to structure the data and connect the different streams of data to build a coherent picture of a specific problem.
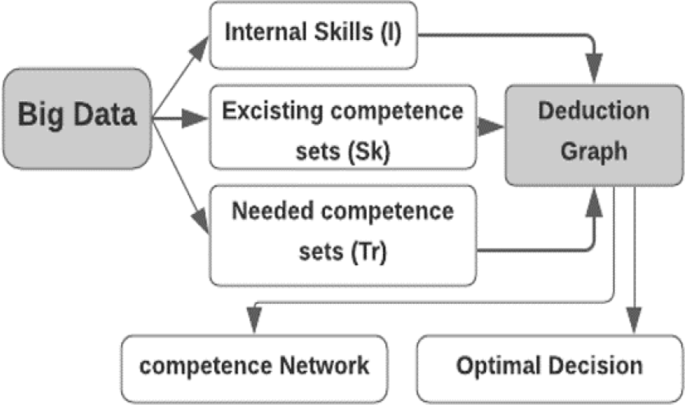
The adopted analytics infrastructure framework (Tan et al. 2015)
Different big data tools offer different services for end users, which may offer different capabilities of analysing and managing data in SCM. This study reports some of big data tools being used in SCM during the period from 2010 to 2021, however; there are expected new tools and enhancements that leverage the capabilities of big data analytics and management tools in SCM. Firstly, the development of open-source machine learning and data mining libraries in recent years has contributed to the success of big data platforms like Spark, Hadoop, Flink, and others (Mohamed et al. 2020). However, numerous efforts have been undertaken to build cloud computing technologies because of the amazing characteristics of cloud computing, including its pervasive service-oriented nature and elastic processing capacity (Mohamed et al. 2020). Another point is that big data tools remain mysterious for many users (Mohamed et al. 2020). To bridge the gap between big data systems and their users, a user-friendly visualisation technique is required. The visualisation technique should present the analytic results to users in such a way that they can effectively identify the interesting results (Mohamed et al. 2020).
4 Research gaps and future direction
Based on the findings, there is a need to conduct further empirical studies on how big data analytics can be optimised and managed in SCM. Our study revealed three certain gaps in the research conducted on the optimisation and management of big data in SCM. We expressed our understanding of these three gaps based on our analysis of the documents’ records, citations, and keywords in Section two and our findings and discussion in Section three.
We summarized research gaps and possible directions that tackle these gaps in Table 9. One of the main identified gaps in the available literature in both dimensions of big data management and big data optimisation in the SCM is the lack of case studies and practical examples. The reason is that the implementation of big data-related techniques in the SCM has several challenges. One of the challenges is to optimise the hardware and software setup to balance cost and performance. Conducting an empirical study to optimise the setup is not cost-effective; it is time-intensive and difficult to control. As a result, simulation-based methods are a viable alternative (Tiwari et al. 2018). Privacy, security, and quality of data (Richey et al. 2016), data acquisition continuity, data cleansing, and data standardising (Raghupathi and Raghupathi 2014) are mentioned as the other challenges.
Despite technological and data quality concerns, organisations cited culture and managerial issues as major roadblocks (Arunachalam et al. 2018). On the other hand, while the computational technology required to manage and optimise big data are progressing, the human expertise and abilities required by business executives to use big data are lagging behind, posing another significant challenge (Barbosa et al. 2018) in this area.
Due to all of these challenges as well as the lack of interest among business managers to publish their projects in peer-reviewed journals and conferences, there is a gap in scientific publications including practical examples. To void this gap, maturity models can assist organisations in assessing their existing technological capability in comparison to industry standards (Arunachalam et al. 2018) and identifying the requirements for progressing their big data projects. Cross collaboration among firms in the supply chain is the other alternative to overcome the challenge (Tiwari et al. 2018). Finally, partnership between academics and supply chain executives is suggested to enhance the achievements of real-world projects and enrich scientific publications.
5 Limitations of the review
There are several flaws in the literature review. The explorative technique, for example, exposes the study to subjective bias, despite the fact that the exploratory review process ensures a thorough examination of the research issue. There is a vast amount of secondary data available from a variety of databases that may be analyzed to further research goals and lay the groundwork for future investigations. Scopus, Web of Science, and ProQuest were the only databases used in this study. Some papers, however, may have been overlooked if the source was not found in these databases. Another constraint is that the sources were limited to those publications that appeared between 2010 and 2021. More findings may have been achieved if the chosen period had been longer. Other terminology, such as “decision making” or “empowered data,“ may arise in studies focusing on non-profits. However, there may be literature in this research topic that is irrelevant. Because the goal was to produce particular results that matched the keyword lists, extending the period was not considered.
6 Conclusion
This paper adopts the content analysis methodology to conduct the systematic literature review, whereby 37 journal articles were definitively relied upon on the search strategy to offer a comprehensive outlook of how big data has been optimised in SCM. Also, we reviewed technologies mostly used for big data management in SCM. It is indisputable that big data is extensively managed and optimised in supply chain functional areas to enhance organisational effectiveness. Therefore, companies need to ensure proper management of big data applications and related infrastructure. Different levels of big data optimisation and management techniques are used to ensure effective and seamless supply chain operations. Nonetheless, the review and discussion of findings reveal several research gaps that require further studies to fill the void and develop the topic. Although technologically and organisationally challenging, it is very important to publish papers including case studies and practical examples to show the effectiveness and outcomes of optimising big data in real-world supply chains. The other pressing area for future studies is managing and optimising unstructured data and take advantage of the huge amount of data that is continuously generated by various data sources in supply chains. These issues can be addressed by the cooperation between supply chain managers and academic researchers, improving the culture of managers to accept and employ new technologies, and enhance the skills of employees.
Furthermore, the literature review has several limitations; for instance, the use of exploratory methodology makes the study to be prone to subjective bias. By the way, the exploratory review method is significant since it ensures a comprehensive analysis of the research topic. Besides, it is a flexible and inexpensive method for answering the research questions. There is a massive volume of secondary data from numerous databases that can be examined to achieve the research objectives and lay the foundation for future studies based on the gaps identified.
Change history
17 July 2023
Process all figures in colour.
Notes
There are articles that have no insights from their journals. Thus, only 26 articles found and reported their journal insights.
References
Addo-Tenkorang R, Helo PT (2016) Big data applications in operations/supply-chain management: a literature review. Computers and Industrial Engineering 101:528–543
Alsolbi I, Wu M, Zhang Y, Joshi S, Sharma M, Tafavogh S, Sinha A, Prasad M (2022) Different approaches of bibliometric analysis for data analytics applications in non-profit organisations. J Smart Environ Green Comput 2(3):90–104
Anitha P, Patil MM (2018) A review on Data Analytics for Supply Chain Management: a Case study. Int J Inform Eng Electron Bus 11(5):30
Ardjmand E, Ghalehkhondabi I, Young W, Sadeghi A, Sinaki R, Weckman G (2020) A hybrid Artificial neural network, genetic algorithm and Column Generation Heuristic for minimizing Makespan in Manual Order picking Operations. Expert Syst Appl vol:113566
Aria M, Cuccurullo C (2017) bibliometrix: an R-tool for comprehensive science mapping analysis. J Informetrics 11(4):959–9754
Arunachalam D, Kumar N, Kawalek JP (2018) Understanding big data analytics capabilities in supply chain management: unravelling the issues, challenges and implications for practice. 114:416–436Transportation Research Part E-Logistics and Transportation Review
Arvitrida N (2018) A review of agent-based modeling approach in the supply chain collaboration context vol, vol 337. IOP Publishing, p 012015
Aryal A, Liao Y, Nattuthurai P, Li B (2018) The emerging big data analytics and IoT in supply chain management: a systematic review. Supply Chain Management 25(2):141–1562
Asrini M, Setyawati Y, Kumalawati L, Fajariyah NA (2020) Predictors of firm performance and supply chain: evidence from indonesian Pharmaceuticals Industry. Int J Supply Chain Manage 9(1):1080
Bag S (2017) Big Data and Predictive Analysis is key to Superior Supply Chain performance: a south african experience. Int J Inform Syst Supply Chain Manage 10(2):66–842
Barbosa MW, Vicente AdlC, Ladeira MB, Oliveira MPVd (2018) Managing supply chain resources with Big Data Analytics: a systematic review. Int J Logistics 21(3):177–200
Behdani B, Van Dam K, Lukszo Z (2013) Agent-based models of supply chains, Agent-based modelling of socio-technical systems. Springer, pp 151–180
Bharathy GK, Silverman B (2013) Holistically evaluating agent-based social systems models: a case study. Simulation 89(1):102–1351
Biswas S, Sen J (2016) A proposed Architecture for Big Data Driven Supply Chain Analytics. IUP J Supply Chain Manage 13(3):7–333
Boone T, Ganeshan R, Jain A, Sanders NR (2019) Forecasting sales in the supply chain: consumer analytics in the big data era. Int J Forecast 35(1):170–180
Brinch M (2018) Understanding the value of big data in supply chain management and its business processes. Int J Oper Prod Manage 38(7):1589–16147
Cano JA, Correa-Espinal AA, GГіmez-Montoya RAs (2020) Mathematical programming modeling for joint order batching, sequencing and picker routing problems in manual order picking systems. J King Saud Univ - Eng Sci 32(3):219–228
Cassandra A (2014) ‘"Apache cassandra.“ ‘, Series “Apache cassandra.“ <http://planetcassandra.org/what-is-apache-cassandra
Chaudhuri A, Dukovska-Popovska I, Subramanian N, Chan HK, Bai R (2018) Decision-making in cold chain logistics using data analytics: a literature review. Int J Logistics Manage 29(3):839–861
Chehbi-Gamoura S, Derrouiche R, Damand D, Barth M (2020) Insights from big data analytics in supply chain management: an all-inclusive literature review using the SCOR model. Prod Plann Control 31(5):355–382
Chen D, Zhao H (2012) Data Security and Privacy Protection Issues in, pp. 6457 – 651
Chen X, Ong Y-S, Tan P-S, Zhang N, Li Z (2013) Agent-based modeling and simulation for supply chain risk management-a survey of the state-of-the-art IEEE, pp. 1294–9
Chen DQ, Preston DS, Swink M (2015) How the use of big data analytics affects value creation in supply chain management. J Manage Inform Syst 32(4):4–39
Cooper MC, Lambert DM, Pagh JD (1997) Supply Chain Management: more than a New Name for Logistics. Int J Logistics Manage vol 8(1):1–141
de Penning BBL, van Smeden M, Rosendaal FR, Groenwold RHH (2020) Title, abstract, and keyword searching resulted in poor recovery of articles in systematic reviews of epidemiologic practice. J Clin Epidemiol 121:55–61
Dean J, Ghemawat S (2008) MapReduce: simplified data processing on large clusters. Commun ACM vol:107–113
Donthu N, Kumar S, Mukherjee D, Pandey N, Lim WM (2021) How to conduct a bibliometric analysis: an overview and guidelines. J Bus Res 133:285–296
Doolun IS, Ponnambalam SG, Subramanian N, Kanagaraj G (2018) Data driven hybrid evolutionary analytical approach for multi objective location allocation decisions: automotive green supply chain empirical evidence. Computers and Operations Research 98:265–283
Downe-Wamboldt B (1992) Content analysis: method, applications, and issues. Health Care for Women International. vol 13, 0739–9332 (Print). 0739–9332 (Print), pp. 313 – 21
Dubey R, Luo Z, Gunasekaran A, Akter S, Hazen BT, Douglas MA (2018) Big data and predictive analytics in humanitarian supply chains. Int J Logistics Manage 29(2):485–5122
Feng Y (2012) System Dynamics Modeling for Supply Chain Information Sharing. Physics Procedia. vol 25, pp. 1463-9
Fernando Y, Ramanathan RMC, Ika S, Wahyuni TD (2018) Benchmarking vol 25(9):4009–4034The impact of Big Data analytics and data security practices on service supply chain performance
Giunipero L, Hooker R, Joseph-Mathews S, Yoon T, Brudvig S (2008) A decade of SCM Literature: past, Present and Future Implications. J Supply Chain Manage 44:66–86
Govindan K, Cheng T, Mishra N, Shukla N (2018) Big data analytics and application for logistics and supply chain management. Transportation Research Part E-Logistics and Transportation Review. vol 114, pp. 343-9
Grover P, Kar AK (2017) Big data analytics: a review on theoretical contributions and tools used in literature. Global J Flex Syst Manage 18(3):203–229
Gunasekaran A, Papadopoulos T, Dubey R, Wamba SF, Childe SJ, Hazen B, Akter S (2017) Big data and predictive analytics for supply chain and organizational performance. J Bus Res 70:308–317
Gupta S, Altay N, Luo Z (2019) Big data in humanitarian supply chain management: a review and further research directions. Ann Oper Res 283(1–2):1153–1173
Hearst MA (1999) Untangling text data mining. In: Proceedings of the 37th Annual meeting of the Association forComputational Linguistics, pp. 3–10
Hofmann E (2017) Big data and supply chain decisions: the impact of volume, variety and velocity properties on the bullwhip effect. Int J Prod Res vol 55(17):5108–5126
Hofmann E, Rutschmann E (2018) Big data analytics and demand forecasting in supply chains: a conceptual analysis. Int J Logistics Manage vol 29(2):739–7662
Irfan M, Wang M (2019) Data-driven capabilities, supply chain integration and competitive performance: evidence from the food and beverages industry in Pakistan. Br Food J 121(11):2708–272911
Ji G, Hu L, Tan KH (2017) A study on decision-making of food supply chain based on big data. J Syst Sci Syst Eng 26(2):183–1982
Kiisler A, Hilmola O-P (2020) Modelling wholesale company’s supply chain using system dynamics. Transp Telecommunication 21(2):149–1582
Kim NH (2017) Design and implementation of Hadoop platform for processing big data of logistics which is based on IoT. Int J Serv Technol Manage 23(1–2):131–153
Lamba K, Singh SP (2017) Big data in operations and supply chain management: current trends and future perspectives. Prod Plann Control 28:11–12
Lamba K, Singh SP (2018) Modeling big data enablers for operations and supply chain management. The International Journal of Logistics Management. vol
Lee H, Aydin N, Choi Y, Lekhavat S, Irani Z (2018) A decision support system for vessel speed decision in maritime logistics using weather archive big data. Computers and Operations Research 98:330–342
Liu P, Yi S-p (2018) A study on supply chain investment decision-making and coordination in the Big Data environment. Annals of Operations Research. vol 270, 1. 1, pp. 235 – 53
Macal C, North M (2009) Agent-based modeling and simulation
Maestrini V, Luzzini D, Maccarrone P, Caniato F (2017) Supply chain performance measurement systems: a systematic review and research agenda. Int J Prod Econ 183:299–315
Mishra D, Gunasekaran A, Papadopoulos T, Childe SJ (2018) Big Data and supply chain management: a review and bibliometric analysis. Annals of Operations Research. vol 270, 1–2. 1–2, pp. 313 – 36
Mohamed A, Najafabadi MK, Wah YB, Zaman EAK, Maskat R (2020) The state of the art and taxonomy of big data analytics: view from new big data framework. Artif Intell Rev vol 53(2):989–10372
Moher D, Liberati A, Tetzlaff J, Altman D (2009) Preferred reporting items for systematic reviews and meta-analyses: the PRISMA statement. BMJ. vol 339, p. b2535
Mubarik M, Zuraidah R, Rasi B (2019) Triad of big data supply chain analytics, supply chain integration and supply chain performance: evidences from oil and gas sector. 7(4):209–224Humanities and Social Sciences Letters
Navickas V, Gruzauskas V (2016) Big Data Concept in the food supply chain: small market case. Sci Annals Econ Bus 63(1):15–281
Nguyen T, Zhou L, Spiegler V, Ieromonachou P, Lin Y (2018) Big data analytics in supply chain management: a state-of-the-art literature review. Computers and Operations Research 98:254–264
Nita S (2015) Application of big data technology in support of food manufacturers’ commodity demand forecasting. NEC Tech j 10(1):90–931
O’Mara-Eves A, Thomas J, McNaught J, Miwa M, Ananiadou S (2015) Using text mining for study identification in systematic reviews: a systematic review of current approaches. Syst Reviews 4(1):5
Page MJ, McKenzie JE, Bossuyt PM, Boutron I, Hoffmann TC, Mulrow CD, Shamseer L, Tetzlaff JM, Akl EA, Brennan SE, Chou R, Glanville J, Grimshaw JM, HrГіbjartsson A, Lalu MM, Li T, Loder EW, Mayo-Wilson E, McDonald S, McGuinness LA, Stewart LA, Thomas J, Tricco AC, Welch VA, Whiting P, Moher D (2021) The PRISMA 2020 statement: an updated guideline for reporting systematic reviews. Int J Surg 88:105906
Papanagnou CI, Matthews-Amune O (2018) Coping with demand volatility in retail pharmacies with the aid of big data exploration. Computers and Operations Research 98:343–354
Parmar D (2021) ‘4 applications of big data in Supply Chain Management’, Data Science weblog, <https://bigdata-madesimple.com/4-applications-of-big-data-in-supply-chain-management/
Patil S (2017) Data analytics and supply chain decisions. Supply Chain Pulse vol 8(1):29–321
Pop F, Lovin M-A, Cristea V, Bessis N, Sotiriadis S (2012) Applications Monitoring for self-Optimization in GridGain, pp. 755 – 60
Rabelo L, Sarmiento A, Jones A (2011) Stability of the supply chain using system dynamics simulation and the accumulated deviations from equilibrium. Modelling and Simulation in Engineering. vol 2011
Raghupathi W, Raghupathi V (2014) Big data analytics in healthcare: promise and potential. Health information science and systems. vol, pp. 1–10
Rai S (2019) Big data - real time fact-based decision: the next big thing in supply chain. Int J Bus Perform Supply Chain Modelling 10(3):253–265
Richey RG, Morgan TR, Lindsey-Hall K, Adams FG (2016) A global exploration of Big Data in the supply chain. International Journal of Physical Distribution & Logistics Management. vol
Riddle ME, Tatara E, Olson C, Smith BJ, Irion AB, Harker B, Pineault D, Alonso E, Graziano DJ (2021) Agent-based modeling of supply disruptions in the global rare earths market. Conservation and Recycling, vol 164. Resources, p 105193
Roy C, Rautaray S, Pandey M (2018) Big Data optimization techniques: a Survey. Int J Inform Eng Electron Bus 10:41–48
Sánchez-Ramírez C, Ramos-Hernández R, Fong M, Alor-Hernández JR, G., Luis García-Alcaraz JL (2019) A system dynamics model to evaluate the impact of production process disruption on order shipping. 10(1):208Applied Sciences
Sarabia-Jacome D, Palau CE, Esteve M, Boronat F (2020) Seaport Data Space for Improving Logistic Maritime Operations. IEEE Access. vol 8, pp. 4372-82
Schubert D, Kuhn H, Holzapfel A (2020) Sam… day deliveries in omnichannel retail: Integrated order picking and vehicle routing with vehicl… site dependencies. Naval Research Logistics. vol
Seyedan M, Mafakheri F (2020) Predictive big data analytics for supply chain demand forecasting: methods, applications, and research opportunities. J Big Data vol 7(1):53
Shafique M, Khurshid M, Rahman, Khanna A, Gupta D (2019) The role of big data predictive analytics and radio frequency identification in the pharmaceutical industry. IEEE Access 7:9013–9021
Shavaki F, Jolai F (2021a) A rule-based heuristic algorithm for joint order batching and delivery planning of online retailers with multiple order pickers. 51(6):3917–3935Applied Intelligence6
Shavaki FH, Jolai F (2021b) Formulating and solving the integrated online order batching and delivery planning with specific due dates for orders. J Intell Fuzzy Syst 40:4877–4903
Tan KH, Zhan Y, Ji G, Ye F, Chang C (2015) Harvesting big data to enhance supply chain innovation capabilities: an analytic infrastructure based on deduction graph. Int J Prod Econ 165:223–233
Tao Q, Gu C, Wang Z, Rocchio J, Hu W, Yu X (2018) Big Data Driven Agricultural Products Supply Chain Management: a trustworthy scheduling optimization Approach. IEEE Access 6:49990–50002
Tiwari S, Wee HM, Daryanto Y (2018) Big data analytics in supply chain management between 2010 and 2016: insights to industries. Computers and Industrial Engineering 115:319–330
Torkul O, YД±lmaz R, Selvi ДhH, Cesur MR (2016) A real-time inventory model to manage variance of demand for decreasing inventory holding cost. Comput Ind Eng 102:435–439
Vavilapalli VK, Murthy AC, Douglas C, Agarwal S, Konar M, Evans R, Graves T, Lowe J, Shah H, Seth S, Saha B, Curino C, Malley OO, Radia S, Reed B, Baldeschwieler E (2013) Apache Hadoop YARN: Yet Another Resource Negotiator. Proceedings of the 4th annual Symposium on Cloud Computing. vol, pp. 1–16
Vieira A, Dias L, Santos M, Pereira G, Oliveira J (2020) On the use of simulation as a Big Data semantic validator for supply chain management. Simulation Modelling Practice and Theory. vol 98
Vu-Ngoc H, Elawady SS, Mehyar GM, Abdelhamid AH, Mattar OM, Halhouli O, Vuong NL, Ali CDM, Hassan UH, Kien ND, Hirayama K, Huy NT (2018) Quality of flow diagram in systematic review and/or meta-analysis. PLOS ONE. vol 13, 6. 6, p. e0195955
Wang G, Gunasekaran A, Ngai E, Papadopoulos T (2016) Big data analytics in logistics and supply chain management: certain investigations for research and applications. Int J Prod Econ 176:98–110
Yang ECL, Khoo-Lattimore C, Arcodia C (2017) A systematic literature review of risk and gender research in tourism. Tour Manag 58:89–100
Zhan Y, Tan K (2020) An analytic infrastructure for harvesting big data to enhance supply chain performance. Eur J Oper Res 281(3):559–5743
Zhao R, Liu Y, Zhang N, Huang T (2017) An optimization model for green supply chain management by using a big data analytic approach. J Clean Prod 142:1085–1097
Zhong R, Huang G, Lan S, Dai QY, Chen X, Zhang T (2015) A big data approach for logistics trajectory discovery from RFID-enabled production data. Int J Prod Econ 165:260–272
Zhong R, Newman S, Huang G, Lan S (2016) Big Data for supply chain management in the service and manufacturing sectors: Challenges, opportunities, and future perspectives. Computers and Industrial Engineering 101:572–591
Guidance for students and staff: literature searching n.d., Literature searching explained Develop a search strategy, University of Leeds, Online, viewed 14/09/2022 2022, <https://library.leeds.ac.uk/info/1404/literature_searching/14/literature_searching_explained/4
https://doi.org/10.3115/1034678.1034679>
Fahimeh.HosseinniaShavaki@uts.edu.au
Renu.Agarwal@uts.edu.au
Gnana.Bharathy@uts.edu.au
shivprakash@cas.res.in
Mukesh.Prasad@uts.edu.au
1School of Computer Science, University of Technology Sydney, Australia
3School of Information, System & Modelling, FEIT, University of Technology Sydney, Australia
4Department of Electronics and Communication
Funding
Open Access funding enabled and organized by CAUL and its Member Institutions
Author information
Authors and Affiliations
Corresponding author
Additional information
Publisher’s Note
Springer Nature remains neutral with regard to jurisdictional claims in published maps and institutional affiliations.
Rights and permissions
Springer Nature or its licensor (e.g. a society or other partner) holds exclusive rights to this article under a publishing agreement with the author(s) or other rightsholder(s); author self-archiving of the accepted manuscript version of this article is solely governed by the terms of such publishing agreement and applicable law.
Open Access This article is licensed under a Creative Commons Attribution 4.0 International License, which permits use, sharing, adaptation, distribution and reproduction in any medium or format, as long as you give appropriate credit to the original author(s) and the source, provide a link to the Creative Commons licence, and indicate if changes were made. The images or other third party material in this article are included in the article’s Creative Commons licence, unless indicated otherwise in a credit line to the material. If material is not included in the article’s Creative Commons licence and your intended use is not permitted by statutory regulation or exceeds the permitted use, you will need to obtain permission directly from the copyright holder. To view a copy of this licence, visit http://creativecommons.org/licenses/by/4.0/.
About this article

Cite this article
Alsolbi, I., Shavaki, F.H., Agarwal, R. et al. Big data optimisation and management in supply chain management: a systematic literature review. Artif Intell Rev 56 (Suppl 1), 253–284 (2023). https://doi.org/10.1007/s10462-023-10505-4
Accepted:
Published:
Issue Date:
DOI: https://doi.org/10.1007/s10462-023-10505-4