
Abstract
As other European countries, Spain has experienced a turmoil in which new political parties emerged with force after the global financial crisis in 2008. In this context, we analyze whether the empirical implications of the opportunistic and partisan theories, as well as the Uncertain Information Hypothesis, are met in the Spanish stock market, considering the size and the industry of the companies. The horizon of our study takes into account the seven general elections, 24 regional elections and 4 European elections held from 2002 to 2019, period in which Spain is fully integrated in the economic and monetary union and under the macroeconomic imbalance procedure. Our results do not support the opportunistic and partisan theories, or the Uncertain Information Hypothesis. Our evidence suggests that the short-term negative market reaction to the general elections is linked to the uncertainty with a change in the political sign of the incumbent. Besides, it is not related to size or industry characteristics.
1 Introduction
The baseline of this paper is that election results contain valuable information for the participants in the stock market with regard to potential changes in government policy in the post-election period. These potential changes in government policy include fiscal aspects (such as taxes, subsidies, and government spending in general), as well as regulatory aspects, such as law enforcement, competition regulation and environmental provisions (Pastor and Veronesi 2012), but also economic aspects such as monetary and commercial policy (Julio and Yook 2012). Accordingly, changes in post-election policies influence the general economy of a country and, therefore, specific companies and industries.
Within the financial literature, since Niederhoffer et al. (1970), a growing number of papers have studied the influence of political issues on capital markets.Footnote 1 In Spain, Furió and Pardo (2012) are the first to address the link between politics and the Spanish stock market for the period 1977–2008 by contrasting the empirical implications of the opportunistic and partisan theories, as well as the Uncertain Information Hypothesis.
From our point of view, the Spanish political and economic environment have deeply changed since Furió and Pardo’s (2012) research that a revisiting of this topic is mandatory. Therefore, we analyze the Spanish stock market performance in the long–and in the short–term for general elections with respect to meeting the assumptions of the opportunist and partisan theories and the Uncertain Information Hypothesis, incorporating the European and regional elections for a recent period (2002–2019), and evaluating the role that firm size and industry plays. On the one hand, we include the European and regional elections because of their ability to enact laws that affect economic and business activity.Footnote 2 Besides, both state-wide parties in the Spanish two-party system (Partido Socialista Obrero Español –PSOE– and Partido Popular –PP) have traditionally sought the support of regional parties when they did not obtain a majority of the votes. On the other hand, we expand our analyses to firm size and industry given the evidence found in other markets in relation to these characteristics (Santa-Clara and Valkanov 2003 and Bialkowski et al. 2007, among others).
Two are the main keys that explain our effort to wider and deeper previous evidence for Spain: (i) The transfer of economic policy instruments to the European Union (EU); and (ii) The end of the traditional bipartisanship that had characterized Spanish politics from the re-instauration of democracy in 1977 as a consequence of the great political turmoil in Spain in which new political parties emerged with force after the global financial crisis in 2008.
In the first case, along the period under study Spain fully integrates in the Economic and Monetary Union (EMU). As a result, a single monetary policy is set by the European Central Bank (ECB) and is complemented by harmonized fiscal and coordinated economic policies. Besides, since 2011, the EU sets up the macroeconomic imbalance procedure (MIP), a surveillance and enforcement procedure intended to facilitate early identification and correction of such imbalances in Member States, paying specific attention to those imbalances with potential spill-over effects on other Member States. Therefore, we expect that these two milestones may affect the ability of Spanish governments to empirically implement the opportunistic and partisan theories.
In the second case, the Global Financial Crisis of 2008 and the progressive sense of political dissatisfaction with the overall political system brought a crisis of representation that led to a reconfiguration of the party system after the results of the general elections of 2015 in Spain, moving from an imperfect two-party system to a fragmented multi-party system (Vidal 2018). As a consequence, the post-electoral agreements necessary to carry out the investiture of the president of the government become more challenging in the period under study.
Thus, firstly, the validity of the opportunist theory is examined, according to which politicians use fiscal and monetary instruments during the pre-electoral and electoral year to conserve power. Besides, we test the hypothesis that the stock market exhibits different behavior depending on the ideology of the government. This hypothesis is based on the partisan theory, according to which the ideology of the party in power is relevant, since each ideology has a different influence on the performance of the securities markets. The policies of the left are focused on combating unemployment. On the other hand, one of the main objectives of right-wing policies is to reduce the level of inflation, leading to lower interest rates and an increase in average returns in equity markets. To this end, the performance of stock market returns in the aforementioned periods is analyzed. As stated above, the transfer of economic and financial instruments from the Spanish government to the EU leads us to expect zero abnormal stock market performance.
Secondly, and in order to study the short-term effect of elections on the market, the null hypothesis of the absence of abnormal returns around the date of the elections is tested, distinguishing the sign of winning party, whether the victory has been obtained by simple or absolute majority and whether there is a change in the political sign of the government or a continuation.
We perform both the first and second set of analyses on the Spanish stock market taking into account the firm size and the industry characteristics. Firm size is relevant for several reasons, including (i) That large firms are more diversified as they usually undertake global prospecting and gather the necessary information for exploiting international opportunities (Benito-Osorio et al. 2016), so that they are less expose to national government decisions; (ii) That large companies have politicians on their boards of directors and, consequently, they can anticipate and mitigate to some extent political actions from the government;Footnote 3 and (iii) Since the seminal research of Banz (1981), financial literature have shown that small size firms are more exposed to systematic risks.Footnote 4 Industry is also a key characteristic since some industries are particularly sensitive to regulation and to government decisions on public expenditures (i.e. construction of public works). Specifically, regulated industries coincide with the former state monopolies that have now disappeared in the Spanish legal and economic environment at the demand of the European Union (telecommunications, energy, transport and postal communications, pharmaceutical sector).Footnote 5
Finally, we analyze the relation between the volatility of the stock market and the policy uncertainty by means of two indices calculated according to newspaper-based methods. Variations of policy uncertainty is tested around the elections.
Our results do not support the theories of economic cycles for the Spanish market, nor the Uncertain Information Hypothesis and confirm our hypothesis that the Spanish political (and economic) ‘environment’ that Furió and Pardo (2012) studied in their research does not exist any longer. Specifically, our results suggest that the short-term negative Spanish stock market reaction to the general elections is related to the uncertainty of a change in the political sign of the incumbent rather than the sign of the winner party. Besides, we find that, contrary to the evidence from other markets, the negative reaction observed in the Spanish market is not related to size or industry characteristics. Finally, we find that political uncertainty is not resolved after the elections.
Although researchers have made a great effort in conducting multi-country studies (particularly in Europe), papers such as that of Wisniewski (2016) show the need for studies of individual countries in this field of research since, as according to this author, the political preferences of investors are likely to depend on the specific environment of each country. Additionally, we show how changes in the political and economic environment over time can significantly alter the results and conclusions of previous research.
The remainder of the paper is structured as follows. Section 2 describes the basic fundamentals of partisan and opportunistic theories, as well as the Uncertain Information Hypothesis. Next, in Sect. 3, a review of the previous empirical literature is made. In Sects. 4 and 5, the sample and the methodology used in the different analyses are described, respectively. Section 5 presents and discusses the results obtained and Sect. 7 concludes.
2 Long– and short–term stock market performance to government election: theories and empirical evidence
Opportunistic and partisan theories are the main theories that relate political events to capital markets. The opportunistic theory of the economic cycle was principally developed by Nordhaus (1975). This theory considers the possibility that the main objective of rulers is to maximize the number of votes to increase the probability of being re-elected. The opportunist attitude of politicians prevails over any other motivation, and all governments develop similar strategies in the face of elections, regardless of whether they are left or right.
In the traditional version of the opportunist theory, voters are naive and non-rational. However, other authors (Alesina 1987; Alesina and Sachs 1988; Chappell and Keech 1986) have incorporated the assumption of rational voters into the theory of economic political cycles. According to these models, the motivation of politicians remains the same, but voters are rational agents and seek to optimize their utility function with knowledge of economic reality. Consequently, rational voters will know that economic growth is fictitious and will not vote for the party that acts like that. However, despite this, politicians will continue to be opportunists and take advantage of citizens who are not fully informed.
In the 1970s, the partisan theory proposed by Hibbs (1977) appeared, according to which there is a marked difference between different governments depending on whether they are left or right. The strategies of the politicians are clearly differentiated, since in each position they will try to use the available resources for the benefit of the voters who support them.
The empirical evidence of significantly higher returns under Democratic presidencies versus Republican ones for both market-weighted and value-weighted market indices (Santa-Clara and Valkanov 2003, among others), as well as in sectors heavily exposed to government spending, was the seed of a new interpretation of the so-called partisan return cycle, according to which this distribution of returns would reflect compensation for risk. In this regard, Sy and Zaman (2011) show that the ‘presidential puzzle’ is explained by those models that allow for fluctuations in risk.
According to Wisniewski (2016), if the interpretation of Sy and Zaman (2011) is correct, then two results can be expected. First, the partisan return cycle would be clearly observable (even if the investors were rational). Second, there would be a price reaction with the announcement of the election results. Thus, if the required yield increases (as under Democratic presidencies), investors will begin to discount future cash flows at a higher rate, so that prices will fall when the election results are disseminated. This initial fall in prices will be followed by higher returns over the next four years, as predicted by the ‘presidential puzzle’ and the arguments related to risk compensation. On the contrary, when a Republican president is elected, the prices should experience an immediate increase that would be followed by a poor market performance during the legislative term. In brief, the short-term reaction should have the opposite sign to that predicted by the partisan cycle.
However, the short-term price reaction after the elections has elicited alternative explanations. Thus, within the field of behavioral finance, the Uncertain Information Hypothesis of Brown et al. (1988, 1993) emerged, assuming that anxiety will increase in the market after the occurrence of an unexpected event. This implies that investors would not be able to respond to the arrival of unexpected information and, consequently, could set prices below their fundamental value in the moments before the event. Therefore, when the uncertainty induced by elections is mitigated after the electoral recount, positive abnormal returns should be expected after the elections. Moreover, the greater the reduction in uncertainty, the higher the observed abnormal yields should be.
Since the seminal work of Niederhoffer et al. (1970), most empirical studies have investigated the effect of elections on the stock indices of USA. In particular, several studies focus specifically on the relationship between the political orientation of the winning party and the behavior of the market. Thus, Johnson et al. (1999) and Santa Clara and Valkanov (2003) find better stock performance under the presidencies of Democrats than Republicans, this difference being particularly large for portfolios made up of small companies. This anomaly cannot be explained by variations in the economic cycle. In this same sense, Belo et al. (2013) point out that the partisan return cycle is not only an issue that concerns small businesses but also, and particularly, companies in industries with large exposure to government spending.
Regarding the short-term reaction of the market, although Snowberg et al. (2007) find that the market reacts positively to Republican victories and negatively to Democrat ones, Oehler et al. (2013) do not find a consistent pattern of short-term abnormal returns by activity sectors when comparing the effect of Democrat vs. Republican victories around the presidential elections from 1980 to 2008 in the USA. On the contrary, Wagner et al. (2018) argue that the effect of political uncertainty surrounding the 2016 elections in the USA (elections in which Donald Trump won with the Republican Party) was industry specific, with some industries appearing as winners (health, oil and gas, real estate, defence, finance, and consumer goods and services) and others as losers (utilities and technology).
In any case, the results obtained in the North American market are not easily generalizable in the international context. Thus, in Australia and New Zealand, market returns are significantly lower under governments of the left than of the right (Cahan et al. 2005, and Anderson et al. 2008, respectively), and only marginally lower in the UK (Döpke and Pierdzioch 2006). However, Hudson et al. (1998) find no significant differences in the UK between Labour and Conservative governments, although the short-term market reaction seems to indicate a certain preference for right-wing governments.
Some studies focus on multi-country analysis. Thus, Pantzalis et al. (2000) investigate the behavior of the stock market of 33 countries on the dates of the elections. These authors find positive and significant returns in the two weeks before the elections, while in the four weeks after the event the returns were not statistically significant. Also, it should be noted that they found higher returns in the elections with a higher level of uncertainty, mainly in countries with low levels of political, economic and press freedom. Bohl and Gottschalk (2006), on the other hand, analyzed the relationship between political events and stock exchanges in 15 countries. Their results show significant differences in stock market returns depending on the political orientation of the government: in the case of the United States, the returns are higher when the Democrats are in power, while in Belgium, Japan and Norway the average returns are significant and higher when the parties belonging to the right are in power. Italy exhibits mixed results. Finally, the analysis of the existence of political cycles leads them to conclude that the returns are higher in the second half of the mandate, giving support, therefore, to the opportunist theory.
Finally, Bialkowski et al. (2007) show international evidence in relation to the political sign of the winning party in the elections and the reaction of the market by sectors of activity. Specifically, they do not find statistically significant differences in abnormal returns after the victory of right and left governments when analyzing 24 OECD countries and 173 electoral processes from January 1980 to December 2005.
In summary, and as Wisniewski (2016) points out, the political preferences of investors are likely to depend on the specific environment of the country, so that simple generalizations are unlikely to capture the full complexity of the international community’s political landscape.
3 Spain, from full economic independence and imperfect bipartidism to a surveilled economy and multiparty system
As far as we know, Furió and Pardo’s (2012) research is the only one until now that analyze the influence of Spanish politics on the behavior of the stock market by contrasting the empirical implications of the Opportunistic and Partisan theories and the Uncertain Information Hypothesis. Their period under analysis covers from January 1976 to October 2008. Their results show that there are no systematic differences in excess returns in the last two years preceding elections and market responses are of the same magnitude when incumbents win or lose the election. Therefore, they do not find evidence supporting the theory of the «opportunistic» Political Business Cycle.
Regarding stock market reaction around election dates, Furió and Pardo (2012) find that Spanish stock exchange seems to react differently depending on the political orientation of the government, not only on the election day but also during the tenure in office, verifying the partisan theory for the Spanish case. Specifically, they find that volatility is significantly higher on the first trading day after the elections date but they do not obtain significantly abnormal returns on the first trading day after the election day.
Following Wisniewski’s (2016) assertion that the political preferences of investors are likely to depend on the specific environment of each country, we hypothesize that the Spanish political (and economic) ‘environment’ that Furió and Pardo (2012) studied in their research does not exist any longer.
The European elections of 2014 (with the appearance on the political scene of Podemos) and the municipal and regional elections of May 2015, showed the first signs of the changes to come. Thus, the 2015 Spanish general elections were a turning point in the two-party system that had existed since the Spanish’s transition to democracy in 1977. The two traditional parties (the conservative Partido Popular (PP) and the social democratic Partido Socialista Obrero Español (PSOE)), that had ruled Spain in recurrent alternation for over 30 years, obtained their worst electoral results ever.Footnote 6 Together, they took just 50.7% of the vote, a significant drop from the 2008 elections (83.8%). These results were in apparent contradiction with the hitherto proven capacity of the Spanish electoral system of the Congress of Deputies to manufacture parliamentary majorities until then (Sánchez 2017). This totally new political environment created by the 2015 general election led, for the first time in Spain, to an investment failure and, therefore, to new general elections in 26 June 2016 as it had proved impossible to form a government (Simón 2016).
Vidal (2018) claims that this collapse of the two-party system in Spain in the aftermath of the world financial crisis of 2008 is not a mere consequence of the punishment of incumbent governments during times of economic crisis (as some economic voting theories may argue), but a result of a wider sense of ‘crisis of representation’. A key factor that helps to understand this wider sense of political dissatisfaction with the overall political system comes from the Spanish public debate of party regeneration as a result of the corruption scandals that have tainted the main parties and most institutions in the years prior to the elections on 25 May 2015 (Gómez–Fortes and Urquizu 2015). Evidence for this is given by surveys conducted by Centro de Investigaciones Sociológicas (Spanish Centre for Sociological Research, CIS). As shown in Fig. 1, the percentage of those who replied that corruption is one of the three serious problems in Spain changed from being around 1% in the later twentieth century and first decade of the twenty-first century, to reach a maximum of 64% in November 2014.
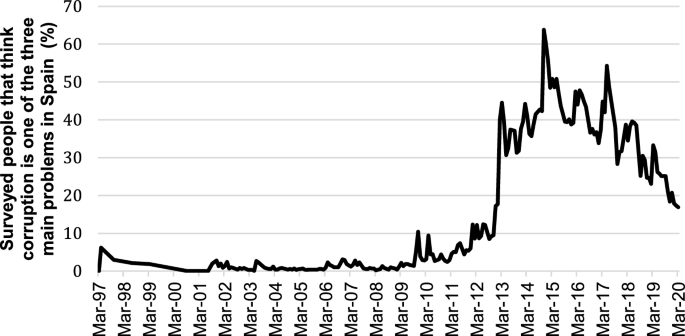
Source: Compiled by the authors from data collected from the CIS webpage
Surveyed people by the Spanish Centre for Sociological Research (CIS) who think that corruption and fraud constitute one of the three main problems of the country.
In addition to political instability, the second key factor that reinforces the unlike environment with previous research is the Spanish integration in the UME and the aftermath loss of economic and financial independence that the financial crisis of 2008 exacerbated.
Though European integration was a catalyst for the final conversion of Spain into modern Western-type economies, this process also brought significant costs in terms of economic adjustment and loss of sovereignty, that is, the ability of the Spanish government to implement the range of economic policy instruments available (Royo 2010). This loss of financial and economic independence had its first milestone with Spain becoming a founder of the European Monetary Union (EMU) on January 1st, 1999. With the EMU, the member states of the European Union adopt a single currency, a single monetary policy and coordinated macroeconomic policies.
However, it was the Global Financial Crisis of 2008 and the subsequent macroeconomic imbalances what triggered the largest loss of economic sovereignty in Spain’s history. That is, the EU introduced a new mechanism called the Macroeconomic Imbalance Procedure (MIP) in 2011 to deal with imbalances. Together with fiscal surveillance and broader structural surveillance they form the ‘European Semester’. In parallel to these measures, on September 7th, the Spanish Parliament approved a constitutional reform that (i) Introduced a debt limit in the Spanish Constitution, and (ii) Interest and principal payments of public debt were given explicit priority over any other expenditure.
Of course, all these events have left their mark. Figure 2 shows the Economic Policy Uncertainty (EPU) index for Spain developed by Ghirelli et al. (2019) from January 1997 to February 2020.Footnote 7 We have also plotted the tendency line (dashed line) over time. Although the index data series begins in the late twentieth century, the tendency line has a clear positive slope, raising from 50 points in 1997 to 150 points in 2019.
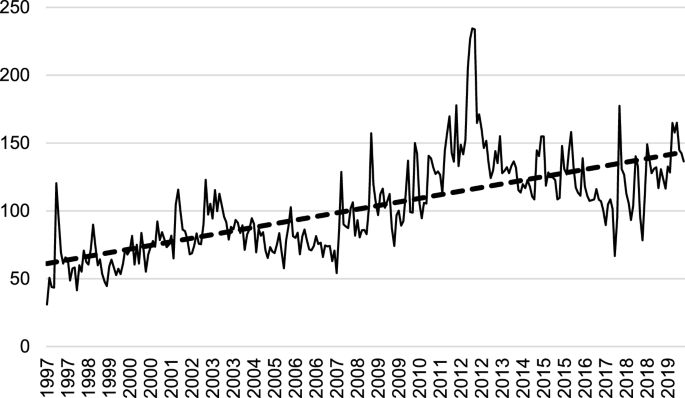
Source: Own elaboration from open source data collected from EPU website. (https://www.policyuncertainty.com/spain_GPU.html)
Spanish Economic Policy Uncertainty Index.
4 Sample and data
To analyze the behavior of the Spanish stock market, the series of daily and monthly returns of the Ibex 35, Ibex Medium Cap, Ibex Small Cap and the following sectorial indices provided by BME are used: Consumer goods; Basic materials, Industry and construction; Oil and energy; Consumer services; Financial and real estate services; and Technology and telecommunications.Footnote 8 The sample period analyzed extends from 1 January 2002 to 15 January 2020, covering the last seven general elections (those corresponding to the VIII, IX, X, XI, XII, XIII and XIV legislatures), 24 Autonomous Community elections and 4 European Parliament elections. Regarding the elections of the regional parliaments (and jurisdictions), this paper studied the elections of the parliaments of Catalonia, Galicia, Andalusia and the Basque Country, the elections of the Assembly of Madrid and the regional elections of the rest of the Autonomous Communities (which take place in the same natural day). Appendix 1 and 2 show the dates of the general, regional and European elections, respectively, for the sample period analyzed. Stock market data come from Eikon and Datastream databases. The dates and results of the different elections were obtained from the web portal of the Ministerio del Interior (Home Office).Footnote 9
Figure 3 exhibits the evolution of the number of seats won by the Partido Socialista Obrero Español (PSOE), the Partido Popular (PP), and the sum of seats won by minority parties (Others). As the Spanish Congress has 350 members, the absolute majority is reached with 176 seats. Victory with absolute majority was rare in the period studied (only 1 out of 7 general elections): the PP’s victory in the elections of 2011 (see Appendix 1).

Source: Own elaboration from the data provided by the Ministry of Interior (Home Office) web page
General Election results Notes: Number of seats obtained in the Spanish General Elections from 2004 to 2019. The figure represents the evolution of the number of seats won by the Partido Socialista Obrero Español (PSOE), the Partido Popular (PP), and the sum of seats won by minority parties (Others). The Spanish Congress has 350 members, therefore the absolute majority is reached with 176 seats.
5 Methodology
5.1 Stock market performance in the long–term
To analyze the Spanish stock market long–term performance in relation to the above theories, we first analyze whether the market stock indices behave differently during the first and last year of government’s term, independently of the party, as shown in model (1). However, as results could be affected by the global economic and financial crisis of 2008, which severely affected Spain (see in this respect the growth of Spain’s GDP by legislative term in Fig. 4), the growth rate of the gross domestic product (GDP) has been incorporated into the model. In addition, the persistence of volatility has been taken into account using the GARCH (1,1) model.Footnote 10
where \(r_{i,T}\) is the monthly return of the index i in month T, and the independent variables FYT and LYT are dummy variables that take the value 1 if month T belongs to the first (last) year of each government’s term and 0 otherwise, respectively. GDPT is the quarterly growth rate closest to the month T. The conditional volatility of ɛi,T is defined as hi,T, γi,0 is the unconditional variance, γi,1 reflects the dependence of the current volatility on the volatility of the previous period and γi,2 reflects the dependence of the current volatility on the conditional variance of the previous period.

GDP evolution under PP and PSOE governments. Notes: Own elaboration from the data provided by Instituto Nacional de Estadística (National Statistical Institute) web page
The monthly return \({r}_{i,T}\) is obtained by composing the daily returns of the different indices, as appears in expression (2).
where Ri,t is the daily return of index i based on close to close levels,Footnote 11 and φ is the last day of month T. The observation period is from 1 January 2002 to 15 January 2020 with 217 monthly returns. We have purged the return series with the month corresponding to the date of each election. Moreover, those previous or post-election periods that have not been long enough to be included in the analysis have also been removed.
On the other hand, according to the partisan theory, the returns of the indices exhibit different behavior depending on the ideology of the government. As we pointed out above, bipartisanship has characterized Spanish politics in recent decades by means of the recurrent alternation in power of two large parties: the centre-right Partido Popular (PP) and the centre-left Partido Socialista Obrero Español (PSOE). Thus, we contrast the hypothesis contained in the partisan theory by means of an extended version of the model (1) where the independent variables are, in addition to GDP, four dummy variables to distinguish whether the mandate belongs to the PP or to the PSOE.
Through this model, we aim to analyze the influence of the ideology of the party that is in power in the stock market indices and detect its effect during the first and second half of the legislative term.
5.2 Short-term impact of the election result
To measure the short-term impact of political events on the main indices of the Spanish stock market, the event study methodology is used. This methodology assumes that rational agents use information to make their investment decisions. We employ the dummy variable technique that provides both abnormal returns and correct test statistics in one-step (Binder 1998). Here, the ‘normal’ returns are estimated as the index daily mean return during the estimation (uncontaminated) window. Besides, the persistence of volatility has been taken into account using the GARCH (1,1) model, since this type of modelling is especially appropriate when data exhibits characteristics such as leptokurtosis and volatility clustering typical of financial series with daily frequency (Bollerslev 1986; Engle 1982).
The null hypothesis of the absence of abnormal returns during the period after the elections is tested. The effect of the seven general elections from 2004 to 2019 is analyzed.Footnote 12 The event window covers the five market days after the elections, that is [t0 + 1, t0 + 5], being t0 the election day (Sunday). Additionally, we consider the days of the electoral campaign to be contaminated so we remove those periods for each of the elections studied.Footnote 13
In this research, abnormal returns (AR) are estimated through model (3) where dummy variables are included for each of the days after the date of the election. In addition, the seasonal effects of the day of the week have been controlled by including four other dummy variables.Footnote 14 The model is regressed for the time horizon analyzed (1 January 2002 to 15 January 2020) using daily returns for the different indices.
where Ri,t is the return of index i on day t based on close to close levels; Djt are dummy variables that take the value 1 if t is the first, second, third, fourth or fifth day after the elections (j = 1, 2, 3, 4, 5) and 0 otherwise; Sn are dummy variables that represent the days of the week, which take the value 1 if day t is Monday, Tuesday, Thursday or Friday, respectively, during the period analyzed.
The accumulated abnormal returns for the event window (CAR) are estimated by model (4).
where \( D_{t}\) is a dummy variable that takes the value 0.2 if t is one of the five days after the election, and 0 otherwise.
In addition to the analysis of the first five trading days after the election, we compute the accumulated abnormal return from the day after the election date until the trading day prior to the investiture date (CARINV). For this purpose, model (4) is re-estimated using for the dummy variable the value of 1 divided by the sum of the trading days between the date of the election and the date of first investiture voting if t is one of the days after the election and before the investiture, and 0 otherwise.
Next, we analyze whether the short-term effect of general elections on the Spanish stock market depends on some different characteristics, namely (i) The winning party, (ii) the victory with an absolute majority versus a simple majority, and (iii) The change in the ruling party versus continuity.
In order to capture the effects mentioned above, several versions of model (3) are used. These versions incorporate 10 dummy variables instead of five to distinguish whether the winning party is the PP or the PSOE, whether or not the victory has been by absolute majority and whether or not the election result entails a change in the ruling party.
The CAR for the five-day event window and for the period until the investiture according to the above-mentioned characteristics are calculated extending model (4) in a similar way.
Regarding the regional elections, we estimate the average abnormal return only for the first day after the election. Therefore, model (3) is re-estimated including the totality of regional elections from 25 May 2003 until 26 May 2019 (see Appendix 2). Besides, we estimate the abnormal return for each Autonomous Community separately to determine which elections have the most influence on the stock market. Thus, we analyze the short–term reaction of the stock market index on the first day after the elections of the Parliaments of Catalonia, Galicia, Andalusia and the Basque Country, elections to the Assembly of Madrid and all of the regional elections of the rest of the Autonomous Communities (conglomerate).Footnote 15 The abnormal returns are estimated according to model (5).
where Jωt takes the value 1 if t is the first day after the election, and 0 otherwise. J represents the elections in each autonomous community, being J = CAT (Catalonia), GAL (Galicia), AND (Andalusia), CMA (Community of Madrid), conglomerate (remaining autonomous communities). In the estimation of model (5), the days after the general elections have been removed.Footnote 16
Finally, the effect of the European elections is estimated by analyzing the abnormal performance of the first day after the European elections (see Appendix 3) as shown in model [6].
where EUt is a dummy variable that takes value 1 if t is the first day after the European election and 0 otherwise. As in the study of the regional elections, the days after the general elections have been removed from the sample in order to estimate the model.
5.3 Analysis of relationship of policy uncertainty and market volatility
Since the aim of this study is to analyze the reaction of the Spanish stock market to different elections, we consider that it is worthy to conclude the study by exploring the existence of a relationship between market volatility and the level of uncertainty in the country. We proxy political uncertainty in Spain through indices developed for this specific purpose by two independent research teams, both calculated according to newspaper-based methods: the Spain Economic Political Uncertainty (SEPU) index by Ghirelli et al. (2019), and the EPU index for Spain (EPUS) by Baker et al. (2016) as one component of their European EPU Index.Footnote 17
Both research teams follow newspaper-based methods as in Baker et al. (2016). Ghirelli et al. (2019) constructed an index that runs from January 1997 to the present, whereas Baker et al. (2016) included Spain in their European Index from January 2001 onwards. The two indices differ in the number of newspapers consulted and in the reference period used to standardize the series to a unit standard deviation.Footnote 18
Therefore, we model the relationship between stock market volatility and our policy uncertainty proxies as shown in model (7). As we tested serial correlation through the Ljung–Box Q test, we include the lagged volatility as an explanatory variable. Heteroskedasticity is corrected using White’s methodology.
where VoliT is the volatility of the stock market index i in the moth T calculated as the standard deviation of its daily returns in month T and PUjT is the natural logarithm of the aforementioned EPU indices.
Moreover, we have studied through model (8) whether the EPU proxies used abnormally react around the month of the election.
where M-1 T, M0T and M1T are dummies variables that take value 1 if the moth T is the pre-election month, the election month or the post-election month, respectively. As in model (7), we include the lagged dependent variable as an independent variable in order to control for serial correlation. Heteroskedasticity has been corrected using White’s methodology.
6 Results
6.1 Analysis of opportunistic and partisan theories
Panel A of Table 1 shows the abnormal returns of the broad market indices by size (Ibex35, Ibex Medium Cap and Ibex Small Cap) and those of the industry indices during the first and last year of the term regardless the political orientation of the government by estimating model (1).Footnote 19 We do not find a significant abnormal performance in any of the broad market indices used. Therefore, firm size does not seem to be a relevant factor regarding the government behavior during the first and last year of the term. Regarding industry indices, we hardly find significant abnormal returns. Specifically, we find significant negative abnormal returns for the Services index for both the first and last year of the government term and significant negative abnormal returns during the last year of the government term for the Financial index. These results (in particular, those referring to the family of Ibex indices) are in agreement with those obtained by Furió and Pardo (2012) for the Spanish market, which corroborates the absence of evidence supporting the opportunistic theory for Spain.
In order to explore if the political sign of the government can affect the behavior of the stock market, as the partisan theory postulates, we re-estimate model (1) by distinguishing according to the winning party. Panel B of Table 1 shows the results for the first and last year of the legislative term differentiating between the sign of the political party in power, namely: centre-right (PP) and centre-left (PSOE). Contrary to the evidence in other markets (Australia, New Zealand, USA) and previous evidence in Spain in which higher returns are found under right-wing governments, we do not find abnormal market performance under PP governments. However, medium and small firm indices show significantly underperformance during the last year of PSOE governments. This poor performance concentrates in Financial and Services industries that exhibits significant negative abnormal returns of − 3.5 and − 2.6%, respectively.
Both size and industry results from Panel B of Table 1 lead us to think that our results are more linked to the heaviness of the economic crisis that Spain suffered after 2008 (even controlling for GDP variations) than explained by the partisan theory. Next, we may obtain more clues with the study of the short-term reaction of the stock market to the general elections.
6.2 Analysis of the short-term impact of the electoral result
Table 2 shows the results from the estimation of models (4) and (3), that is, the average cumulative abnormal return (CAR) during the first five days after the date of the elections (Panel A), the average cumulative abnormal return (CARINV) from the day after the election date until the trading day prior to the investiture date and the average abnormal return (AR) for each of the five days after the election date (Panel C).
Regardless firm size, we find post-elections significant negative five-day CARs ranging from − 1.96% for large firms to − 2.33% for medium firms. This negative reaction concentrates on the first trading day after the elections (Panel C). Actually, when we extend the analysis period until the trading day prior to the investiture date (Panel B), we find non-significant CARs. Unlike the previous evidence for the Spanish market and the evidence obtained in other markets by Snowberg et al. (2007) and Pantzalis et al. (2000), these results show that, on average, the Spanish stock market is politically sensitive, showing a negative reaction to the elections taken as a political event.
These results are contrary to the Uncertain Information Hypothesis of Brown et al. (1988, 1993), under which positive abnormal cumulative returns are expected in the post-election period as a result of the uncertainty brought on by elections.
When the market reaction is broken down by activity sectors, Panel A from Table 1 shows five-day CARs negative and significant for Construction, Energy, Financial, Telecom, ranging from − 1.2 to − 3%. Although this result may be linked to the nature of these industries, as they are particularly sensitive to regulation and to government decisions on public expenditures, we find in Panel C that the negative and significant stock market reaction is widespread for all the industries in the first day after the elections. As in Table 1, when the period under analysis is extended until the investiture date, all the average CARs estimated remain non-significant.
Note that all these results together point that, on average, the negative reaction of the Spanish stock market (i) Is independent both of the ideology of the party that obtains/loses power and of whether the party of the new government has an absolute majority or not in the parliament; (ii) Is widespread regardless size and industry characteristics; and (iii) Is concentrated in the first trading day after the election day.
Table 3 shows the results obtained from the respective modifications of model [3] and model (4) in order to analyze the market reaction conditional to the winning political orientation in the elections.
Results from Table 3 show some clues to understand prior results from Table 2. Specifically, we find that the negative average five-day CARs in Panel A from Table 2 mainly correspond to victories of PSOE, regardless the firm size (Panel A from Table 3). In the same way, the negative industry reaction found in Table 2 correspond to victories of PSOE too.
When we estimate daily abnormal returns (ARs), we also find quite different results for PP and PSOE victories (Panel C from Table 3). In the case of a victory of the right-centre party (PP), only larger firms react negative and significantly. This significant and negative reaction only arises in the case of construction, energy and financial industries. However, when the left-centre party (PSOE) wins we find a general negative and significant stock market reaction in the first day after the election regardless size and industry characteristics.
Again, when the period under analysis is extended until the investiture date, all the average CARs estimated remain non-significant (except that for Goods industry if PSOE wins).
This different behavior according to the political sign of the winning party in either the long-term or the short-term may lead to accept the partisan theory. However, our results do not fit with the interpretation made by Sy and Zaman (2011) of the partisan return cycle (the initial fall in prices should be followed by higher returns over the next years, as predicted by the arguments related to risk compensation), since we did not observe an opposite stock market behavior between the long-term and the short-term.
Next, we investigate the short-term market reaction in terms of the stability of the government that emerges from the voting. For this, we distinguish between a victory by absolute majority or by simple majority of the party that supports the future government (using the respective adaptations as indicated for model (3) and model (4)).
As shown in Fig. 3 and Appendix 3, throughout the period analyzed, the only elections in which the winning party won a victory by absolute majority were those of the year 2011, in which the PP won 186 seats. In this regard, the evidence in Panel A of Table 4 suggests that the negative (and significant) reaction of the Spanish stock market found in Tables 2 and 3 is linked with non-majority victories. The analysis of the day-by-day reaction of the market after the election reinforces this intuition, since we only find negative and significant abnormal returns on the first day of the market after the election day when a victory by simple majority occurs. Note that this evidence holds regardless firm size or industry. Once again, CARs covering the period between elections and the investiture date are non-significant.
In order to provide a better understanding of the Spanish stock market reaction to the general election results, we estimate abnormal returns taken into account whether the election results lead to a change in the political sign of the government or not. Table 5 exhibits the results from the estimation of models (4) and (3) differentiating whether or not elections lead to a change in the governing party. Either for five-day CARs (Panel A) or day-to-day ARs (Panel C), we find negative and significant abnormal returns only in the case of a change in the sign of the government no matter the direction of that change, that is, left to right or right to left. Note that we obtain negative and significant abnormal returns regardless size and industry characteristics in the case of a change of sign in the government.
The evidence obtained thus far does not support the Uncertain Information Hypothesis for the Spanish stock market. The fact that the statistically significant abnormal returns found in the previous analyses all have a negative sign reveals that the holding of elections does not resolve the previous uncertainty, as proposed by the Uncertain Information Hypothesis. As stated before, our results also do not fit with the interpretation made by Sy and Zaman (2011) of the partisan return cycle, since we do not observe an opposite behavior in the long term after the elections. On the contrary, our results suggest that the negative Spanish stock market reaction to the general elections is more linked to the uncertainty of a change in the political sign of the incumbent rather than to the very sign of the winner party. However, our evidence shows that this initial uncertainty disappears before the investiture date, as we do not find any significant CARs over the period between the election day and the investiture date. Interestingly, and contrary to the evidence from other markets, the negative reaction observed in the Spanish market is not related to size or industry characteristics.
So far, we pay attention to the short-term effect of the general elections. Next, Table 6 shows the market reaction in the first day after the election day in the case of the regional elections (see Appendix 2) through model (3) with only one dummy variable. Note that the average AR when we take the regional elections all together (Panel A from Table 6) is quite similar to that found for the general elections in Panel C from Table 2. That is, negative and significant abnormal returns regardless size and industry characteristics. Therefore, the results of Panel A from Table 6 suggest that the stock market reacts to the capacity of the policies of regional governments to influence the future progress of companies. However, when we identify the different Autonomous Community elections (model (5)), we find that the above negative reaction is primarily due to the Catalonian elections and, perhaps to a lesser extent, to the Galicia and Basque Country elections. We think that this evidence is consistent with the fact that either PSOE or PP have traditionally sought the support of the nationalist parties from Catalonia and the Basque Country in order to support their minority government.
Finally, in Table 7 we explore the impact of the European elections in the Spanish stock market as the EU has the ability to enact mandatory laws for the European countries. We do not find any significant reaction on average of the Spanish stock market reaction. This evidence is consistent with the fact that, even in the case of mandatory laws, EU regulations must be eventually transposed and approved by the national parliaments.
6.3 Economic policy uncertainty and market volatility
In this section, we test whether the celebration of the general elections in Spain induces greater economic uncertainty in the country. We proxy political uncertainty in Spain through two indices calculated according to newspaper-based methods: the Spain Economic Political Uncertainty (SEPU) index by Ghirelli et al. (2019), and the EPU index for Spain (EPUS) by Baker et al. (2016) as one component of their European EPU Index.
Nevertheless, first we explore whether there is a significant relation between both indices and the stock market volatility. Table 8 exhibits results from the estimation of model (7). In general terms, results suggest a positive and significant relationship between both indices and market volatility. That is, the Spanish stock market captures and reflects the variations in the uncertainty that the country support.
Now, we estimate model (8) and show the results in Table 9. Although both indices are calculated following newspaper-based methods, we find that only the EPU index by Baker et al. (2016) shows a significant increase during the month of the general elections. Moreover, contrary to papers such as Chan and Marsh (2020), there is no post-election resolution of uncertainty regardless the index used.
Though weak, this evidence is consistent with peaks of uncertainty induced by the general elections in an environment of higher economic and political uncertainty (see Fig. 2).
7 Conclusions
In this paper, we study the relation between politics and the Spanish stock market by assessing the empirical implications of the opportunistic and partisan theories, as well as the Uncertain Information Hypothesis. To do so, we use the general, regional, and European elections for the period 2002–2019. Moreover, we also consider the size and the industry characteristics of the companies given their relevance in the literature. To the best of our knowledge, this is the first paper that examines the convulsive political and economic situation in Spain since the crisis of 2008, which marked the end of the two-party system. Besides, we also shed more light on the evidence of these theories in a context in which Spain’s membership of the monetary union considerably reduces the discretion of politicians regarding the use of economic instruments and invalidate the main theories’ conclusions.
Our results do not support the opportunistic theory for the Spanish stock market regardless the size of the company and the economic sector to which it belongs. This outcome is consistent with a context in which Spain, as a member of Economic and Monetary Union, does not hold the monetary policy. Moreover, because of the Global Financial Crisis of 2008 and the subsequent macroeconomic imbalances, Spain is under the surveillance mechanism called Macroeconomic Imbalance Procedure.
We also find no evidence that support the partisan theory. Although we find a different behavior according to the political sign of the winning party in either the long-term or the short-term, we do not observe an opposite stock market behavior between the long-term and the short-term as predicted by the arguments of the partisan return cycle. Specifically, we find negative and significant abnormal returns for the left-centre party (PSOE) either in the long-term or short-term, and non-significant abnormal performance for the right-centre party (PP).
Although our results are in line with Furió and Pardo (2012) in terms of the lack of support for the opportunistic theory in Spain, we show opposite results in relation to the validity of the partisan theory. As discussed in Sect. 3, this difference may arise from the period under study, since the time horizon of Furió and Pardo’s (2012) research from 1976 to 2008 mainly comprises a period of full economic independence and imperfect bipartidism, whereas our time horizon from 2002 to 2019 is a period of time characterized by a surveilled economy and by a transition to a multiparty political system. These facts could explain the contradictory results between both studies.
Regarding the Uncertain Information Hypothesis, our results do not support it. We find negative and significant abnormal returns in the short-term after the general election day, not positive ones as Uncertain Information Hypothesis predicts. After analyzing the political sign of the winner party, the sort of the victory (simple or absolute) and whether the elections result in a change of the incumbent, our evidence suggests that the negative Spanish stock market reaction to the general elections may be linked to the uncertainty of a change in the political sign of the incumbent than to the very sign of the winner party. Besides, we find that uncertainty is very close to the election day, as it disappears before the investiture date. It is worthy to highlight that, contrary to the evidence from other markets, the negative reaction observed in the Spanish market is not related to size or industry characteristics.
We extend our analyses to the regional and European elections. In the first case, we find that, regardless size and industry characteristics, the Spanish stock market negatively reacts to the elections in Catalonia and the Basque Country. From our point of view, this evidence is consistent with the fact that either PSOE or PP have traditionally sought the support of the nationalist parties from Catalonia and Basque Country in order to support their minority government. Regarding the European elections, we do not find any significant reaction. This evidence is consistent with the fact that, even in the case of mandatory laws, EU regulations must be eventually transposed and approved by the Spanish national parliament.
Finally, we find a weak evidence that the celebration of the general elections in Spain may induce greater economic uncertainty in the country, though market volatility is closely related to political uncertainty. Moreover, political uncertainty is not resolved after the elections.
We agree with Wisniewski’s (2016) assertion that the political preferences of investors are likely to depend on the specific environment of each country and extend it to the notion time passing. As we show in this paper, the Spanish political (and economic) ‘environment’ differs so much between Furió and Pardo’s (2012) research and ours that we may state that the Spain they do not exist any longer. Therefore, this is a warning to the difficulty of the generalization to different countries and periods of this sort of studies.
Future research should address questions about the impact of Economic and Monetary Union membership on the relationship between politics and stock market behavior in other EU countries. Additionally, research should examine the long-term effects of political uncertainty on market volatility, as well as the individualized reactions of companies and explanatory factors based on the ideology of the winning party in elections.
Notes
See Wisniewski (2016) for a review of theoretical and empirical contributions on the field.
In this regard, the Spanish Minister of Finance, María Jesús Montero, denounced that the Community of Madrid has the capacity to “exercise fiscal dumping” by lowering the taxes it manages (“Montero acusa a Madrid”, February 2020, 26, elPeriodico).
In this regard, Farinós et al. (2016) find that the presence of former politicians on the board of directors of listed Spanish companies is highly valued by the market in times of economic crisis.
The regulatory function constitutes a new form of administrative intervention consisting of prolonged supervision and control over certain economic sectors that are considered strategic or, at least, of great importance to society and which therefore require the guarantee of minimum levels or standards of accessibility, quality and price for the benefit of citizens.
Note that, on the ideological spectrum, Podemos is to the left of the PSOE. See Meyenberg (2017) for a thorough analysis of this Spanish political party.
The data used were collected from the Economic Policy Uncertainty project's open source data website. (https://www.policyuncertainty.com).
In order to simplify the denomination of the sectoral indices in the tables, we will refer to them as Goods, Materials, Construction, Energy, Services, Financial, and Telecom, respectively.
Even though leptokurtosis and volatility clustering are typical of financial series with daily frequency, the parameters of the GARCH (1,1) are significant.
That is: \({R}_{it}=\frac{{P}_{Ct}-{P}_{Ct-1}}{{P}_{Ct-1}}\), where \({P}_{Ct}\) and \({P}_{Ct-1}\) are the close level of the index the day t and day t-1, respectively.
See Appendix 1.
Generally, the electoral campaign takes 15 natural days before the election day (plus ‘the day of reflection’), except in the case of the November 10, 2019 elections that was 9 natural days.
These seasonal effects are a set of phenomena that refer to the fact that the return of the listed assets is not independent of the day of the week on which they are traded.
This differentiation is because some regional elections are held on the same calendar day. The elections in the Basque Country and Galicia overlaps on two occasions. The elections to the Assembly of Madrid overlap with the rest of the autonomies only one time. See Appendix 2 for more details.
For this reason, if the date of the regional election and the general election coincide, it is removed.
We employ both indices because of they show during the sample period a low correlation coefficient of 0.46. Data is available as open source on the website for Economic Policy Uncertainty (https://www.policyuncertainty.com).
Baker et al. (2016) draw on El Mundo and El País for Spain, whereas Ghirelli et al. (2019) draw on El País, El Mundo, La Vanguardia, ABC, Expansión, Cinco Días, and El Economista. For more details on the indices, follow the link https://www.policyuncertainty.com/spain.html.
From here on, we require a minimum level of significance of 5% for the results to be commented.
References
Alesina A (1987) Macroeconomic policy in a two-party system as a repeated game. Q J Econ 102(3):651–678
Alesina A, Sachs J (1988) Political parties and the business cycle in the United States, 1948–1984. J Money Credit Bank 20(1):63–82
Anderson HD, Malone CB, Marshall BR (2008) Investment returns under right- and left-wing governments in Australasia. Pac-Basin Financ J 16(3):252–267
Baker SC, Bloom N, Steven JD (2016) Measuring economic policy uncertainty. Q J Econ 131(4):1593–1636
Banz RW (1981) The relationship between return and market value of common stocks. J Financ Econ 9:3–18
Belo F, Gala VD, Li J (2013) Government spending, political cycles, and the cross section of stock returns. J Financ Econ 107(2):305–324
Benito-Osorio D, Colino A, Guerras-Martín LA, Zuñiga-Vicente A (2016) The international diversification-performance link in Spain: does firm size really matter? Int Bus Rev 25(2):548–558
Bialkowski J, Gottschalk K, Wisniewski TP (2007) Political orientation of government and stock market returns. Appl Financ Econ Lett 3(4):269–273
Binder JJ (1998) The event study methodology since 1969. Rev Quant Financ Account 11(2):111–137
Bohl MT, Gottschalk K (2006) International evidence on the Democrat premiumand the presidential cycle effect. N Am J Econ Financ 17(2):107–120
Bollerslev T (1986) Generalized autoregressive conditional heteroskedasticity. J Econom 31(3):3017–3327
Brown KD, Harlow WV, Tinic SM (1988) Risk aversion, uncertain information and market efficiency. J Financ Econ 22(2):355–385
Brown KD, Harlow WV, Tinic SM (1993) The risk and required rate of common stock following major innovations. J Financ Quant Anal 28(1):101–116
Cahan J, Malone CB, Powell JG, Choti UW (2005) Stock market political cycles in a small, two-party democracy. Appl Econ Lett 12(12):735–740
Chan KF, Marsh T (2020) Asset prices, midterm elections, and political uncertainty. J Financ Econ 141(1):276–296
Chappell HW, Keech W (1986) Party differences in macroeconomic policies and outcomes. Am Econ Rev 76(2):71–74
Döpke J, Pierdzioch C (2006) Politics and the stock market: evidence from Germany. Eur J Polit Econ 22(4):925–943
Engle R (1982) Autoregressive conditional heterocedasticity with estimates of the variance of United Kingdom inflation. Econometrica 50(4):987–1007
Fama EF, French KR (1992) The cross-section of expected stock returns. J Financ 47(2):427–465
Fama EF, French KR (1995) Size and book to market factors in earnings and returns. J Financ 50(1):131–155
Farinós JE, García CJ, Ibáñez AM, Herrero B (2016) Revolving doors: are they valued in the Spanish stock market? Acad Rev Latinoam Adm 29(2):147–164
Furió D, Pardo A (2012) Partisan Politics Theory and Stock Market Performance: Evidence for Spain. Span Rev Financ Account 41(155):371–392
Ghirelli C, Pérez JJ, Urtasum A (2019) A new economic policy uncertainty index for Spain. Econ Lett 182:64–67
Gómez B, Urquizu I (2015) Political corruption and the end of two-party system after the May 2015 Spanish Regional Elections. Reg Fed Stud 25(4):379–389
Hibbs DA Jr (1977) Political parties and macroeconomic policy. Am Polit Sci Rev 71(4):1467–1487
Hudson R, Keasey K, Dempsey M (1998) Share prices under Tory and Labour governments in the UK since 1945. Appl Financ Econ 8(4):389–400
Johnson RR, Chittenden WT, Jensen GR (1999) Presidential politics, stocks, bonds, bills, and inflation. J Portf Manage 26(1):27–31
Julio B, Yook Y (2012) Political uncertainty and corporate investment cycles. J Financ 67(1):45–83
Meyenberg Y (2017) Disputar la democracia. El caso de Podemos en España. Revista Mexicana De Ciencias Políticas y Sociales 230:221–242
Niederhoffer V, Gibbs S, Bullock J (1970) Presidential elections and the stock market. Financ Anal J 26(2):111–113
Nordhaus WD (1975) The political business cycle. Rev Econ Stud 42(2):169–190
Oehler A, Walker TJ, Wendt S (2013) Effects of election results on stock price performance: evidence from 1980 to 2008. Manag Financ 39(8):714–736
Pantzalis C, Stangeland DA, Turtle HJ (2000) Political elections and the resolution of uncertainty: the international evidence. J Bank Financ 24(10):1575–1604
Pastor L, Veronesi P (2012) Uncertainty about government policy and stock prices. J Financ 67(4):1219–1264
Royo S (2010) Portugal and Spain in the EU: paths of economic divergence (2000–2007). Análise Social XLV 195:209–254
Sánchez O (2017) The (momentary) end of bipartisanship in Spain: Analysis of the electoral results of 2015 and 2016. Rev Esp Derecho Const 109:237–260
Santa-Clara P, Valkanov R (2003) The presidential puzzle: political cycles and the stock market. J Financ 58(5):1841–1872
Simón P (2016) The challenges of the new spanish multipartism: government formation failure and the 2016 general election. S Eur Soc Polit 21(4):493–517
Snowberg E, Wolfers J, Zitzewitz E (2007) Partisan impacts on the economy: evidence from prediction markets and close elections. Q J Econ 122(2):807–829
Sy O, Zaman AA (2011) Resolving the residential puzzle. Financ Manag 40:331–355
Vidal G (2018) Challenging business as usual? The rise of new parties in Spain in times of crisis. West Eur Polit 41(2):261–286
Wagner AF, Zeckhauser RJ, Ziegler A (2018) Company stock price reactions to the 2016 election shock: Trump, taxes, and trade. J Financ Econ 130(2):428–451
Wisniewski TP (2016) Is there a link between politics and stock returns? A literature survey. Int Rev Financ Anal 47:15–23
Acknowledgements
The authors appreciate the useful comments and suggestions from participants in the 35th Global Conference on Business and Finance where an earlier draft of this research was presented. All remaining mistakes are our own.
Funding
Open Access funding provided thanks to the CRUE-CSIC agreement with Springer Nature.
Author information
Authors and Affiliations
Corresponding author
Ethics declarations
Conflict of interest
The authors have no relevant financial or non-financial interests to disclose. The authors have no competing interests to declare that are relevant to the content of this article.
Additional information
Publisher's Note
Springer Nature remains neutral with regard to jurisdictional claims in published maps and institutional affiliations.
Appendices
Appendix 1: Election dates to the general elections
Election date | Winning party | Majority |
|---|---|---|
14 March 2004 | PSOE | Simple |
9 March 2008 | PSOE | Simple |
20 November 2011 | PP | Absolute |
20 December 2015 | PP | Simple |
26 June 2016 | PP | Simple |
28 April 2019 | PSOE | Simple |
10 November 2019 | PSOE | Simple |
Appendix 2: Election dates to the autonomous community elections
Election date | Autonomous Parliament of | Legislature |
|---|---|---|
25 May 2003 | Aragón Principado de Asturias Illes Balears Canarias Cantabria Castilla− La Mancha Castilla y León Comunitat Valenciana Extremadura La Rioja Región de Murcia Comunidad Foral de Navarra | VI |
25 May 2003 | Comunidad de Madrid | VI |
26 October 2003 | Comunidad de Madrid(Asamblea) | VII |
16 November 2003 | Cataluña | VII |
14 March 2004 | Andalucía | VII |
17 April 2005 | País Vasco | VIII |
19 June 2005 | Galicia | VII |
1 November 2006 | Cataluña | VIII |
27 May 2007 | Aragón Principado de Asturias Illes Balears Canarias Cantabria Castilla-La Mancha Castilla y León Comunitat Valenciana Extremadura La Rioja Región de Murcia Comunidad Foral de Navarra | VII |
27 May 2007 | Comunidad de Madrid | VIII |
9 March 2008 | Andalucía | VIII |
1 March 2009 | Galicia | VIII |
1 March 2009 | País Vasco | IX |
28 November 2010 | Cataluña | IX |
22 May 2011 | Aragón Principado de Asturias Illes Balears Canarias Cantabria Castilla-La Mancha Castilla y León Comunitat Valenciana Extremadura La Rioja Región de Murcia Comunidad Foral de Navarra | VIII |
22 May 2011 | Comunidad de Madrid | IX |
25 March 2012 | Andalucía Principado de Asturias | IX |
21 October 2012 | Galicia | IX |
21 October 2012 | País Vasco | X |
25 November 2012 | Cataluña | X |
22 March 2015 | Andalucía | X |
24 May 2015 | Aragón Illes Balears Canarias Cantabria Castilla-La Mancha Castilla y León Comunitat Valenciana Extremadura La Rioja Región de Murcia Comunidad Foral de Navarra | IX |
24 May 2015 | Comunidad de Madrid Principado de Asturias | X |
27 September 2015 | Cataluña | XI |
21 December 2017 | Cataluña | XII |
2 December 2018 | Andalucía | XI |
28 April 2019 | Comunitat Valenciana | X |
26 May 2019 | Aragón Canarias Cantabria Castilla-La Mancha Castilla y León Extremadura La Rioja Región de Murcia Comunidad Foral de Navarra Asturias | X XI |
26 May 2019 | Madrid | XI |
Appendix 3: Election dates to the European parliament
Election date |
|---|
13 June 2004 |
7 June 2009 |
25 May 2014 |
26 May 2019 |
Rights and permissions
Open Access This article is licensed under a Creative Commons Attribution 4.0 International License, which permits use, sharing, adaptation, distribution and reproduction in any medium or format, as long as you give appropriate credit to the original author(s) and the source, provide a link to the Creative Commons licence, and indicate if changes were made. The images or other third party material in this article are included in the article's Creative Commons licence, unless indicated otherwise in a credit line to the material. If material is not included in the article's Creative Commons licence and your intended use is not permitted by statutory regulation or exceeds the permitted use, you will need to obtain permission directly from the copyright holder. To view a copy of this licence, visit http://creativecommons.org/licenses/by/4.0/.
About this article

Cite this article
Castaño, L., Farinós, J.E. & Ibáñez, A.M. The stock market reaction to political and economic changes: the Spanish case. Rev Econ Design 28, 593–630 (2024). https://doi.org/10.1007/s10058-024-00353-1
Received:
Accepted:
Published:
Issue Date:
DOI: https://doi.org/10.1007/s10058-024-00353-1