
Abstract
Purpose
Peri-operative blood loss unaccounted for and post-operative hematocrit decline could have a significant impact on the outcome of elective spinal surgery patients. The study assesses the accuracy of predictive models of hematocrit decline and blood loss in spinal surgery and determines the impact of peri-operative fluid administration on hematocrit levels of patients undergoing first-time single level lumbar fusion surgery for degenerative spine disease and the trend thereof in the first 24 h post-operatively.
Methods
Clinical and biochemical parameters were prospectively collected in patients undergoing single level lumbar spinal surgery. Predictive models were applied to assess their accuracy in intra-operative blood loss and post-operative hematocrit decline.
Results
High correlation (0.98 Pearson correlation coefficient) occurred between calculated (predicted) and recorded hematocrit from hours 2 to 6 post-operatively. Predictive accuracy declined thereafter yet remained moderate. Patients received an average intra-operative fluid volume of 545.45 ml per hour (47% of estimated total blood volume). A significant hematocrit decline occurred post-induction (43.47–39.78%, p < 0.001) with total fluid volume received being the significant contributing variable (p < 0.001). Hypertensive patients were the only subgroup to drop below the safe hematocrit threshold of 30%.
Conclusion
Iatrogenic hemodilution can accurately be predicted for the first six hours post-operatively, with high risk patients identifiable. Fluid therapy should be goal directed rather than generic, and good communication between the surgeon and anesthesiologist remains the cornerstone to manage physiological changes secondary to blood loss. Although helpful, predictive formulas are not universally applicable to all phenotypes.
Introduction
Peri-operative blood loss unaccounted for and post-operative hematocrit decline could have a significant impact on the outcome of elective spinal surgery patients. These losses can occur both through ongoing surgical drain loss or dilutional anemia due to indiscriminate intravenous fluid administration. Several methods exist to detect and predict these losses and dilution, yet it is accuracy in lumbar spinal surgery remains unclear.
Background and literature review
Post-operative anemia has been identified as an independent risk factor for increased post-operative infection [1]. Spahn et al. in a systematic review noted the 30-day post-operative mortality rate to be twice as high in the anemic patient. In addition, their hospital stay was prolonged by 60%. Purvis et al. echoed this and demonstrated that even after adjusting for competing peri-operative confounders, percentage decrease in hematocrit was an important risk factor for the development of hospital-acquired infections (including surgical site sepsis), thrombotic events and ischemic events [2]. They identified the first 24 h as having the highest risk of developing anemia, as well as respiratory complications such as atelectasis in up to 57% of patients [1,2,3].
Hemodilution secondary to excessive fluid administration is associated with adverse tissue healing after surgery [4]. The mechanism involves increased capillary leak, inducing edema and a state of impaired oxygen and metabolite diffusion, more prevalent in the critically ill patient. Further distorted tissue architecture and obstruction of capillary blood flow and lymphatic drainage can occur resulting in disturbed intercellular interactions with potential progressive organ dysfunction [5].
The goal of intra-operative fluid administration is to maintain euvolemia during the surgical procedure, with excessive fluid administration resulting in a pseudo- or dilutional anemia. Intra-operatively it remains the responsibility of both the surgeon and anesthesiologist to recognize proportional blood loss, typically by visual estimation of soiled swabs and suctioned blood volumes. This method is recognized as crude with estimations being inaccurate with up to 50% overestimation in volume, more so in moderate losses (< 500 ml) [6]. Guinn et al. emphasized this by demonstrating that the mean estimated blood loss by anesthesia providers exceeded measured blood loss by 40%. They further noted that estimated blood loss was nearly always greater than measured blood loss, regardless of the total blood volume lost [7].
At greater risk are hypertensive patients. They are known to have a drop in mean arterial pressure during induction, compensated for by larger fluid boluses, placing them at greater risk for hemodilution [8]. Obesity in spine surgery too deserves special attention having consistently been shown to be an independent risk factor for both increased intra-operative blood loss and prolonged surgical time with total body weight influencing fluid administration [9].
Existing formulas to calculate blood loss typically include predicted total blood volume and utilizes amongst others pre- and post-procedural hematocrit values, considering that intra-operative visual estimation of blood loss is notoriously inaccurate [10]. Two formulas considered to be most applicable for these purposes are Nadler’s formula for total blood volume and Gross’s blood loss formula [10, 11], yet a bias exist toward overestimation of the latter [10]. A strong correlation exists between estimated and actual blood volume when using Nadler’s method [11] (though this information in isolation provides little benefit) [11].
The incidence of hemodilution in the surgical intensive care unit (ICU) during the post-operative period is poorly defined, yet it too can result in increased rates of pulmonary congestion, poor wound healing and delayed recovery adversely affecting outcome [12]. In ICU, hematocrit is monitored by arterial blood gas (ABG) evaluation with value of 30% being accepted as a safe threshold for elective surgical patients [13, 14]. Typically a starved post-operative patient has a defined fluid administration prescribed, often a per-weight calculation. Lahsaee et al. demonstrated that over a 105-min time period, 158.ml of 0.9% normal saline resulted in a mean hematocrit decline of 1% in adult patients [15].
Post-operative drain losses have been proposed as a potential source of ongoing blood loss, however this remains disputed in the literature [16]. Zou et al. reported on 183 lumbar spinal fusion surgery patients who had a mean surgical drain volume of 176 ml at 24 h. They emphasized that this volume was not pure blood, but included serous fluid and residual intra-operative wash, having no effect on hemoglobin or hematocrit [17]. Spinal fusion surgery has been identified as a high risk procedure for hemoglobin and hematocrit decline. In reviewing 532 patients undergoing lumbar spinal fusion, Grant et al. noted a greater risk of intra-operative blood loss and a mean positive peri-operative fluid balance of 3400 ml [16]. This impressive positive fluid balance alone places patients at much greater risk for large fluctuations in hematocrit before considering procedural blood loss [16].
If a patient’s immediate post-operative hematocrit value as well as the exact volume of intravenous fluid administered is known, one should theoretically be able to predict hematocrit decline in the post-operative period. This is valuable in attempting to maintain hematocrit values above the 30% safe threshold. No such literature assessing this predictive model in spinal surgery patients exists.
Study aims and objectives
The study aims to assess the accuracy of predictive models of both hematocrit decline and blood loss in spinal surgery and determine the impact of peri-operative fluid administration on hematocrit levels of patients undergoing first-time single level lumbar fusion surgery for degenerative spine disease, and the trend thereof in the first 24 h post-operatively.
Methodology
Materials and methods
A retrospective analysis of a prospectively collected cohort of patients undergoing first-time single level lumbar fusion surgery was conducted on patients’ time-matched clinical and biochemical parameters in the Department of Neurosurgery at Tygerberg Academic Hospital in Cape Town, South Africa. Institutional and ethical approval was obtained under the number S20/01/019.
Inclusion criteria
Adult patients admitted for first-time elective single level spinal fusion surgery for degenerative pathology were included. All patients spent a minimum of 24 h in the Intensive Care Unit. Co-morbidities were noted and patients were only included if the co-morbidity was controlled.
Exclusion criteria
Pediatric patients (under the age of 18); patients with previous lumbar surgery and those with uncontrolled co-morbidities were excluded from the study. Patients who were found to be newly diagnosed or poorly controlled hypertensives following admission for surgery were also excluded.
Data collected
Details collected included the following: Anthropometric measurements and BMI calculation (obesity defined as BMI > 30, severe obesity defined as BMI > 35), hypertensive history and control, hematocrit values taken at 12 standardized time points peri-operatively (immediately pre-operatively and at post-operative hours 1, 2, 3, 4, 6, 8, 10, 12, 16, 20, 24), intra-operative blood loss, post-operative surgical site drain loss and all fluid input and output during the first 24 h post-operatively (including urine output). Arterial blood gas analysis was performed on the same calibrated machine. The peri-operative period was defined as the period of time from the initiation of anesthesia until the time at which the patient was discharged from the recovery unit and sent to the ICU.
Intra-operative blood loss was calculated by recording blood loss in suction units at the end of the procedure and correcting for the volume of saline wash used during the procedure. Surgical swabs and drapes were assessed for occult blood loss and documented.
Formulas used
Estimated total blood volume was calculated using Nadler’s formula; (height(m)3 × 0.367) + (weight (kg) × 0.032) + 0.604 (for males), or (height(m)3 × 0.356) + (weight (kg) × 0.033) + 0.183 (for females).
Estimated blood loss was calculated using Gross’ formula; Total blood loss = Estimated blood volume x (pre-operative hematocrit—post-operative hematocrit)/average hematocrit. Calculated values were compared to actual recorded blood loss.
Estimated post-operative hematocrit decline was calculated by subtracting 1% from the immediate post-operative hematocrit value for every 158.1 ml of normal saline administered. These calculated values were compared to recorded blood gas analysis values.
Values obtained from the above calculations were compared to actual recorded values and analyzed by means of Pearson correlation coefficient to assess for a linear correlation.
Numerical data is described using means (with standard deviations) or medians (with quartiles) if the data was skewed. All statistical procedures were described using Microsoft Excel with the PhStat add-in (version 2.5) and STATA (version 12.0).
Results
Demographics
A total of 38 patients were included in the study (10 males, 28 females). Eighteen patients had pre-existing hypertension. BMI was categorized as under 30 kg/m2 (15 patients), 30–35 kg/m2 (14 patients) and over 35 kg/m2 (9 patients).
Blood Loss
The mean observed intra-operative blood loss was 501.35 ml (median 500 ml, range 150–1100 ml). Mean post-operative surgical drain volume was 208.26 ml with an average total blood loss (peri-operative and drain loss) of 709.61 ml over the first 24 h (18.9% of patients’ proportional total blood volume).
Hematocrit decline
Mean pre-operative hematocrit was 43.47% (median 42.45%, range 26.3–55.2%).
A significant decline of 3.69% occurred prior to skin incision to 39.78% (P < 0.001). Hematocrit decline continued until 20 h post-surgery to a mean value of 32% (Fig. 1).

Change in median hematocrit percentage for study population shown at analyzed time intervals. The first two time points demonstrate hematocrit value immediately pre-operatively and second immediately post-induction of anesthesia and prior to commencement of surgery
High correlation occurred between calculated (predicted) and recorded Hct from hours 2 to 6 post-operatively (highest 2 h post-operatively at 0.938 correlation). Predictive accuracy declined thereafter from hour six post-operatively and continued down to hour 24 (correlation coefficient of 0.630) (Fig. 4).
Moderate correlation existed (Pearson correlation values of 0.537 and 0.587, respectively) between calculated and measured blood loss at immediately, and 24 h post-operatively.
Subgroups
-
Hypertensive: Mean pre-operative hematocrit was 40.3%, dropping by 2.02% to 38.28% immediately post-induction (P = 0.093). 22% dropped below 30% safe threshold.
-
Normotensive patients: A significant mean decline in hematocrit of 3.01% from 44.16% to 41.15% (P < 0.001) was observed (Fig. 2). No drop below the 30% safe threshold was observed.
Fig. 2 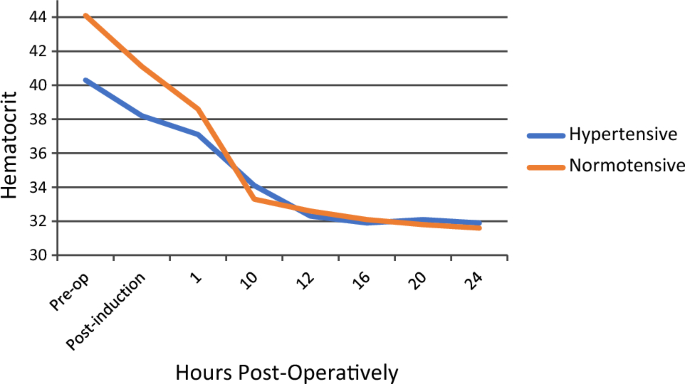
Change in median hematocrit percentage for study population shown at analyzed time intervals comparing hypertensive to normotensive participants. The first two time points demonstrate hematocrit value immediately pre-operatively and second immediately post-induction of anesthesia and prior to commencement of surgery
-
BMI < 30 kg/m2: A significant drop of 2.27% (p < 0.001) was observed.
-
BMI > 30 kg/m2, < 35 kg/m2: A significant drop of 2.33% (p < 0.001) was observed.
-
BMI > 35 kg/m2: No significant drop noted.

Fluid volumes
Average peri-operative fluid administered was 1695.03 ml, equating to 47% of the patient’s estimated total blood volume over an average time of 138.7 min. 74% was delivered intra-operatively (average 1260.9 ml) and 26% (average 434.13 ml) administered in the recovery unit prior to transfer to the intensive care unit. Average volume per hour peri-operatively is 545.45 ml. Mean urine output peri-operatively was 381.25 ml. During the total study time in ICU (24 h) patients received a mean fluid volume of 2306.7 ml (96.1 ml per hour) with an average urine output of 1246.2 ml (no difference in BMI grouping and fluid administered).
Total proportional volume of fluid received (i.e., volume of fluid received as a percentage of total blood volume) proved to be the most significant variable in accounting for drop in Hct in both uni- and multivariate analysis with larger volumes resulting in larger Hct decline (P < 0.001). (Fig. 3).

Change in median hematocrit percentage plotted against volume of normal saline received by patients expressed as a proportion of their total blood volume. The red line demonstrates the trend of hematocrit decline as proportionally more fluid is administered
Intra-operative fluid administration Subgroups:
-
Hypertensive: Mean intra-operative fluid volume of 1342ml (33.85% of their estimated total blood volume) (Table 1)
-
Normotensive patients: Mean intra-operative fluid volume of 1142.3ml (29.74% of their estimated total blood volume) (Table 1)
-
BMI < 30kg/m2: Mean intra-operative fluid volume of 1007.1ml (28.9% of total blood volume (Table 2)
-
BMI >30kg/m2, <35kg/m2: Mean intra-operative fluid volume of 1345.8ml (31.56% of total blood volume) (Table 2)
-
BMI > 35kg/m2: Mean intra-operative fluid volume of 1442.9ml (35.79% of total blood volume) (Table 2)
Discussion
Posterior lumbar spinal surgery presents several challenges to both the anesthetist and surgeon affecting blood pressure and bleeding of the surgical site (Fig. 4). Even before any surgical intervention, the prone position itself affects numerous physiological parameters. It increases intra-abdominal pressure, compromises pulmonary compliance and causes alterations in peak airway pressures [18]. The above results in decreased venous return with subsequent engorgement of collateral veins (increasing blood loss) and a decrease in cardiac output [19]. By means of trans-oesophageal echocardiography and pulmonary arterial pressure measurement, the prone position has been proven to significantly reduce stroke volume, cardiac output and cardiac index [20, 21]. Although surgeons typically take utmost care to prevent abdominal compression during prone positioning, it is well anticipated for by anesthesiologists and prevented by a higher fluid administration volume.

Calculated post-operative hematocrit value versus actual measured hematocrit value expressed as a Pearson correlation value. The accuracy of these calculated values is demonstrated for each analyzed time point in the post-operative period
Hypertensive patients are generally accepted to be approximately 10% intravascularly depleted when compared to the general population [22]. Induction of anesthesia results in a loss of vasomotor tone, leading to a drop in the MAP which is exaggerated in the hypertensive population, and which is compensated for by a fluid pre-load [7]. This was seen in our results with the hypertensive population receiving 17% more intra-operative fluid than non-hypertensives, resulting in 22% of these patients dropping to below a hematocrit of 30% immediately post-induction, prior to any surgical blood loss, and 30% being accepted as the safe threshold for elective surgery [5, 9]. In the non-hypertensive group, not a single patient had a significant hematocrit drop (< 30%) post-induction.
In obese patients, the weight increase is disproportionate to the intravascular volume, yet the latter is often erroneously over-estimated resulting in larger fluid volume administration. Severely obese patients received 7% more proportional volume than their counterparts with normal BMI’s. This could be explained by the fact that fluids were administered based on total body mass as opposed to total actual blood volume, pointing to the fact that fluid use is often more generic rather than targeted.
With surgical blood loss typically over-estimated, particularly if communication between the surgeon and anesthesiologist is poor, fluid over-administration can easily occur, notwithstanding pre-existing fluid administration in prone positioned, hypertensive or obese patients, particularly if not physiologically relevant. [20] In a lengthy procedure, repeat ABG analysis is helpful, yet in the studied procedure (single level lumbar fusion surgery) the surgical time is too short. Accurately predicting blood loss allows for improved patient counseling on risks and more targeted fluid therapy. The use of formulae to achieve this seems a simple solution, however this method has been shown to grossly inaccurate. Jaramillo et al. compared directly observed blood loss with calculated blood loss using six different formulae. They noted that all formulae had a bias toward gross overestimation, but that Gross’ blood loss formula proved most valuable for predicting blood product transfusion needs [10]. In contrast, accurate estimation of total blood volume appears completely plausible. Donovan et al. demonstrated a strong correlation between estimated and measured total blood volume (Though this information in isolation is of little value).
When applying Gross’s blood loss equation to estimate blood loss to guide fluid administration to our data set, the correlation to actual loss was moderate at best between estimated and actual blood loss values. This is not unexpected—these formulas assessing static parameters (i.e., patient weight, height, gender, etc.) are unable to provide consistently reliable estimates for patients across a wide spectrum of phenotypes. Approaches using dynamic patient parameters (stroke volume variance, pulse pressure variance, etc.) allow real time physiological changes to dictate fluid therapy. This constitutes the underlying principle of goal directed fluid therapy—a method with growing evidence to support its efficacy and safety in spinal surgery.
Goal directed fluid therapy (GDFT) aims to direct peri-operative vasopressor and fluid administration to mitigate unnecessary and dangerous hemodynamic changes and has demonstrated improved post-operative recovery and decreased length of stay [23, 24]. GDFT utilizes dynamic parameters such as pulse pressure and stroke volume variation to administer a uniquely tailored fluid volume for each patient. It was previously thought to be useful only for a select group of patients with very specific volume requirements (cardiac), yet recent literature supports it becoming more common practice for a wider array of surgical procedures and patients—including spinal surgery [25].
Overall, our patients received a mean fluid volume equivalent to 42% (ranging from 19 to 71%) of their estimated total blood volume over the course of the procedure (roughly 2 h). Post-operative fluid administration was generic rather than tailored to specific body weight, typically approximately 90 ml per hour in the high or intensive care units.
Predictive modeling for the hematocrit decline and blood loss yielded mixed results in our study. Hours 2 to 6 post-operatively showed high prediction accuracy followed by a subsequent linear decline thereafter. This indicates a period where urinary diuresis has not yet satisfactorily compensated for peri-operative fluid overloading. The accuracy decline would then represent compensatory mechanisms, likely unique for each individual.
The treating surgeon must actively assess for and avoid fluid overload during the patient’s admission. Pre-operatively, patients should be starved for as short as possible and receive intravenous fluids when indicated so as to mitigate post-induction hypotension. Peri-operatively, correct patient positioning to facilitate venous return should be accommodated as far as possible. Blood loss should be measured objectively and communicated to all team members. Post-operatively, early initiation of enteral feeds and cessation of intravenous fluid remains a simple and effective method to avoid unnecessary fluid administration.
Limitations
The study group was healthy with controlled co-morbidities thus the subgroups of hypertension and obesity were not recruited in that fashion. The study period was 24 h only for the hematocrit values. The sample size analyzed in this study was only 38 patients. Future studies enrolling larger patient numbers with co-morbidities as inclusion criteria would yield further valuable information.
Conclusion
Iatrogenic hemodilution can accurately be predicted for the first six hours post-operatively, with high risk patients identifiable. Fluid therapy should be goal directed rather than generic, and good communication between the surgeon and anesthesiologist remains the cornerstone to manage physiological changes secondary to blood loss. Although helpful, predictive formulas are not universally applicable to all phenotypes.
References
Spahn DR (2010) Anemia and patient blood management in hip and knee surgery: a systematic review of the literature. Anesthesiology 113:482–495
Purvis T, Goodwin C, Molina C, Frank S, Sciubba D (2018) Percentage change in hemoglobin level and morbidity in spine surgery patients. J Neurosurg Spine 28(3):345–351
Mavros MN, Falagas GC (2011) Atelectasis as a cause of postoperative fever: where is the clinical evidence? Chest 140:418–424
Kayilioglu S, Dinc T, Sozen I, Bostanoglu A, Cete M, Coskun F (2015) Postoperative fluid management. World J Crit Care Med 4(3):192
Claure-Del Granado R, Mehta R (2016) Fluid overload in the ICU: evaluation and management. BMC Nephrol 17(1)
Rothermel L, Lipman J (2016) Estimation of blood loss is inaccurate and unreliable. Surgery 160(4):946–953
Guinn N, Broomer B, White W, Richardson W, Hill S (2013) Comparison of visually estimated blood loss with direct hemoglobin measurement in multilevel spine surgery. Transfusion 53(11):2790–2794
Südfeld S, Brechnitz S, Wagner J, Reese P, Pinnschmidt H, Reuter D, Saugel B (2017) Post-induction hypotension and early intraoperative hypotension associated with general anaesthesia. Br J Anaesth 119(1):57–64
Patel N et al (2007) “Obesity and spine surgery: Relation to perioperative complications. J Neurosurg: Spine 6(4):291–297. https://doi.org/10.3171/spi.2007.6.4.1
Jaramillo S, Capitan D (2020) Perioperative blood loss: estimation of blood volume loss or haemoglobin mass loss? [Preprint]. doi:https://doi.org/10.2450/2019.0204-19
Donovan RL et al (2021) Estimation of blood volume and blood loss in primary total hip and knee replacement: an analysis of formulae for perioperative calculations and their ability to predict length of stay and blood transfusion requirements. J Orthop 24:227–232. https://doi.org/10.1016/j.jor.2021.03.004
Makaryus R, Miller T, Gan T (2018) Current concepts of fluid management in enhanced recovery pathways. Br J Anaesth 120(2):376–383
Gross J (1983) Estimating allowable blood loss. Anesthesiology 58(3):277–280
Messmer K (1987) Acceptable hematocrit levels in surgical patients. World J Surg 11(1):41–46
Lahsaee SM, Ghaffaripour S, Hejr H (2013) The effect of routine maintenance intravenous therapy on hemoglobin concentration and hematocrit during anesthesia in adults. Bull Emerg Trauma 1(3):102–107
Grant M, Whitman G, Savage W, Ness P, Frank S (2013) Clinical predictors of postoperative hemoglobin drift. Transfusion 54(6):1460–1468
Zou H, Li Z, Sheng H, Tan M, Yang F, Liang L, Zhao J (2015). Intraoperative blood loss, postoperative drainage, and recovery in patients undergoing lumbar spinal surgery. BMC Surg 15(1)
Koh JC, Lee JS, Han DW, Choi S, Chang CH (2013) Increase in airway pressure resulting from prone position patient placing may predict intraoperative surgical blood loss. Spine (Phila Pa 1976) 38:E678–E82. https://doi.org/10.1097/BRS.0b013e31828cb3e5
Schonauer C, Bocchetti A, Barbagallo G, Albanese V, Moraci A (2004) Positioning on surgical table. Eur Spine J 13(Suppl. 1):S50–S55. https://doi.org/10.1007/s00586-004-0728-y
McNulty SE, Weiss J, Azad SS, Schaefer DM, Osterholm JL, Seltzer JL (1992) The effect of the prone position on venous pressure and blood loss during lumbar laminectomy. J Clin Anesthesia 4:220–225. https://doi.org/10.1016/0952-8180(92)90070-H
Yokoyama M, Ueda W, Hirakawa M, Yamamoto H (1991) Hemodynamic effect of the prone position during anesthesia. Acta Anaesthesiol Scand 35:741–744. https://doi.org/10.1111/j.1399-6576.1991.tb03382.x
Bing R, Smith A (1981) Plasma and interstitial volumes in essential hypertension: relationship to blood pressure. Clin Sci 61(3):287–293
Cecconi M, Corredor C, Arulkumaran N et al (2013) Clinical review: goal-directed therapy-what is the evidence in surgical pa- tients? The effect on different risk groups. Crit Care 17:209
Chong MA, Wang Y, Berbenetz NM, McConachie I (2018) Does goal-directed haemodynamic and fluid therapy improve peri-operative outcomes? A systematic review and meta- analysis. Eur J Anaesthesiol 35:469–483
Thiele RH, Raghunathan K, Brudney CS, Lobo DN, Martin D, Senagore A et al (2016) American society for enhanced recovery (ASER) and perioperative quality initiative (POQI) joint consensus statement on perioperative fluid management within an enhanced recovery pathway for colorectal surgery. Perioper Med (Lond) 5:24
Funding
Open access funding provided by Stellenbosch University.
Author information
Authors and Affiliations
Corresponding author
Ethics declarations
Conflict of interest
None declared.
Additional information
Publisher's Note
Springer Nature remains neutral with regard to jurisdictional claims in published maps and institutional affiliations.
Rights and permissions
Open Access This article is licensed under a Creative Commons Attribution 4.0 International License, which permits use, sharing, adaptation, distribution and reproduction in any medium or format, as long as you give appropriate credit to the original author(s) and the source, provide a link to the Creative Commons licence, and indicate if changes were made. The images or other third party material in this article are included in the article's Creative Commons licence, unless indicated otherwise in a credit line to the material. If material is not included in the article's Creative Commons licence and your intended use is not permitted by statutory regulation or exceeds the permitted use, you will need to obtain permission directly from the copyright holder. To view a copy of this licence, visit http://creativecommons.org/licenses/by/4.0/.
About this article

Cite this article
Walker, I.S., Vlok, A.J., Esterhuizen, T.M. et al. Prediction of hematocrit decline and the impact of peri-operative fluid use in lumbar spinal fusion surgery. Eur Spine J 33, 307–313 (2024). https://doi.org/10.1007/s00586-023-07977-x
Received:
Revised:
Accepted:
Published:
Issue Date:
DOI: https://doi.org/10.1007/s00586-023-07977-x