
Abstract
Purpose
To elucidate the normative values of whole body sagittal alignment and balance of a healthy population in the standing position; and to clarify the relationship among the alignment, balance, health-related quality of life (HRQOL), and age.
Methods
Healthy Japanese adult volunteers [n = 126, mean age 39.4 years (20–69), M/F = 30/96] with no history of spinal disease were enrolled in a cross-sectional cohort study. The Oswestry Disability Index (ODI) questionnaire was administered and subjects were scanned from the center of the acoustic meati (CAM) to the feet while standing on a force plate to determine the gravity line (GL), and the distance between CAM and GL (CAM–GL) was measured in the sagittal plane. Standard X-ray parameters were measured from the head to the lower extremities. ODI was compared among age groups stratified by decade. Correlations were investigated by simple linear regression analysis. Ideal lumbar lordosis was investigated using the least squares method.
Results
The present study yielded normative values for whole standing sagittal alignment including head and lower extremities in a cohort of 126 healthy adult volunteers, comparable to previous reports and thus a formula for ideal lumbar lordosis was deduced: LL = 32.9 + 0.60 × PI − 0.23 × age. There was a tendency of positive correlation between McGregor slope, thoracic kyphosis, PT, and age. SVA, T1 pelvic angle, sacrofemoral angle, knee flexion angle, and ankle flexion angle, but not CAM–GL, increased with age, suggesting that the spinopelvic alignment changes with age, but standing whole body alignment is compensated for to preserve a horizontal gaze. ODI tended to increase from the 40s in the domain of pain intensity, personal care, traveling, and total score. ODI weakly, but significantly positively correlated with age and PI–LL.
Conclusion
Whole body standing alignment even in healthy subjects gradually deteriorates with age, but is compensated to preserve a horizontal gaze. HRQOL is also affected by aging and spinopelvic malalignment.
Introduction
The human skeleton works like a “reverse pendulum” during standing with the chain of balance starting from the support polygon (both feet), then moving to the lower limb skeleton with the ankles, knees, hip joints, the pelvic vertebra; then the spinal segments; and finally, the cephalic vertebra working as a pendulum to achieve horizontal vision and balance. These elements together contribute to the characteristic erect posture of humans, where the “cone of economy” is perfectly balanced with minimal muscle action [1]. Deterioration of standing spinal balance decreases health-related quality of life (HRQOL) [2–6]. Based on conventional X-ray, Schwab et al. reported that pelvic tilt (PT), pelvic incidence (PI), and lumbar lordosis (LL) combined with the sagittal vertical axis (SVA) predict disability, and proposed threshold values for severe disability [Oswestry Disability Index (ODI) >40] including: PT ≥22°, SVA ≥47 mm, and PI–LL ≥11° [7]. In case of decompensated standing balance, the trunk shows an increased SVA, the pelvis retroversed, the hip extended, and the knee flexed, suggesting the uneconomic alignment affects HRQOL [1, 8]. Therefore, a better understanding of alignment from the head to the feet will elucidate the “cone of economy” mechanism. Standardized data for whole skeletal alignment in the standing position have not been fully provided, however, likely due to the limitations of conventional X-ray measurements in which a fan-beam X-ray significantly magnifies the objects at the cassette margin [9].
A new scanning X-ray imaging system (EOS Imaging, Paris, France) was developed by multidisciplinary investigators to overcome the limitations of conventional X-ray measurement. Simultaneous anteroposterior and lateral X-rays of the whole body can be obtained using the three-dimensional bone external envelop technique, allowing for three-dimensional reconstruction at every level of the osteo-articular system, especially the spine, in the standing position. This X-ray system allows for more precise bone reconstruction in orthopedics, especially at the level of the spine, pelvis, and lower limbs, with limited X-ray exposure [10, 11]. In 2013, the authors initiated prospective clinical studies of standing spino-pelvic alignment and various pathologies using the X-ray imager.
In the present study, we hypothesized that the whole body standing sagittal alignment and HRQOL deteriorate with age even in the healthy population, but the compensatory mechanism plays a role to maintain the global alignment to preserve a horizontal gaze. The purposes of this study were (1) to elucidate the normative values of the whole body sagittal alignment of a healthy population in the standing position; and (2) to clarify the relationship among the alignment, age, and HRQOL.
Materials and methods
Following approval by the institutional review board, 136 volunteers without history of treatment for spinal disease were enrolled. Informed consent was obtained from all patients. After X-ray images were obtained as described below, we excluded four cases with lumbarisation, two cases with sacralisation, two cases with 11 thoracic vertebrae, and two cases with scoliosis >20° Cobb angles, so that accurate radiographic measurements could be obtained. Exclusion of the transitional vertebrae is important because transitional vertebrae affect spinal and pelvic parameter measurements. Consequently, we analyzed a total of 126 cases [mean age 39.4 years (20–70 years); 30 men, 96 women] prospectively. The epidemiologic and morphologic characteristics of this cohort were obtained from the following data: age, sex, weight, and height. Body mass index (BMI) was calculated as weight in kilograms divided by square of the height in meters.
Health-related quality of life: the Oswestry Disability Index (ODI) [12]
The Japanese version of the ODI [13], which has been validated worldwide [12], was used for evaluating HRQOL. Higher back pain and leg pain scores (0–10 rating scales) indicate increasing disability and pain, and decreasing scores indicate improvement.
Alignment and balance measurements
The default scan speed of the scanning X-ray imaging system is 7.6 cm/s. Therefore, acquisition time is linked to scan height: time of acquisition (s) = height of acquisition (cm)/7.6. Therefore, subtle artifacts in the images can occur due to body sway during scanning, but the artifacts are minimized because of the rapid X-ray detection time (0.8333 ms) with no blurring of the images. The radiographs [10, 14] were completed routinely and the track of the center of gravity was simultaneously recorded using a force plate as follows:
-
Radiographs were made from the center of the acoustic meati (CAM) to the feet.
-
Each patient was asked to stand comfortably on the force plate with their hands placed on the cheeks. The arm position is recommended to avoid overlap of the hand and T1 vertebral body, which is a key vertebra to measure thoracic kyphosis, T1–T12.
-
A mirror placed at eye level in the inner wall of the imager box helped the patient maintain a horizontal gaze (Fig. 1).
Fig. 1 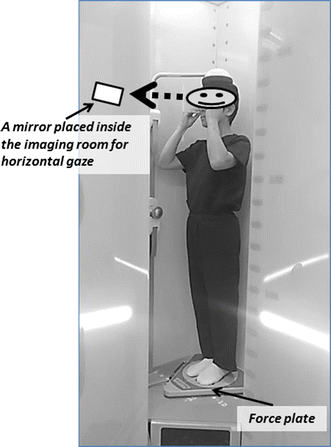
Position of the subject in the scanning X-ray imaging room
-
Measured parameters.

Balance parameter by force plate measurement
Radiographic measurement alone cannot determine the dynamic standing balance; therefore, we measured subtle body sway during the X-ray scanning using a force plate (ANIMA Corp., Tokyo, Japan), and investigated the relationship between the spinopelvic alignment and dynamic parameters. The track of gravity center (GC) was recorded for 30s including X-ray scanning interval in the transverse plane. Mean location of the track was defined as the mean GC and a vertical line from the mean GC as the gravity line (GL) (Fig. 2). Distance between CAM and GL in the sagittal plane (CAM–GL) was also measured. Regarding dynamic parameters, enveloped area of the track of the GC (ENV) was calculated as a representative dynamic parameter with software attached to the force plate. A smaller ENV represents lesser body sway, resembling a smaller cone of Dubousset’s standing balance concept [1].

X-ray imaging and a simultaneous standing balance measurement system with a force plate. CAM–GL distance between the center of acoustic meati (CAM) and the vertical line from the mean gravity center determined by a force plate measurement (GL) in the sagittal plane
Global alignment: (Fig. 3)
In addition to CAM–GL described above, the sagittal vertical axis (SVA) was defined as the linear offset of C7 in regard to the posterosuperior corner of S1 [7]. The angle between the line from the hip axis (HA) to the center of the T1 vertebra and to the bisection of the line of base of sacrum was defined as T1 pelvic angle (TPA) [15].

Sagittal craio-spino-pelvic alignment: (Fig. 3)
Regarding cranio-cervical alignment, the slope of McGreger’s line (McGS) [16] and cervical lordosis between the lower endplate of C2 and that of C7 (C2–7 lordosis) were measured. T1–T12 and T4–T12 thoracic kyphosis (Kyph), L1–L5, L1, and S1 lumbar lordosis (LL), sacral slope (SS), pelvic tilt (PT), pelvic incidence (PI), and pelvic thickness (PTh) [17] were measured as the standard sagittal alignment parameters.
Lower extremity alignment: (Fig. 3)
Extension of hip joints was represented by sacro-femoral angle (SFA), [18] the angle between the line from HA to the midpoint of the bilateral notches of the femoral condyles and to the bisection of the line of base of sacrum. A knee flexion angle (KneeFlex) was defined as a mean of bilateral knee flexions angles between the line from HA to the midpoint of the bilateral notches of the femoral condyles and the line from the notch to the midpoint of distal tibial joint surfaces. A ankle flexion angle (AnkleFlex) was defined as a mean angle of bilateral ankle flexion angles between the line from the midpoint of the bilateral notches of the femoral condyles to the midpoint of distal tibial joint surfaces and the plumb line from the midpoint of distal tibial joint surfaces.
Statistical analysis
Statistical analyses were performed using JMP software package (version 5.0.1a; SAS Institute, Cary, NC). A p value of less than 0.05 was considered statistically significant. Subjects were divided into five age groups: 20s (n = 27), 30s (n = 42), 40s (n = 32), 50s (n = 17), and 60s (n = 8), among which there were no significant sex differences, and ODI was compared among age groups with one-way ANOVA. Simple linear regression analysis was used to determine correlations among all radiographic parameters; among the radiographic parameters and age; between balance parameter, ENV, and age/PI–LL; and between ODI score and age/PI–LL. A multivariate logistic regression analysis with a forward stepwise procedure (p < 0.25 for entry and p < 0.10 for exclusion) was used for the purpose of clarifying what the best combination of independent (predictor) variables would be to predict the dependent (predicted) variable: an ideal LL. As the first step, all the demographic and radiographic parameters were included, but ODI was not included because of the influence was minimal (the subjects are healthy volunteers). Then the best predicted LL was modeled from the extracted independent variables by the least squares method to compare with previous studies [19–22].
Results
Demographic and radiographic parameters
Mean value with standard deviation (SD), standard error (SE), and 25 %/75 % interquartile ranges of all demographic and radiologic standard parameters are reported in Table 1. Distributions of all the parameters were normal except age.
The Oswestry Disability Index (ODI)
Because the subjects were normal volunteers without spine disease, mean ODI values in all domains were very low. The values tended to increase from the 40s in the domain of pain intensity, personal care, traveling, and total score (Table 2).
Correlations among radiographic parameters using a simple linear regression analysis
There was a strong positive correlation (R > 0.4) between McGS and Kyph, Kyph and LL, LL and SS, LL and PI, SS and PI, PT and PI. PT and TPA, PT and SFA, PI and SFA, and KneeFlex and AnkleFlex. On the other hand, there was a strong negative correlation (R > 0.4) between SS and PTh, PI and PTh, and TPA and SVA (Table 3).
Correlations between radiographic parameters and age using simple linear regression analysis
There was a tendency of positive correlation between McGS (R = 0.328, p = 0.0002), Kyph (R = 0.207, p = 0.0200) and age, but no correlation between LL and age. There was a tendency of positive correlation between PT or PI and age, but no correlation between SS and age. PT and PI increased with age according to the regression equation: PT = 3.0 + 0.2 × age (R = 0.3146, p = 0.0003), and PI = 44.3 + 0.2 × age (R = 0.197, p = 0.0269), respectively (Fig. 4). SVA, TPA, SFA, KneeFlex, and AnkleFlex, but not CAM–GL, increased with age. SVA and KneeFlex increased with age according to the regression equation: SVA = −3.1 + 0.08 × age (R = 0.3906, p < 0.0001), KneeFlex = −5.5 + 0.1 × age (R = 0.2490, p = 0.0049), respectively (Fig. 5).

Relationships among age and radiographic parameters with statistically significant correlation. McGS (a), thoracic kyphosis (T1–T12) (b), PT (c), and PI (d) in relation to age

Relationships between global sagittal parameters/KneeFlex and age. a Sagittal vertical axis (SVA) vs age, b CAM-GL vs age, c KneeFlex vs age
Balance parameter measured by force plate measurement
Mean ± SD (Max/Min) of ENV, a representative dynamic balance parameter, was 0.55 ± 0.29 (0.09/1.71) cm2. EMV had a tendency of positive correlation with age (R = 0.2620, p = 0.0030) (Fig. 6a). ENV also had a tendency of positive correlation with PI–LL (Fig. 6b).

Relationship between dynamic balance parameter. a Enveloped area of the track of gravity center (ENV) and age, b relationship between ENV and PI–LL [20]
Correlations between ODI and age using simple linear regression analysis
Because the subjects were normal volunteers without spine disease, the mean total score of ODI (%) was very low. ODI, however, deteriorated with age. The equation was ODI = 0.36 + 0.12 × age (R = 0.2143, p = 0.01664). ODI had also a tendency of positive correlation with spino-pelvic mismatch (PI–LL) [7, 20]. The equation was ODI = 5.62 + 0.12 × (PI–LL) (R = 0.1969, p = 0.0277).
Prediction of ideal lumbar lordosis (LL)
With a forward stepwise multivariate logistic regression (p < 0.25 for entry, p < 0.10 for exclusion) on an ideal LL, age, sex, SVA, C2–7 lordosis, Kyph, PI, SS, PTh, and AnkleFlex were selected as contributing factors from all the demographic and radiographic parameters evaluated. The logistic regression model following the stepwise regression analysis revealed the following equation with regression coefficient R = 0.9701, p < 0.0001.
-
1.
Ideal LL = 8.88 − 0.08 × age − 0.86 × sex − 0.82 × SVA − 0.56 × C2–7 lordosis + 0.45 × Kyph − 0.09 × PI + 1.12 × SS − 0.89 × PTh − 0.14 × AnkleFlex (sex: 0 males, 1 female).
According to a basic concept on the relationship between LL and PI [17], a simplistic equation was deduced. Ideal LL = 26.2 + 0.56 × PI. (R = 0.5502, p < 0.0001). On the other hand, since PI was also positively correlated with age (Fig. 4d), we produced a formula using PI and age which are independent of spinal deformity, while SVA, Kyph, SS, or PT are dependent on spinal deformity.
-
2.
Ideal LL = 32.9 + 0.60 × PI − 0.23 × age (R = 0.5955, p < 0.0001) (Fig. 7).
Fig. 7 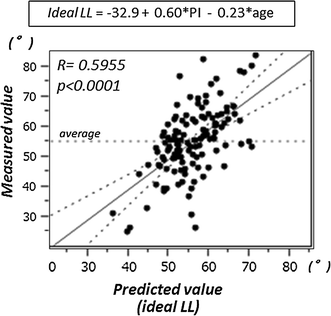
Prediction of ideal lumbar lordosis. Least squares method with factors of PI and age
Akaike information criterion (AIC) and Bayesian information criterion (BIC) of each model are (1) AICc = 633.4, BIC = 662.3, and (2) AICc = 919.0, BIC = 930.0, respectively. Therefore, model (1) seems better than model (2) statistical point of view. Model (1) is, however, not realistic for the evaluation of patients with spinal deformity. Because the most of the spinal parameters in patients with deformity might have been out of normal range of the values. Therefore, in the preoperative planning, the parameter which might not be influenced by the disease should be included in the model. PI is such a permanent parameter. In the present study, PI was also positively correlated with age (Fig. 4d). Thus, we produced a formula using PI and age which are independent of spinal deformity. We have been using the simple formula for surgical planning, and obtained good results.

Discussion
In the present study, we investigated sagittal whole body skeletal alignment and standing balance used a scanning X-ray imager with a biplanar upright scanning imaging modality to achieve reduced X-ray particle scatter, improved image quality, and significantly reduced radiation to the patient [10, 11, 14]. While artifacts in the images due to body sway during scanning may affect the measurements, these are minimized by the rapid scan rate (7.6 cm/s) and X-ray detection time (every 0.8333 ms). Furthermore, we strictly excluded all subjects with anomalous vertebrae such as transitional vertebrae and scoliosis with a Cobb angle >20°, which can affect measurement precision. Thus, the data in this study are considered to be precise. The present study yields a physiologic standard for several angular pelvic and spinal parameters that describe sagittal whole spinal alignment, including knee alignment, in a cohort of 126 healthy adult volunteers (Table 1). The standing sagittal alignment was similar to previous studies. The correlations among the radiographic parameters of sagittal alignment were also comparable with previous reports [17, 20–34]. The correlation was stronger between the parameters of the adjacent structures, indicating the chain of balance advocated by Dubousset (Table 3) [1]. More than two decades ago, Duval–Beaupère’s group found PI, which is the most significant unique parameter of individual standing spinal alignment, i.e., a large PI is associated with a great SS and a pronounced LL, and a low PI is associated with a smaller SS and a subtle LL, leading to a basic concept of “équilibre économique” in standing [1, 17, 23, 29, 35, 36]. Itoi et al. [37] investigated the relationship between sagittal posture of the spine and the lower extremities in osteoporotic subjects, and found that thoracic kyphosis, a primary deformity, was compensated for by the lumbar spine, sacroiliac joint, hip joint, and knee joint. Another study suggested that upright posture is secondary to hip extension and LL, and an optimal and economic standing posture is obtained when these two parameters are balanced [8]. These reports suggest that lower extremities are also crucial factors for standing balance. When the biomechanics of standing balance are taken into account, contact force on the distal lumbar spine is the sum of the gravity force and the force acting on the posterior muscles to maintain an erect position. The more unbalanced the body (forward inclined), the greater the increase in gravity force, and the more the force acting on the muscles must compensate for increasing contact force [36]. In the present study, SVA, TPA, SFA, KneeFlex, and AnkleFlex, but not CAM–GL, increased with age (Fig. 5), suggesting that hip extension, knee flexion, and ankle flexion are also an important compensation mechanism for deteriorating standing alignment with degenerative changes or aging. A linear regression analysis between standard spinal parameters and (PI–LL), the key parameter of spino-pelvic mismatch, showed that PT more significantly correlated with PI–LL (R = 0.8565, p < 0.0001) than Kyph (R = 0.3626, p < 0.0001). On the other hand, KneeFlex and AnkleFlex were not significantly correlated with PI–LL (KneeFlex: R = 0.0696, p = 0.4386, AnkleFlex: R = 0.0871, p = 0.3323) (Table 3), suggesting that pelvic alignment, represented by PT, is the primary mechanism for compensation in cases of spino-pelvic mismatch and the alignment of lower extremities are the last resort to compensate for standing whole skeletal alignment when PT is maximally functioning. These findings are compatible with a recent report [38].
ODI is a principal condition-specific outcome measure used in the management of low back disorders. Fairbank et al. stated that the mean ODI score in the normal population is 10.2. Thus, the mean ODI score of less than 10 reported by our patients (women: 5.5, men: 4.2, Table 2) can be regarded as normal [12, 39]. The score in the present study had a positively correlation with age. A recent report indicated that aging affects general health status measured by another HRQOL outcome measure (the SRS-22) with deteriorating standing alignment [40]. Therefore, the relationship between HRQOL and age is considered universal, and may be due to degenerative spinal changes. In the present study, PI–LL, a representative parameter of spino-pelvic mismatch [21], was positively correlated with age, suggesting that spino-pelvic harmony deteriorates with age. Furthermore, ODI score had also a tendency of positive correlation with PI–LL. This finding suggests that ODI is affected not only by degenerative processes, but also by spinopelvic malalignment.
Each patient’s spine status and shape is unique, even if general rules apply to most. In spinal reconstruction surgery, the final alignment of the spine can be planned before surgery. The surgical goal is to achieve optimal global sagittal alignment by restoring an optimal LL for patients with sagittal malalignment deformities [1, 19, 21, 28]. For this purpose, several formulae predicting an ideal LL have been reported. Duval–Beaupère’s group reported that a key point in standing sagittal alignment of the spine is a harmony of LL and PI and deduced the following formula: Ideal LL = −9.13847 + 0.19225 × T1–T12 Kyphosis + 1.54225 × SS − 0.26799 × PI + 1.39705 × T9 Tilt. (R 2 = 0.9441, p < 0.0001) [19]. In the present study, we deduced the following equation with a least square analysis, Ideal LL = −11.30537 + 0.14094 × T1–T12 Kyphosis + 1.63650 × SS − 0.35750 × PI + 1.40833 × T9 Tilt (R 2 = 0.935494, p < 0.0001). Although the subjects in the two reports differed in terms of age, sex, race, or X-ray measurement, the formulae are very similar. Xu et al. investigated standing spinal alignment in a Chinese population, and reported that PI and age are independent factors contributing to the difference of LL and deduced the predictive formula: LL = 28.6 + 0.508 × PI − 0.088 × Age [22]. Although the intercept and coefficient values of PI are similar, the coefficient of age was higher in our study. The reason for the difference between the two formulae is considered to be due to: (1) precision of X-ray measurement (conventional X-ray vs scanning X-ray imaging), (2) age distribution (our study included older subjects), and (3) race. Disk degeneration is more prominent in older people; thus more attention must be paid to age as a contributing factor to the formula for ideal LL. A recent study reported that ideal spino-pelvic alignment values that correspond to patient-reported outcomes increased with age, with older patients having substantially greater baseline deformity [41]. Further study is necessary to elucidate the effect of aging on the spino-pelvic alignment and HRQOL.
Human beings must maintain balance when standing still. Several clinical studies using a force plate have been performed to investigate the balance mechanism [42–47]. El Fegoun et al. [43] reported a highly significant negative correlation between the gravity line and plumbline in the sagittal plane based on simultaneous assessment of full-length freestanding spine radiographs and the floor projection of the center of pressure (gravity line), suggesting that the value of the plumbline as a marker of true postural balance must be questioned. We investigated balance using a force plate measurement during X-ray scanning and found that a representative balance parameter, ENV, had a tendency of positive correlation with PI–LL, suggesting that spino-pelvic mismatch affects not only the static sagittal alignment but also dynamic alignment, balance. There are many subjects to clarify the profound mechanism of the “cone of economy” [1] of the chain of balance of the standing whole body.
In conclusion,
-
1.
The present study yielded normative values for whole standing sagittal alignment and balance including head and lower extremities in a cohort of 126 healthy adult volunteers, comparable to previous reports and thus a formula for ideal lumbar lordosis was deduced: LL = 32.9 + 0.60 × PI − 0.23 × age.
-
2.
There was a tendency of positive correlation between McGS, Kyph, PT, PI, and age. SVA, TPA, SFA, KneeFlex, and AnkleFlex, but not CAM–GL, increased with age, suggesting that the spinopelvic alignment changes with age, but standing whole body alignment is compensated for to preserve a horizontal gaze.
-
3.
HRQOL measured by ODI was affected by degenerative processes and spinopelvic malalignment.
References
Dubousset J (1994) Three-dimensional analysis of the scoliotic deformity. In: Weinstein SL (ed) Pediatric spine: principles and practice. Raven Press, New York, pp 480–481
Glassman SD, Berven S, Bridwell K et al (2005) Correlation of radiographic parameters and clinical symptoms in adult scoliosis. Spine 30:682–688
Glassman SD, Bridwell K, Dimar J et al (2005) The impact of positive sagittal balance in adult spinal deformity. Spine 30:2024–2029
Kim YJ, Bridwell KH, Lenke LG et al (2006) An analysis of sagittal spinal alignment following long adult lumbar instrumentation and fusion to L5 or S1: can we predict ideal lumbar lordosis? Spine 31:2343–2352
Smith JS, Bess S, Shaffrey CI et al (2011) Dynamic changes of the pelvis and spine are key to predicting postoperative sagittal alignment following pedicle subtraction osteotomy: a critical analysis of preoperative planning techniques. Spine 37(10):845–853
Pellise F, Vila-Casademunt A, Ferrer M, et al. (2015) Impact on health related quality of life of adult spinal deformity (ASD) compared with other chronic conditions. Eur Spine J 24:3–11
Schwab F, Blondel B, Bess S et al (2013) Radiographical spinopelvic parameters and disability in the setting of adult spinal deformity. Spine 38:E803–E812
Le Huec JC, Charosky S, Barrey C, Rigal J, Aunoble S (2011) Sagittal imbalance cascade for simple degenerative spine and consequences: algorithm of decision for appropriate treatment. Eur Spine J 20(Suppl 5):S699–S703
Boulay C, Tardieu C, Hecquet J, Benaim C, Mitulescu A, Marty C, Prat-Pradal D, Legaye J, Duval-Beaupère G (2005) Anatomical reliability of two fundamental radiological and clinical pelvic parameters: incidence and thickness. Eur J Orthop Surg Traumatol 15:197–204
Dubousset J, Charpak G, Dorion I et al (2005) Le système EOS: Nouvelle imagerie ostéo-articulaire basse dose en osition debout. E-mèmoire de l’Académie Nationale de Chirurgie 4:22–27
Deschenes S, Charron G, Beaudoin G et al (2010) Diagnostic imaging of spinal deformities: reducing patients radiation dose with a new slot-scanning X-ray imager. Spine 35:989–994
Fairbank JCT, Pynsent PB (2000) The Oswestry Disability Index. Spine 25:2940–2953
Fujiwara A, Kobayashi N, Saiki K et al (2003) Association of the Japanese Orthopaedic Association Score with the Oswestry Disability Index, Roland–Morris Disability Questionnaire, and Short-Form 36. Spine 28:1601–1607
Carreau JH, Bastrom T, Petcharaporn M et al (2014) Computer-generated, three-dimensional spine model from biplanar radiographs: a validity study in idiopathic scoliosis curves greater than 50 degrees. Spine Deform 2:81–88
Protopsaltis T, Schwab F, Bronsard N et al (2014) The T1 pelvic angle, a novel radiographic measure of global sagittal deformity, accounts for both spinal inclination and pelvic tilt and correlates with health-related quality of life. J Bone Jt Surg Am 96:1631–1640
McGreger M (1948) The significance of certain measurements of the skull in the diagnosis of basilar impression. Br J Radiol 21(244):171–181
Duval-Beaupère G, Schmidt C, Cosson PH (1992) A Barycentremetric study of the sagittal shape of spine and pelvis. Ann Biomed Eng 20:451–462
Mangione P, Senegas J (1997) L’équilibre rachidien dans le plan sagittal. Rev Chir Orthop Reparatrice Appar Mot 83:22–32
Boulay C, Tardieu C, Hecquet J et al (2006) Sagittal alignment of spine and pelvis regulated by pelvic incidence: standard values and prediction of lordosis. Eur Spine J 15:415–422
Schwab F, Lafage V, Patel A et al (2009) Sagittal plane considerations and the pelvis in the adult patient. Spine 34:1828–1833
Schwab F, Patel A, Ungar B et al (2010) Adult spinal deformity—postoperative standing imbalance. How much can you tolerate? An overview of key parameters in assessing alignment and planning corrective surgery. Spine 35:2224–2231
Xu L, Qin X, Zhang W et al (2015) Estimation of the ideal lumbar lordosis to be restored from spinal fusion surgery. Spine 40:1001–1005
Duval-Beaupère G, Robain G (1987) Visualization on full spine radiographs of the anatomical connections of the centres of the segmental body mass supported by each vertebra and measured in vivo. Intern Orthop 11:261–269
During J, Goudfrooij H, Keessen W et al (1985) Toward standards for posture. Postural characteristics of the lower back system in normal and pathologic conditions. Spine 10:83–87
Gelb DE, Lenke LG, Bridwell KH et al (1995) An analysis of sagittal spinal alignment in 100 asymptomatic middle and older aged volunteers. Spine 20:1351–1358
Jackson RP, McManus AC (1994) Radiographic analysis of sagittal plane alignment and balance in standing volunteers and patients with low back pain matched for age, sex, and size. A prospective controlled clinical study. Spine 19:1611–1618
Korovessis PG, Stamatakis MV, Baikousis AG (1998) Reciprocal angulation of vertebral bodies in the sagittal plane in an asymptomatic Greek population. Spine 23:700–704
Lazennec JY, Ramare S, Arafati N et al (2000) Sagittal alignment in lumbosacral fusion: relations between radiological parameters and pain. Eur Spine J 9:47–55
Legaye J, Duval-Beaupere G, Hecquet J, Marty C (1998) Pelvic incidence: a fundamental pelvic parameter for three-dimensional regulation of spinal sagittal curves. Eur Spine J 7:99–103
Vaz G, Roussouly P, Berthonnaud E, Dimnet J (2002) Sagittal morphology and equilibrium of pelvis and spine. Eur Spine J 11:80–87
Bernhardt M, Bridwell KH (1989) Segmental analysis of the sagittal plane alignment of the normal thoracic and lumbar spines and thoracolumbar junction. Spine 14:717–721
Stagnara P, de Mauroy JC, Dran G et al (1982) Reciprocal angulation of vertebral bodies in a sagittal plane: approach to references for the evaluation of kyphosis and lordosis. Spine 7:335–342
Vialle R, Levassor N, Rillardon L et al (2005) Radiographic analysis of the sagittal alignment and balance of the spine in asymptomatic subjects. J Bone J Surg Am 87A:260–267
Kanemura T, Yoshida G, Ishikawa Y et al (2011) Sagittal spino-pelvic alignment in an asymptomatic Japanese population—comparison of Western population. J Spine Res 2:52–58
Legaye J, Hecquet J, Marty C, Duval-Beaupere G (1993) Equilibre sagittal du rachis. Relations entre bassin et courbures rachidiennes sagittales en position debout. Rachis 3:215–226
Roussouly P, Pinheiro-Franco JL (2011) Biomechanical analysis of the spino-pelvic organization and adaptation in pathology. Eur Spine J 20:S609–S618
Itoi E (1991) Roentgenographic analysis of posture in spinal osteoporosis. Spine 16:750–756
Diebo BG, Ferrero E, Lafage R et al (2015) Recruitment of compensatory mechanisms in sagittal spinal malalignment is age and regional deformity dependent. Spine 40:642–649
Fairbank JC, Couper J, Davies JB, O’Brien JP (1980) The Oswestry low back pain disability questionnaire. Physiotherapy 66(8):271–273
Daubs MD, Hung M, Neese A et al (2014) Scoliosis Research Society-22 results in 3052 healthy adolescents aged 10 to 19 years. Spine 39:826–832
Lafage R, Schwab F, Challier V, et al. (2016) Defining Spino-Pelvic Alignment Thresholds: Should Operative Goals in Adult Spinal Deformity Surgery Account for Age? Spine 41:62–68
Gangnet N, Pomero V, Dumas R, Skalli W, Vital JM (2003) Variability of the spine and pelvis location with respect to the gravity line: a three-dimensional stereoradiographic study using a force plate. Surg Radiol Anat 25:424–433
El Fegoun AB, Schwab F, Gamez L et al (2005) Center of gravity and radiographic posture analysis: a preliminary review of adult volunteers and adult patients affected by scoliosis. Spine 30:1535–1540
Schwab F, Lafage V, Boyce R, Skalli W, Farcy JP (2006) Gravity in analysis in adult volunteers. Spine 31:E959–E967
Lafage V, Schwab F, Skalli W et al (2008) Standing balance and sagittal plane spinal deformity. Analysis of spinopelvic and gravity line parameters. Spine 33:1572–1578
Mac-Thiong JM, Transfeldt EE, Mehbod AA et al (2009) Can C7 plumbline and grabity ilne predict health related quality of life in adult scoliosis? Spine 34:E519–E527
Steffen JS, Obeid I, Aurouer N et al (2010) 3D postural balance with regard to gravity line: an evaluation in the transversal plane on 93 patients and 23 asymptomatic volunteers. Eur Spine J 19:760–767
Acknowledgments
The authors are deeply grateful to the great mentor, Prof. Jean Dubousset (Académie Nationale de Médecine, Paris, France), for his profound advice.
Author information
Authors and Affiliations
Corresponding author
Ethics declarations
Conflict of interest
None of the authors has received any grant or financial support for the present study.
Rights and permissions
Open Access This article is distributed under the terms of the Creative Commons Attribution 4.0 International License (http://creativecommons.org/licenses/by/4.0/), which permits unrestricted use, distribution, and reproduction in any medium, provided you give appropriate credit to the original author(s) and the source, provide a link to the Creative Commons license, and indicate if changes were made.
About this article

Cite this article
Hasegawa, K., Okamoto, M., Hatsushikano, S. et al. Normative values of spino-pelvic sagittal alignment, balance, age, and health-related quality of life in a cohort of healthy adult subjects. Eur Spine J 25, 3675–3686 (2016). https://doi.org/10.1007/s00586-016-4702-2
Received:
Revised:
Accepted:
Published:
Issue Date:
DOI: https://doi.org/10.1007/s00586-016-4702-2