
Abstract
Engineering drawings are commonly used across different industries such as oil and gas, mechanical engineering and others. Digitising these drawings is becoming increasingly important. This is mainly due to the legacy of drawings and documents that may provide rich source of information for industries. Analysing these drawings often requires applying a set of digital image processing methods to detect and classify symbols and other components. Despite the recent significant advances in image processing, and in particular in deep neural networks, automatic analysis and processing of these engineering drawings is still far from being complete. This paper presents a general framework for complex engineering drawing digitisation. A thorough and critical review of relevant literature, methods and algorithms in machine learning and machine vision is presented. Real-life industrial scenario on how to contextualise the digitised information from specific type of these drawings, namely piping and instrumentation diagrams, is discussed in details. A discussion of how new trends on machine vision such as deep learning could be applied to this domain is presented with conclusions and suggestions for future research directions.
1 Introduction
An engineering drawing (ED) is a schematic representation which depicts the flow or constitution of a circuit, device, process or facility. Some examples of EDs include logical gate circuits, mechanical or architectural drawings. There is an increasing demand in different industries for developing digitisation frameworks for processing and analysing these diagrams. Having such framework will provide a unique opportunity for relevant industries to make use of large volumes of diagrams in informing their decision-making process and future practices.
Digitising EDs require applying digital image processing techniques through a sequence of steps including preprocessing, symbol detection, classification and some times require inferring the relations between symbols within the drawings (contextualisation). Several review papers that discuss digitising these drawings or similar type of documents is available in the literature. Some review papers were mainly dedicated to the domain of the documents or engineering drawings. These include review papers on analysing musical notes [13], conversion of paper-based mechanical drawings into CAD files for 3D reconstruction [64, 109], and optical character recognition (OCR) [70, 78], and [88]. Other reviews focused on specific components of the digitisation process, such as symbols detection [25, 28], symbols representation [133], and symbols classification [1, 76].
Motivated by a partnership between academia and the Oil & Gas industry, a subset of EDs called complex EDs has been identified in practice [87]. Some examples are chemical process diagrams, complex circuit drawings, process flow diagrams (PFDs), sensor diagrams (SDs) and piping and instrumentation diagrams (P&IDs). An example of the latter is shown in Fig. 1. For this type of drawings, not only the digitisation process becomes a harder task, but there is a requirement of contextualising data, which means the interpretation of the digitised information in accordance with a rule set for a specific application.
Example of a process and instrumentation diagram (P&ID)
In particular, P&ID digitisation has received large attention from a commercial standpointFootnote 1,Footnote 2,Footnote 3 given the wide range of applications that can be developed from a digital output, such as security assessment, graphic simulations or data analytics. Some methods which specifically intended to solve P&ID digitisation can be found in the literature. More than thirty years ago, Furuta et al. [48] and Ishii et al. [59] presented work towards implementing a software to achieve fully automated P&ID digitisation. These approaches have now become obsolete given the incompatibility with current software and hardware requirements. Around ten years later, Howie et al. [56] presented a semi-automatic method in which symbols of interest were localised using the template of the symbols as input. Most recently, Gellaboina et al. [49] presented a symbol recognition method which applied an iterative learning strategy based on the recurrent training of a neural network (NN) using the Hopfield model. This method was designed to find the most common symbols in the drawing, which were characterised by having a prototype pattern.
In this paper, recent and relevant articles, conference contributions, and other related literature have been thoroughly reviewed and critically discussed. To the best of the authors’ knowledge, recent literature in this area is very limited, considering the recent advances in machine vision, machine learning and deep learning. This paper shows clearly that there is a gap between the recent advances in processing and analysing images and documents (which can be measured by orders of magnitudes), and such important application domain. The main contributions of this paper can be outlined as follows:
-
1.
Define a general digitisation framework for complex EDs.
-
2.
Review and critically discuss existing related literature in relation to the proposed digitisation framework.
-
3.
Present and discuss a real case-study based on collaboration with industries.
-
4.
Provide a review of recent advances in machine vision and deep learning in the context of EDs.
-
5.
Outline future research directions where recent advances can be utilised for the processing and analysis of complex EDs.
The rest of the paper is structured as follows. First, the challenges of complex ED digitisation and the general framework for digitisation are provided in Sect. 2. A review of related work of existing digitisation methods is presented in Sect. 3. In Sect. 4 we discuss the contextualisation problem both in literature and in the Oil & Gas industrial practice. Section 5 provides a glance into the increasingly evolving world of deep learning and presents how the most novel methods presented in this area may be applied. Finally, conclusions and future perspectives are presented in Sect. 6.
2 Challenges
The digitisation and contextualisation of complex EDs conveys the following limitations:
2.1 Size
It is estimated that on average, a single page of a P&ID contains around 100 different types of shapes (i.e. symbols, connectors and text), and to represent a single section of a plant, from 100 to 1000 pages may be required [11].
2.2 Symbols
In addition to the inherent classical machine vision problems such as light, scale and pose variations, these drawings use equipment symbols with different standards for different industriesFootnote 4. Therefore, compiling a well-defined and clearly labelled dataset that can be used for symbol classification is a complicated task. Having such collection of well-defined symbols is of paramount to benefit from advanced techniques for symbol recognition based on deep learning.
2.3 Connections
Complex EDs contain a dense and entangled amount of connecting lines which represent both physical and logical relations between symbols. These are depicted using lines of different styles and thickness, which restricts the use of digitisation methods based on thinning [47] or vectorising [15] the drawing for line detection. Furthermore, complex EDs follow application-based connectivity rule sets. This means that two symbols may or may not be connected depending on a standard which cannot be explicitly deducted by means of the physical lines which connect the symbols. As a result, contextualisation becomes an even more challenging task compared to its implementation on simpler drawings such as circuit diagrams [93]. This raises several interesting possibilities, for instance, the incorporation of human expert knowledge in a potential solution by means of human machine interaction. Interactive learning could be another possible direction [92].
2.4 Text
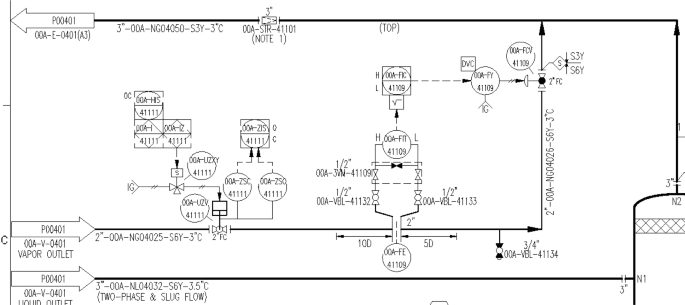
Codes and annotations in different fonts and styles are used to distinguish symbols with a similar geometry, identify connectors and clarify additional information; however text characters may overlap with symbols, connectors, or other characters. Methods such as Cao et al. [18] and Roy et al. [104] have pointed out the difficulty of identifying overlapping characters in document images. Furthermore, three challenges have been identified once all text characters have been detected: (1) strings of text describing symbols and connector are represented using arbitrary lengths and sizes as shown in Fig. 2, (2) associating the corresponding text to symbols and connectors is not a straightforward task and (3) text interpretation is prone to errors, and thus some information can be misinterpreted.

A sample of a P&ID illustrating the distribution of text strings within the drawing
Addressing these challenges requires applying a series of methods, mainly from the machine vision domain. These include symbols detection and localisation, features extraction and others. In addition, machine learning is often applied for symbols/text classification. A framework for engineering drawing digitisation that encapsulates the underlying stages is shown in Fig. 3. Such framework will be very beneficial to industries, where diagrams can be transformed into knowledge. It is worth pointing out here that despite the recent advances in machine vision and machine learning, in particular in shape detection and classification, these advances have not been tested against such challenging and real-life problem.

General framework for ED digitisation towards contextualisation
Moreover, in Table 1 we summarise the reviewed literature according to their usability for different types of document images at each stage of our proposed framework.
3 Related work
3.1 Preprocessing
Engineering drawings require some form of preprocessing before applying more advanced methods. One of the basic and essential methods is binarisation. Binarisation, also known as image thresholding, is useful for removing noise and improving object localisation. There are several variants used in the literature, such as global thresholding [94], local thresholding, adaptive thresholding [105], amongst others [89].
Thinning or skeletonisation is another preprocessing method used on image recognition systems to discard the volume of an object often considered as redundant information [61]. While thinning the image has been a recurrent preprocessing method for symbol detection [28], methods such as [7] avoided its use, since it caused problems when intending to detect solid or bold regions (such as arrows) or to differentiate the thickness of connectors.
Skew correction can be achieved through morphological operations to remove salt-pepper type noise [31] or algorithms based on morphology [30]. Recently, Rezaei et al. [101] presented a survey on methods for skew correction in printed drawings and proposed a supervised learning to improve such task.
Once the raster image has been cleaned, some digitisation methods propose to work on a vectorised version of the drawing. Vectorisation is the conversion of a bitmap into a set of line vectors. Dealing with line vectors instead of a raster image may result more convenient for subsequent tasks, since it is more possible to apply heuristics to vectors rather than to a collection of pixels which by themselves, provide no further information besides their location and intensity. However, vectorisation for a non-segmented image may result in the generation of multiple vectors which may not necessarily represent the desired shapes. Some examples of methods based on vectorisation for drawing interpretation are [15] for circuit diagrams or [112] for handmade mechanical drawings.
3.2 Shape detection
Broadly speaking, most shape detection approaches can be categorised as either specific or holistic. On the one hand, specific methods focus on the identification of symbols, text or connectors as a particular task. This scope is used when the characteristics of certain shapes are identified in advance. In this sense, Ablameyko et al. [1] present methods which aim at detecting shapes such as arrowheads, cross-hatched areas, arcs, dashed and dot-dashed lines. On the other hand, shape detection as a holistic process is based on the principle that there must be a cohesion between symbols, connections and text, and therefore a set of rules can be established to split the image into layers representing these categories. An example of this workflow is the text/graphics segmentation (TGS) framework [44]. Table 2 summarises the shape detection methods discussed in this section according to the aforementioned categorisation.
3.2.1 Specific shape detection
Heuristic-based methods are based on identifying the graphical primitives that compose symbols. Okazaki et al. [93] categorised symbols in EDs as either loop or loop-free symbols. Loop symbols consist of at least one closed primitive (e.g. a circle, a square or a rectangle) and usually comprise the majority of symbols found on EDs. Meanwhile, loop-free symbols are composed either by a single stroke or by parallel line segments. Figure 4 shows examples of these symbols on a P&ID.

Examples of loop symbols (left) and loop-free symbols (right) on P&IDs
Yu et al. [126] presented a system for symbol detection based on a consistency attributed graph (CAG) through the use of a window scanning. The method first created block adjacency graph (BAG) structures [127] while scanning the image. Afterwards, symbols and connectors were stored in a smaller BAG. Simultaneously, the larger BAG was preprocessed and vectorised so that symbols were detected based on a window search linear decision-tree method. This solution is complex in computation and application dependant. A similar method for symbol detection was presented by Datta et al. [31] where a recursive set of morphological opening operations was used to detect symbols in logical diagrams based on their blank area.
Connectors, when represented as solid vertical and horizontal lines, can be identified using methods such as canny edge detection [17], hough lines [39, 81] or morphological operations. These methods initially detect all lines which are larger than a certain threshold. Naturally, many false positive lines could be detected, such as large symbols or margin lines. To discard them, line location or geometry is used as parameters. An algorithm to detect connector lines in circuit diagrams was presented by De et al. [32], where all vertical and horizontal lines were detected using morphological operations, then the remaining pixels were assumed to be symbols, and finally symbols were reconstructed by scanning the image containing all lines to complete the loops of the symbols found. This approach can only be used for drawings containing loop symbols. Moreover, Cardoso et al. [19, 20] used a graph-based approach to detect lines in musical scores, where black pixels were represented as nodes, and their relation with neighbouring black pixels was represented with edges.
Overlapped connectors create junctions which have to be identified for a proper interpretation of the connectivity. Junction detection methods can be implemented right after the vectorisation or during the detection process. Pham et al. [96] proposed a method for junction detection based on image skeletonisation, where candidate junctions were extracted through dominant point detection. This allowed distortion zones to be detected and reconstructed. A review on other junction detection methods was published by Parida et al. [95].
Some connectors may be represented through dashed or dot-dashed lines. For the detection of these elements, some literature has been devoted on dash and dot-dash detection. These methods not only deal with the detection of dashes, but also with grouping these dashes as a single entity based on the direction of each dash. Such is the case of the method by Agam et al. [3], where a morphological operation called “tube-direction” was defined to calculate the edge plane of a dash and find the dashes with a similar trajectory. This and other methods were compiled by Dori et al. [37] and evaluated by Kong et al. [68].
Several reviews have been published on methods for text detection in printed documents, such as Ablameyko et al. [1], Lu et al. [78] and Kulkarni et al. [70]. Ablameyko et al. [1] found that text can be identified at two stages: before or after vectorisation. Moreover, text was commonly identified by using heuristic-based methods which select text characters or strings through certain constraints such as size, lack of connectivity, directional characteristics or complexity. For instance, Kim et al. [67] developed a method to detect text components by analysing its complexity in terms of strokes and pixel distribution. Nonetheless, most of the text detection methods in literature have made use of a holistic approach.
3.2.2 Holistic shape detection
Holistic methods are based on splitting the image into layers, which later facilitates the detection of individual shapes across the layers created. Groen et al. [52] proposed to divide the image into two layers, a line figure image layer and a text layer, by selecting all small and isolated elements as text. Afterwards, the line layer is divided into two more layers: a separable objects layer (symbols) and an interconnecting structure layer (connectors) by applying skeletonisation to the drawing and identifying all loops in the skeleton as symbols. This method was designed for very simple EDs where the difference between text and symbols was clear, there was no overlapping, the ED contained only loop symbols and all connectors were represented as solid lines.
Bailey et al. [7] used the chain code representation [46] to separate symbols from text and connectors. Chain code represents the boundary pixels of a shape by selecting a starting point, and then recording the path followed by the boundary pixels using a string with 8 possible values according to the location of the neighbouring boundary pixel. Hence, by setting an area threshold, all elements with an area smaller than this value are labelled as non-symbols. An approach of this nature demands a high-quality input with no broken edges. Moreover, a threshold to discern shapes many not be viable due to the variability of size in shapes.
One of the most representative forms of segmenting text in images is TGS. It is possible to identify a vast amount of literature related to TGS methods which may have a general purpose [44, 110], or be designed for a certain type of document images, such as maps [18, 80, 104, 108], book pages [26, 42, 115] and EDs [15, 36, 54, 66, 71, 79]. TGS frameworks consist in two steps: character detection and string grouping.
In 1988, Fletcher et al. [44] presented a TGS algorithm based on connected component (CC) analysis [97] and discarding non-text components based on a size threshold. To select this threshold, the average area of all CCs was calculated and multiplied by a factor of n depending on the characteristics of the drawing. Also, the average height-to-width ratio of a character (if known in advance) could be used to increase precision. To group characters into strings, the Hough transform [55] was applied to all centroids of the text CCs. This TGS system presents some notable disadvantages, such as the lack of detection of overlapping text, a high computational complexity on the string grouping, and a minimum requirement of three characters to conform a string.
Lu et al. [79] presented a TGS method for Western and Chinese characters. Graphics were separated from the drawing based on erasing large line components and non-text shapes by analysing the stroke density of the CCs. String grouping was achieved by “brushing” the characters, using an erosion and opening morphological operations which generated new CCs, followed by a second parameter check which restored miss-detected characters into their respective strings. This method dealt better with the problem of text overlapping lines, since most characters are left on the image and can be recovered on the last step. However, it was prone to identify false positives (such as small components or curved lines) and depended on text strings to be apart from each other so that the last step was executed correctly.
Tombre et al. [110] revisited the method by Fletcher et al. [44] by increasing the number of constraints on the character detection step. In addition, they proposed a third layer where small elongated elements (i.e. “1”, “|”, “l”, “-” or dashed lines) were stored. After applying a string grouping method depending on the size and distribution of the characters, small elongated element was restored into the text layer according to a proximity analysis with respect to the text strings. Other improvements of the method proposed by Fletcher et al. [44] are He et al. [54], where clustering was used to improve each step, Lai et al. [71], where the string grouping step was executed by means of a search of aligned characters and arrowhead detection, and Tan et al. [108], who proposed the use of a pyramid version of the text layer to group characters into strings.
More recent TGS approaches such as Cote et al. [29] attempt to classify each pixel instead of the CCs. This method assigned each pixel into text, graphics, images or background layers by using texture descriptors based on filter banks and on the measurement of sparseness. To enhance these vectors, the characteristics of the neighbouring pixels and of the image at different resolutions were included. Pixels are then assigned to their respective layer by using a support vector machine (SVM) classifier trained with pixel information obtained from ground truth images.
An example of TGS frameworks used in other domains is Wei et al. [116] applied for colour scenes based on an exhaustive segmentation approach. First, multiple copies of the image were generated using the minimum and maximum grey pixel value as threshold range. Then, candidate character regions were determined for each copy based on CC analysis, and non-character regions were filtered out through a two-step strategy composed of a rule set and a SVM classifier working on a set of features, i.e. area ratio, stroke-width variation, intensity, Euler number [50] and Hu moments [57]. After combining all true character regions through a clustering approach [40], an edge cut algorithm was implemented to perform string grouping. This consisted on first establishing a fully connected graph of all characters, and then calculating the true edges based on a second SVM classifier which used a second set of features, i.e. size, colour, intensity and stroke width.
The success of a TGS framework relies on the parameters used to localise text characters. Therefore, if any of the properties of text characters are known in advance, the process can be executed in a more efficient way. It has been noticed that complex EDs (such as P&IDs) present loop symbols that contain text inside, as shown in Fig. 4. Thus, by localising these symbols in advance, it is possible to analyse the text characters within and to learn their properties. This heuristic was applied and evaluated by Moreno-Garcia et al. [87] on P&IDs, showing that not only the precision of TGS frameworks increased, but that the runtime decreased as well. While properties such as height, width and area can be easily obtained from text inside symbols, in P&IDs it is not possible to learn the string length, given its variability in size and distribution, as shown in Fig. 5.

Different examples of text detected across a P&ID
3.3 Feature extraction and representation
Once symbols are segmented, samples can be refined to enhance their quality. Afterwards, a set of features is extracted from these images. If so, these features have to be represented through a data structure. This section discusses methods to perform such tasks.
3.3.1 Shape refinement
Ablameyko et al. [1] proposed symbol refinement through geometric corrections. This process consisted on the following steps: (1) all lines constituting the shape must be converted into strictly vertical or horizontal line segments, (2) all near parallel lines must become parallel and (3) junction points of all lines must be evaluated for continuity. This sequence of operations reduced the loss of information assuming that the design of symbols was based on clearly defined templates. However, this is not always the case, especially for drawings that are updated over time.
De et al. [32] proposed a method where symbols were reconstructed, jointed or disjointed through a series of image iterations based on the median dimensions of a symbol. Consequently, the method inferred how to auto-complete broken shapes. This method was designed for symbols in circuit diagrams only, and therefore authors had a well-defined library of symbols to facilitate this task.
There are also interactive approaches that find unexpected operators on the image, such as hidden lines in 3D shapes depicted as 2D representations. In this sense, Meeran et al. [82], presented a scenario where automated visual inspection was used to integrate several representations of a single shape and reconstruct it. Although this approach serves a different purpose, it is interesting to remark that on some EDs found in practice, there is a common occurrence of miss-depicted symbols due to lack of space or overlapping representations, and a similar methodology could be of great use.
3.3.2 Extraction of features
Feature extraction is the process of detecting certain points or regions of interest on images and symbols which can be used for classification. In 3-channel images such as outdoor scenes or medical images, the most common features used are corner points [103], maximum curvature points [107] and maximum or minimum local intensities. This aspect, referred in literature as image registration, has been addressed in the past by surveys such as [134]. Moreover, some of the most popular feature extraction methods such as SIFT [77] and SURF [9] have been evaluated by Mikolajczyk et al. [84], where an extension of SIFT was proposed to achieve the best performance for a large collection of outdoor scenes.
Features for symbols obtained from document images are categorised as either statistical-based or structural based [124]. Statistical descriptors use pixels as the primitive information, reducing the risk of deformation but not guaranteeing rotation or scale-invariance. Meanwhile, structural descriptors are characterised by the use of vector-based primitives, offering rotation and scale-invariance at the cost of risk on vector deformation in the presence of noise or distortion. Table 3 summarises the feature extraction approaches found in the selected ED digitisation literature according to these categories.
The most straightforward approach to perform statistical feature extraction is by considering each symbol as a binary array of \(n\times m\) pixels, where n is the number of rows and m is the number of columns. This way, the intensity value of each pixel becomes one feature, thus producing a \(n\times m\)-length vector of features [92]. This approach has been used extensively to extract features from data collections where it is known in advance that the shape of interest occupies the majority of the image area, such as on the MNIST [74] and OMINGLOT [72] databases of handwritten characters. Other features based on pixel information are Haar features [114], ring projection [130], shape context [10] and SIFT key points [77] applied for greyscale graphics [106], the ImageNet dataset [60] and the “Tarragona” image repository [86].
Symbol recognition reviews such as Llados et al. [76] identified that state of the art methods applied mostly structural feature extraction on symbols by using geometrical information (such as size, concavity or convexity) or topological features (such as the Euler number [50], chain code [46]), moment invariants [24, 57] or image transform [67]). Furthermore, there are other application dependant features such as triangulated polygons for deformable shapes [43], Hidden Markov Models for handwritten symbols [58].
Zhang et al. [133] identified two types of structural feature extraction: contour-based and region based. The difference lies on the portion of the image where the features are obtained; the first category works over the contour only, while the second one uses the whole region that the symbol occupies. While contour-based features are simpler and faster to compute, they result more sensitive to noise and variations. Contrarily, region-based features are able to overcome shape defection and offered more scalability. Each of these features can be obtained either by spatial domain-based or transform-domain-based techniques.
Adam et al. [2] presented a set of structural features for symbols and text strings for telephone manholes based on the analytic prolongation of the Fourier–Mellin Transformation. First, the method calculated the centroid (centre of gravity) of each pattern. Then, an invariant feature vector was calculated for each text characters. In the case of symbols, the transform decomposed them into circular and radial harmonics. Additionally, by implementing a filtering mode using the symbols and characters in the dataset, the method was capable of extracting the features and classifying shapes and characters which, given the poor image quality, did not form individual CCs in the first place.
Wenyin et al. [118] presented a structural feature extraction method based on analysing all possible pairs of line segments composing the symbol. Pairs of lines could be related either by intersection, parallelism, perpendicularity or arc/line relationship. This approach offers a shape representation which is prone to orientation or size errors. Nonetheless, its key limitation is a strong reliance on an accurate vectorisation of the symbols.
Yang et al. [124] proposed a hybrid feature extraction method based on histograms, combining the advantages of both structural and statistical descriptors. The method constructed a histogram for all pixels of the symbol to find the distribution of the neighbour pixels. Then, the information of this histogram was statistically analysed to form a feature vector based on the shape context and using a relational histogram. Authors claimed to uniquely represent all class of symbols from the TC-10 repository of the Graphics Recognition 2003 ConferenceFootnote 5, acknowledging that the calculation of these descriptors had a high computational complexity of \(O(N^{3})\).
3.3.3 Feature representation
Although statistical features (e.g. pixel intensity) are usually represented as vectors, when features convey relational information, data structures such as strings, trees or graphs are a more suitable representation form [16]. In this sense, Howie et al. [56] proposed to represent P&ID symbols by building a graph where the information of the number of areas, connectors and vertices was stored in a hierarchical tree. Similarly, Wenyin et al. [118] made use of attributed graphs to represent graphics, where vertices represent the lines that compose the symbol and edges denote the kind of interaction between vectors. Furthermore, an advantage obtained from graphs as feature representations is the capability of refining the features for a class of symbols. Such is the case presented by Jiang et al. [63], where the prototype symbol of a class was calculated from a set of distorted symbols by extracting the features of all symbols, representing them as graphs, and applying a genetic algorithm to find the median graph.
3.4 Recognition and classification
Whilst some authors use the terms “recognition” and “classification” interchangeably, surveys such as [91] or [28] have defined “recognition” as the whole process of identifying shapes and “classification” as the training step for prototype learning to perform shape categorisation. To cope with these definitions, this section is devoted to first explain what recognition strategies are, and then to discuss classification methods for symbols and text.
3.4.1 Recognition in the context of engineering drawings
There are two types of recognition strategies described for EDs: bottom-up [83, 129] and top-down [15, 34, 41, 51,52,53, 56, 75]. A bottom-up approach occurs when the path to recognise shapes goes from the specific features (i.e. graphical primitives) towards general characteristics, such as the overall structure of a mechanical drawing [112] or the topology of a diagram. For instance, bottom-up strategies such as [129] relied on first thinning the image to represent the ED as a collection of line segments. Afterwards, each line segment was assigned as a symbol, a connector line or text according to the detection method used.
Conversely, a top-down approach implies that the system is designed to first understand the structure of the ED (i.e. the general connectivity), then symbols are located as the endpoints of this connectivity, and finally each symbol is decomposed into its primal features. For instance, Fahn et al. [41] presented a method where the components of the drawing conformed an aggregation of connected graphs, and a relational best search algorithm was applied to extract all symbols. Notice that the recognition strategy used directly depends on the data available and on the reach of the method. Bottom-up approaches are better for general symbol recognition (i.e. logos, mechanical or architectural drawings) [28, 91] or when the aim of the system is to perform symbol recognition for different types of EDs [129]. In counterpart, top-down strategies are best suitable for domain specific applications or when connectivity rules are clearly defined.
3.4.2 Symbol classification
In a general sense, shape classification is the task of finding a learning function \(\textit{h(x)}\) that maps an instance \(\mathbf x _{i} \in A\) to a class \(\mathbf y _{j}\in Y\), as shown in Eq. 1.
Classification for symbols has been addressed in literature through a handful of strategies. Table 4 shows classification methods used for symbols in EDs identified through our literature review. The most common classification methods used so far are decision trees, template matching, distance measure, graph matching and machine learning methods. Decision trees are the most preferred classification method, especially in the cases where symbol features such as graphical primitives can be clearly identified and segmented; this aspect is common in EDs such as circuit diagrams. In contrast, graph matching classification approaches are preferred when the lines composing the symbols are easy to extract and an attributed relational graph can be created. Interestingly, few novel classification frameworks based on machine learning have been presented in recent years; only Gellaboina et al. [49] used NNs based on the Hopfield model to detect and classify symbols in P&IDs. This method recursively learns the features of the samples to increase the detection and classification accuracy. However, the method can only identify symbols that are formed by a “prototype pattern”, which means that irregular shapes cannot be addressed through this framework.
3.4.3 Text classification and interpretation
There are three main challenges for text classification on complex EDs: irregular string grouping, association of text to graphics and connectors and text interpretation. To address the first issue, Fan et al. [42] presented a text/graphics/image segmentation model where a rule-based approach allowed the generation of text strings with irregular size by locating text strips and connecting non-adjacent runs of pixel-by-pixel data. Then, text strips were merged in paragraphs based on well-known grammatical features of text in documents, such as the gap between two paragraphs or the indentation of the first and/or last line of a paragraph. An approach based on this fundamentals can be adapted for string size grouping in complex EDs if a specific notation standard is known in advance. For instance, Fig. 5d shows two symbols within a piece of pipework (bold horizontal line). It can be seen that both symbols are described by a 14-character code, while the pipework has a 12-character code associated. These codes contain information such as size or material.
Methods to locate and assign dimension text [71] may be used to overcome the second challenge. Most notably, Dori et al. [35] presented a method for identifying dimension text in ISO and ANSI standardised drawings through candidate text wires and a region growing process to find the minimum enclosing rectangle for each character. Based on the selected standard, text strings are conformed using the corresponding text box sizes and a histogram approach. Besides the natural drawback of only working with standardised documents, this approach was tested in a limited set of mechanical charts, where text strings were continuous and small graphics were not present.
With respect to text interpretation, there is a handful of reviews on OCR for EDs and other printed documents [35, 78, 88, 92]. With open source OCR software such as TesseractFootnote 6 and PhotoOCR [12] being increasingly prefered in academical practice [65], there are still other digitisation methods in literature where specific algorithms for text interpretation are developed. For instance, De et al. [33] applied a pair of decision-tree classifiers to cluster numbers and letters, respectively. Based on a set of constraints such as length, width, pixel count and white-to-black transitions, numbers 0–9 and a particular set of letters commonly found in logical diagrams were identified. This strategy results useful when the characters to be found in the drawing are known beforehand and have very distinct features. Nonetheless, this methodology is clearly designed for a specific type of drawings which contains text that is harder to read by any other means. Since complex EDs usually contain a larger character dictionary (sometimes even containing manual annotations), it is preferred to use conventional OCR for text interpretation.
4 Contextualisation
Contextualisation is defined in this paper as the design and implementation of a system or a methodology which converts the information digitised from one or multiple EDs into a functional tool for a commercial or an industrial purpose. In this section, we present some examples found in literature and comment on a series of contextualisation challenges raised by the Oil & Gas industrial partners.
4.1 Examples of contextualisation in literature
The first step required for contextualisation is to structure the information produced by a digitisation framework. To that aim, the notion of a netlist has been presented [7, 47, 117, 129]. A netlist is a graph where symbols are represented by nodes and connectors are represented by edges. Moreover, attributes of the graph may contain information such as adjacent text or shape descriptors. Netlists can be visualised as either a list of components or a graphical representation of the symbols and their connections. Using netlists results in a simple yet effective form of data representation and storage for EDs.
Howie et al. [56] presented a technical report on P&ID interpretation, where the aim was to deduce the connectivity of the symbols and produce a netlist given a .dfx file with the drawing as vectorised lines in a semi-automatic form. The user was requested to provide two files: a “symbol file” containing the basic templates of all symbols to be found in the main line, and a “constraints file” specifying tolerance distance values to infer when a line is connected to a symbol even if this did not touch the symbol. The output of the method was a netlist containing the number of symbols found and their connectivity.
Vaxiviere et al. [112] developed the CELESSTIN project to convert printed mechanical drawings using a fixed set of French standards into CAD representations using a vectorisation-based method. This proposal analysed the structure of the mechanical drawing according to line thickness degrees and distance proportions provided by the standard in order to regenerate the drawing using a CAD software. Similar proposals for CAD-related data representations in non-diagram EDs are RENDER by Nagasamy et al. [90] and TECNOS by Bottoni et al. [14].
During our industrial collaboration, we have noticed a strong interest of 3D modelling and simulation based on printed drawings. However, in the case of schematics found in the hydrocarbon and the oil & gas industries, documents do not directly relate to the real-life installations, but use a set of notations and standards to describe processes. Wen et al. [117] presented a frameworks to perform 2D to 3D model matching in a hydrocarbon plant, where the digitised information of printed drawings was related to a 3D model based on graph matching methods. A framework with this capabilities is essential to simulate processes in 3D graphical models.
Yamakawa et al. [119] presented a computer simulation application to learn and recompute the distribution of symbols in a drawing. This method was developed for layout drawings, which are drawings that depict the distribution of furniture in a house. Each item in the room was segmented and classified by the digitisation process, and the properties of each furniture element were obtained by comparing each element to a dataset. This way, the items were automatically assigned to the new house plan taking into account the previous layout.
4.2 New contextualisation challenges in the oil & gas industry
Complex EDs such as PFDs, SDs and P&IDs from the Oil & Gas industry are used for a variety of purposes. For instance, electrical engineers study the connection between instruments (i.e. sensors depicted as circles with text inside as shown in Figs. 1, 2) and specific symbols. On the other hand, quantitative risk assessment (QRA) specialists look at the process that the drawing depicts and analyse how likely is that an accident occurs in a certain section of a plant. There are several limitations to overcome if any of these two contextualisation tasks has to be addressed digitally. This section presents our experience when confronted with these two scenarios.
4.2.1 Sensor/equipment contextualisation for SDs
Sensor/equipment diagram contextualisation requires the knowledge of how sensors and equipment are interconnected in an SD drawing. This is not always straightforward information, since experts often disagree on what constitutes a sensor and an equipment, respectively. Figure 6 shows an example of a SD where circular shapes are connected to a central shape containing the annotations “27KA102” and “27KA101”, which are presumed to be the tags of two pieces of equipment. Notice that although circles usually represent sensors, this is not always the case, as it can be seen that some circles are connected through dashed lines to other circles and thus, these are not sensors. Other SDs use shapes such as diamonds or rectangles to depict sensors, which further complicates the task. A more challenging aspect is that there is no conventional standard that specifies how two pieces of equipment are divided. While it could be deducted in this case that either the gap or the rectangular shape is the division, this rule cannot be generalised since there are other standards for equipment symbols used even on the same collection of drawings. To address this scenario, we have suggested an interactive system where the user can select in advance how sensors are represented and also to specify the location of a piece of equipment. A demo of this tool can be provided upon request.
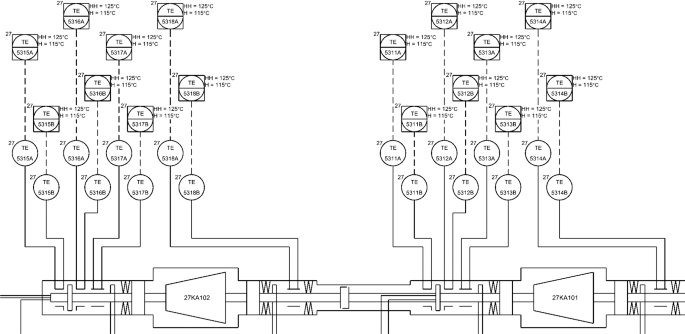
Example of a sensor diagram (SD)

Example of a P&ID with the main process (yellow), area break (green) and isolation section break (red) highlighted (colour figure online)

Example of naming events in a P&ID
4.2.2 QRA contextualisation for P&IDs
QRA contextualisation is an even more complex task given the following challenges:
-
The first task of a QRA specialist is to look at a single page of a P&ID and mark the main process, which is the portion of the drawing that represents the main pipeline of the platform. Figure 7 shows the main process marked in yellow for the example provided in Fig. 1. Notice that not all connectors and shapes are included in this marking, since some portions of the drawing depict instruments or vessels. Although thresholds or other restrictions could be used to exclude certain lines from the pipeline selection, other P&ID drawing standards don’t use thickness to differentiate pipeline from other connectors. Moreover, the drawing quality could be very degraded and this property could not be applicable.
-
Once the pipeline has been identified, the QRA specialist has to mark area breaks (green line) and isolation section breaks (red symbol) in the drawing. Area breaks denote where a wall is physically located in the plant, while isolation section breaks are pieces of equipment which can be automatically turned off to avoid an accident. Both area breaks and isolation section breaks are only known by the specialist as no information about their location is contained in the drawing. Moreover, there is no current standard that specifies where to insert these breaks, and thus a manual interaction is proposed to address this issue. Area breaks and isolation section breaks are important since they allow to identify each event according to a specific area and isolation section. An example of this identification is provided in Fig. 8.
-
Besides the large amount of symbols and pipeline segments in a full page complicating the use of a netlist representations, the main problem resides on the use of multiple pages to depict a plant. The example P&ID in Fig. 7 has three arrow-like symbols on the left side, which are continuity labels that indicate the connection of this page to other pages of the collection. Therefore, once the netlist of a drawing is obtained, it has to be combined with the netlist of a second drawing, and so on. As a result, all properties marked on one drawing have to agree with the rest of the pages in the collection. Once a full collection netlist is obtained and contextualised, the QRA specialist may require to visualise only a specific area or isolation section of the project. To achieve this, it is proposed to implement sub-graph isomorphism [111], graph mining [22] or partial-to-full graph matching [85] methodologies.
5 New trends in engineering drawing digitisation
Deep learning is an increasingly used and demanded set of machine learning tools devised for a number of purposes such as speech recognition, clustering and computer vision [23]. Most notably, Convolutional Neural Networks (CNN) are recognition systems that offer a great affinity and functionality when implemented on computer vision tasks, given their capability to deal with classification of a wide pool of images of various sizes and characteristics. As such, it is expected by the research community that complex ED digitisation can be solved through this technology.
Nonetheless, the straightforward application of CNNs for the digitisation and contextualisation of complex EDs is still a challenging task due to the following reasons. Firstly, there is a lack of sufficient annotated examples in the industrial practice. While some general purpose symbol repositories can be found in literature [102], there is no application domain datasets for diagrams such as PFDs, SDs and P&IDs where symbols on different depiction standards are used. Moreover, there are no clear guidelines nor datasets on how to perform a drawing interpretation. Secondly, contextualisation tasks such as QRA analysis described in Sect. 4.2 are still unrelated to the printed information, and thus there is a need of an agent to manually insert this information. Despite these difficulties, there are some methods where CNNs have been applied to sort some specific tasks of the ED digitisation process. For instance, Fu et al. [47] presented a CNN-based method to recognise handwritten EDs and convert them into CAD designs. This method is capable of recognising symbols from handwritten schemes with poor resolution, but requires an sufficient amount of training data for the system to perform feature learning.
CNN-based models offer a great accuracy for symbol classification despite the usual limitations of rotation, translation, degradation, overlapping, amongst others. Nevertheless, having to perform an effort to manually collect and correct large quantities of sample images for training is still a strong limitation. Therefore, methods that rely on artificial training data are suggested. Some are based on the concept of data augmentation [69, 131], which consists on using the existing data samples and applying affine transformations to increase the number of samples available for a given class. Moreover, transfer learning, which attempts to reproduce the success of a model on a similar task, has been considered to address this issue [125]. Recently, Ali-Gombe et al. [4] presented a comparative study of data augmentation and transfer learning on the context of fish classification, finding that manual annotation of data was a key requirement to increase accuracy rates for these options.
Data augmentation still requires the initial subset of data to be labelled, which may be a limitation even for small data sets. As an alternative, Dosovitskiy et al. [38] presented the concept of Exemplar-CNN, which is a framework to train CNNs by only using unlabelled data. Authors proposed training the network to first discriminate between a set of surrogate classes created through the use of a sample seed patch, and based on these surrogate classes, they performed the data augmentation, labelling and classification. Given a set of training data, the system analysed each image and extracted a patch from the portion containing objects (highest gradient). From these patches, the system was trained to generate random transformations and a class was assigned. Afterwards, a CNN was trained to classify based on these surrogate classes. Authors showed improved accuracy with a reduced set of features in contrast to state of the art CNNs; however it is clear that in order to use this method, the input images which will conform the training data need to be somehow homogeneous and therefore, there is an implicit intervention of a human expert to perform this data distribution (which could technically be considered as labelling). Nonetheless, in the case of ED symbol classification, there is a possibility of obtaining some sort of symbol catalogue or a preconceived classification based on shape and therefore; this limitation could be addressed.
6 Conclusions and future perspectives
Digitisation of complex EDs used in industrial practice, such as chemical process diagrams, complex circuit drawings, process flow diagrams, PFDs, SDs and P&IDs, circumvents the need of outdated and non-practical printed information and migrates these assets towards a drawing-less environment [98]. In this paper, we have presented a general framework for the digitisation of complex EDs and thoroughly reviewed methods and applications that addressed either a single phase or the whole digitisation framework. Once that the digitisation problem is addressed, a contextualisation phase often ignored in literature must take place in order to design error-prone industrial applications such as security assessment, data analytics, 2D to 3D manipulation, digital enhancement and optimisation, amongst many others still to identify. This range of possibilities makes digitisation of complex EDs more attractive for both parties, especially if novel and more accurate methodologies such as CNNs are considered for the task.
In the light of deep learning through CNNs being adopted as the most popular solution to solve computer vision and pattern recognition problems in recent years, a careful study of the pretended aims and available resources must be performed if a solution based on these technologies is contemplated to perform either the digitisation task or a contextualisation application. Firstly, CNNs require large amount of labelled samples, which are not available even in industrial practice, where despite the large amounts of data, most of the times is raw and thus useless for machine learning purposes. Secondly, there are numerous types of image quality ranges, standards and rule sets for complex EDs which makes the design of a general purpose ED digitisation a very complex task. As a result, we consider more pertinent to explore hybrid approaches where first heuristics-based and document image recognition processes are used to understand and segment the drawing, so that afterwards deep learning methods can aid on classification or text interpretation.
References
Ablameyko SV, Uchida S (2007) Recognition of engineering drawing entities: review of approaches. Int J Image Graph 07(04):709–733
Adam S, Ogier JM, Cariou C, Mullot R, Labiche J, Gardes J (2000) Symbol and character recognition: application to engineering drawings. Int J Doc Anal Recognit 3:89–101
Agam G, Huizhu L, Dinstein I (1996) Morphological approach for dashed lines detection. In: Graphics recognition methods and applications (GREC), pp 92–105
Ali-Gombe A, Elyan E, Jayne C (2017) Fish classification in context of noisy images. Eng Appl Neural Netw vol CCIS 744:216–226
Arias JF, Kasturi R, Chhabra A (1995) Efficient techniques for telephone company line drawing interpretation. In: Proceedings of the third IAPR conference on document analysis and recognition—CDAR’95, pp 795–798
Arias JF, Lai CP, Chandran S, Kasturi R, Chhabra A (1995) Interpretation of telephone system manhole drawings. Pattern Recognit Lett 16(4):365–368
Bailey D, Norman A, Moretti G, North P (1995) Electronic schematic recognition. Massey University, Wellington, New Zealand
Ballard DH (1981) Generalizing the Hough transform to detect arbitrary shapes. Pattern Recognit 13(2):111–122
Bay H, Tuytelaars T, Van Gool L (2008) Speeded-up robust features (SURF). Comput Vis Image Underst 110:346–359
Belongie S, Malik J, Puzicha J (2002) Shape matching and object recognition using shape contexts. IEEE Trans Pattern Anal Mach Intell 24(4):509–522
Binford T, Chen T, Kunz J, Law KH (1997) Computer interpretation of process and instrumentation diagrams (Technical Report). CIFE Technical Report
Bissacco A, Cummins M, Netzer Y, Neven H (2013) PhotoOCR: reading text in uncontrolled conditions. In: Proceedings of the international conference on computer vision (ICCV), pp 785–792
Blostein D (1995) General diagram-recognition methodologies. In: Proceedings of the 1st international conference on graphics recognition (GREC’95), pp 200–212
Bottoni P, Cugini U, Mussio P, Papetti C, Protti M (1995) A system for form-feature-based interpretation of technical drawings. Mach Vis Appl 8(5):326–335
Bunke H (1982) Automatic interpretation of lines and text in circuit diagrams. Pattern Recognit Theory Appl 81:297–310
Bunke H, Günter S, Jiang X (2001) Towards bridging the gap between statistical and structural pattern recognition: two new concepts in graph matching. In: ICAPR, pp 1–11
Canny J (1986) A computational approach to edge detection. IEEE Trans Pattern Anal Mach Intell PAMI–8(6):679–698
Cao R, Tan CL (2002) Text/graphics separation in maps. In: Selected papers from the fourth international workshop on graphics recognition algorithms and applications, GREC ’01. Springer, London, pp 167–177
Cardoso JS, Capela A, Rebelo A, Guedes C (2008) A connected path approach for staff detection on a music score. In: ICIP, pp 1005–1008
Cardoso JS, Capela A, Rebelo A, Guedes C (2009) Staff detection with stable paths. IEEE Trans Pattern Anal Mach Intell 31(6):1134–1139
Cesarini F, Gori M, Marinai S, Soda G (1996) A hybrid system for locating and recognizing low level graphic items. Graph Recognit Methods Appl 1072:135–147
Chakrabarti D, Faloutsos C (2006) Graph mining: laws, generators and tools. ACM Comput Surv 38(March):1–69
Chen XW, Lin X (2014) Big data deep learning: challenges and perspectives. IEEE Access 2:514–525
Cheng T, Khan J, Liu H, Yun D (1993) A symbol recognition system. In: Proceedings of the second international conference on document analysis and recognition—ICDAR’93, pp 918–921
Chhabra AK (1997) Graphics recognition algorithms and systems. In: Proceedings of the 2nd international conference on graphics recognition (GREC’97 ), pp 244–252
Chowdhury SP, Mandal S, Das AK, Chanda Bhabatosh (2007) Segmentation of text and graphics from document images. In: Proceedings of the international conference on document analysis and recognition, ICDAR 2(Section 4), pp 619–623
Conte D, Foggia P, Sansone C, Vento M (2004) Thirty years of graph matching. Int J Pattern Recognit Artif Intell 18(3):265–298
Cordella LP, Vento M (2000) Symbol recognition in documents: A collection of techniques? Int J Doc Anal Recogn 3(2):73–88
Cote M, Branzan Albu A (2014) Texture sparseness for pixel classification of business document images. Int J Doc Anal Recognit 17(3):257–273
Das AK, Chanda B (2001) A fast algorithm for skew detection of document images using morphology. Int J Doc Anal Recognit 4(2):109–114
Datta R, De P, Mandal S, Chanda B (2015) Detection and identification of logic gates from document images using mathematical morphology. In: Fifth national conference on computer vision, pattern recognition, image processing and graphics (NCVPRIPG), pp 1–4
De P, Mandal S, Bhowmick P (2011) Recognition of electrical symbols in document images using morphology and geometric analysis. In: ICIIP 2011—Proceedings: 2011 international conference on image information processing (ICIIP)
De P, Mandal S, Bhowmick P (2014) Identification of annotations for circuit symbols in electrical diagrams of document images. In: 2014 fifth international conference on signal and image processing, pp 297–302
Della Ventura A, Schettini R (1994) Graphic symbol recognition using a signature technique. In: Proceedings of the 12th IAPR international conference on pattern recognition (Cat. No.94CH3440-5), vol 2, pp 533–535
Dori D, Velkovitch Y (1998) Segmentation and recognition of dimensioning text from engineering drawings. Comput Vis Image Underst 69(2):196–201
Dori D, Wenyin L (1996) Vector-based segmentation of text connected to graphics in engineering drawings. In: Advances in structural and syntactical pattern recognition, vol 1121, pp 322–331
Dori D, Wenyin L, Peleg M (1996) How to win a dashed line detection contest. Graph Recognit Methods Appl (GREC) 1072:286–300
Dosovitskiy A, Springenberg JT, Riedmiller M, Brox T (2014) Discriminative unsupervised feature learning with convolutional neural networks. In: Advances in neural information processing systems, vol 27 (Proceedings of NIPS), pp 1–13
Duda RO, Hart PE (1971) Use of the Hough transformation to detect lines and curves in pictures. Commun ACM 15(April 1971):11–15
Ester M, Kriegel H, Sander J, Xu X (1996) Density-based spatial clustering of applications with noise. In: International conference on knowledge discovery and data mining, vol 240
Fahn CS, Wang JF, Lee JY (1988) A topology-based component extractor for understanding electronic circuit diagrams. Comput Vis Graph Image Process 44:119–138
Fan KC, Liu CH, Wang YK (1994) Segmentation and classification of mixed text/graphics/ image documents. Pattern Recognit Lett 15(12):1201–1209
Felzenszwalb PF (2005) Representation and detection of deformable shapes. IEEE Trans Pattern Anal Mach Intell 27(2):208–220
Fletcher LA, Kasturi R (1988) Robust algorithm for text string separation from mixed text/graphics images. IEEE Trans Pattern Anal Mach Intell 10(6):910–918
Foggia P, Percannella G, Vento M (2014) Graph matching and learning in pattern recognition on the last ten years. Int J Pattern Recognit Artif Intell 28(01):1450001
Freeman H (1960) On the encoding of arbitrary geometric configurations. IRE Trans Electron Comput EC-10(2):260–268
Fu L, Kara LB (2011) From engineering diagrams to engineering models: visual recognition and applications. Comput Aid Des 43(3):278–292
Furuta M, Kase N, Emori S (1984) Segmentation and recognition of symbols for handwritten piping and instrument diagram. In: Proceedings of the 7th IAPR international conference on pattern recognition (ICPR), pp 626–629
Gellaboina MK, Venkoparao VG (2009) Graphic symbol recognition using auto associative neural network model. In: Proceedings of the 7th international conference on advances in pattern recognition, ICAPR 2009, pp 297–301
Gray SB (1971) Local properties of binary images in two dimensions. IEEE Trans Comput C–20(5):551–561
Groen FCA, Sanderson AC, Schlag JF (1985) Symbol recognition in electrical diagrams using probabilistic graph matching. Pattern Recognit Lett 3(5):343–350
Groen FCA, Van Munster RD (1984) Topology based analysis of schematic diagrams. In: Proceedings of the 7th international conference on pattern recognition, pp 1310–1312
Hamada AH (1993) A new system for the analysis of schematic diagrams. In: 2nd international conference on document analysis and recognition (ICDAR), pp 369–371
He S, Abe N (1996) A clustering-based approach to the separation of text strings from mixed text/graphics documents. Proc Int Conf Pattern Recognit 3:706–710
Hough PVC (1962) Method and means for recognizing complex patterns, December 18 1962. US Patent 3,069,654
Howie C, Kunz J, Binford T, Chen T, Law KH (1998) Computer interpretation of process and instrumentation drawings. Adv Eng Softw 29(7–9):563–570
Hu MK (1962) Visual pattern recognition by moment invariants. IRE Trans Inf Theory 8:179–187
Huang BQ, Du CJ, Zhang YB, Kechadi MT (2006) A hybrid HMM-SVM method for online handwriting symbol recognition. In: Sixth international conference on intelligent systems design and applications (ISDA), vol 1, pp 887–891
Ishii M, Ito Y, Yamamoto M, Harada H, Iwasaki M (1989) An automatic recognition system for piping and instrument diagrams. Syst Comput Jpn 20(3):32–46
Deng J, Dong W, Socher R, Li L-J, Li K, Fei-Fei L (2009) ImageNet: a large-scale hierarchical image database. In: 2009 IEEE conference on computer vision and pattern recognition, pp 248–255
Jain AK, Flynn P, Ross AA (2008) Handbook of biometrics. Springer, Berlin, Heidelberg
Jalali S, Wohlin C (2012) Systematic literature studies: database searches vs. backward snowballing. In: Proceedings of the ACM-IEEE international symposium on empirical software engineering and measurement (ESEM), pp 29–38
Jiang X, Munger A, Bunke H (2000) Synthesis of representative graphical symbols by computing generalized median graph. Graph Recognit (GREC) 1941:183–192
Kanungo T, Haralick RM, Dori D (1995) Understanding engineering drawings: a survey. In: Proceedings of the 1st international conference on graphics recognition (GREC’95), pp 119–130
Kasar T, Barlas P, Adam S, Chatelain C, Paquet T (2013) Learning to detect tables in scanned document images using line information. In: Proceedings of the international conference on document analysis and recognition, ICDAR, pp 1185–1189
Kasturi R, Bow ST, El-Masri W, Shah J, Gattiker JR (1990) A system for interpretation of line drawings. IEEE Trans Pattern Anal Mach Intell 12(10):978–992
Kim SH, Suh JW, Kim JH (1993) Recognition of logic diagrams by identifying loops and rectilinear polylines. In: ProceedIngs of the second international conference on document analysis and recognition—ICDAR’93, pp 349–352
Kong B, Phillips IT, Haralick RM, Prasad A, Kasturi R (1996) A benchmark: performance evaluation of dashed-line detection algorithms. Graph Recognit Methods Appl (GREC) 1072:270–285
Krizhevsky A, Sutskever I, Hinton GE (2012) ImageNet classification with deep convolutional neural networks. In: Proceedings of the 25th international conference on neural information processing systems (NIPS), vol 1, pp 1097–1105
Kulkarni CR, Barbadekar AB (2017) Text detection and recognition: a review. Int Res J Eng Technol (IRJET) 4(6):179–185
Lai CP, Kasturi R (1994) Detection of dimension sets in engineering drawings. IEEE Trans Pattern Anal Mach Intell 16(8):848–855
Lake BM, Salakhutdinov RR, Gross J, Tenenbaum JB (2011) One shot learning of simple visual concepts. In: Proceedings of the 33rd Annual Conference of the Cognitive Science Society (CogSci 2011), vol 172, pp 2568–2573
LeCun Y, Boser B, Denker JS, Henderson D, Howard RE, Hubbard W, Jackel LD (1989) Backpropagation applied to handwritten zip code recognition 1(4):541–551
LeCun Y, Bottou L, Bengio Y, Haffner P (1998) Gradient-based learning applied to document recognition. Proc IEEE 86(11):2278–2323
Lee SW (1992) Recognizing hand-drawn electrical circuit symbols with attributed graph matching. Springer, Berlin, pp 340–358
Lladós J, Valveny E, Sánchez G, Martí E (2001) Symbol recognition: current advances and perspectives. In: International workshop on graphics recognition. Springer, Berlin, pp 104–128
Lowe DG (2004) Distinctive image features from scale invariant keypoints. Int J Comput Vis 60:91–11020042
Lu Y (1995) Machine printed character segmentation—An overview. Pattern Recognit 28(1):67–80
Lu Z (1998) Detection of text regions from digital engineering drawings. IEEE Trans Pattern Anal Mach Intell 20(4):431–439
Luo H, Agam G, Dinstein I (Aug 1995) Directional mathematical morphology approach for line thinning and extraction of character strings from maps and line drawings. In: Proceedings of 3rd international conference on document analysis and recognition, vol 1, pp 257–260
Matas J, Galambos C, Kittler J (2000) Robust detection of lines using the progressive probabilistic Hough transform. Comput Vis Image Underst 78(1):119–137
Meeran S, Taib JM, Afzal MT (2003) Recognizing features from engineering drawings without using hidden lines: a framework to link feature recognition and inspection systems. Int J Prod Res 41(3):465–495
Messmer BT, Bunke H (1996) Automatic learning and recognition of graphical symbols in engineering drawings. Springer, Berlin, pp 123–134
Mikolajczyk K, Schmid C (2005) A performance evaluation of local descriptors. IEEE Trans Pattern Anal Mach Intell 27(10):1615–1630
Moreno-García CF, Cortés X, Serratosa F (2014) Partial to full image registration based on candidate positions and multiple correspondences. CIARP, pp 745–753
Moreno-García CF, Cortés X, Serratosa F (2016) A graph repository for learning error-tolerant graph matching. Struct Syntactic Stat Pattern Recogni 10029:519–529
Moreno-García CF, Elyan E, Jayne C (2017) Heuristics-based detection to improve text/graphics segmentation in complex engineering drawings. Eng Appl Neural Netw vol CCIS 744:87–98
Mori S, Suen CY, Yamamoto K (1992) Historical review of OCR research and development. Proc IEEE 80(7):1029–1058
Mukherjee A, Kanrar S (2010) Enhancement of image resolution by binarization. Int J Comput Appl 10(10):15–19
Nagasamy V, Langrana NA (1990) Engineering drawing processing and vectorization system. Comput Vis Graph Image Process 49(3):379–397
Nagy G (2000) Twenty years of document image analysis in PAMI. IEEE Trans Pattern Anal Mach Intell 22(1):38–62
Nagy G, Veeramachaneni S (2008) Adaptive and interactive approaches to document analysis. Stud Comput Intell 90:221–257
Okazaki A, Kondo T, Mori K, Tsunekawa S, Kawamoto E (1988) Automatic circuit diagram reader with loop-structure-based symbol recognition. IEEE Trans Pattern Anal Mach Intell 10(3):331–341
Otsu N (1979) A threshold selection method from gray-level histograms. IEEE Trans Syst Man Cybern 9(1):62–66
Parida L, Geiger D, Hummel R (1998) Junctions: detection, classification, and reconstruction. IEEE Trans Pattern Anal Mach Intell 20(7):687–698
Pham TA, Delalandre M, Barrat S, Ramel JY (2014) Accurate junction detection and characterization in line-drawing images. Pattern Recognit 47(1):282–295
Pratt WK (2013) Digital image processing: PIKS scientific inside, 4th edn. Wiley, Hoboken, NJ, USA
Quintana V, Rivest L, Pellerin R, Kheddouci F (2012) Re-engineering the engineering change management process for a drawing-less environment. Comput Ind 63:79–90
Qureshi RJ, Ramel JY, Barret D, Cardot H (2008) Spotting symbols in line drawing images using graph representations. Lect Notes Comput Sci (including subseries Lecture Notes in Artificial Intelligence and Lecture Notes in Bioinformatics) 5046 LNCS(Ea 2101):91–103
Rebelo A, Capela A, Cardoso JS (2010) Optical recognition of music symbols. Int J Doc Anal Recognit 13(1):19–31
Rezaei SB, Shanbehzadeh J, Sarrafzadeh a adaptive document image skew estimation. In: Proceedings of the international multi conference of engineers and computer scientists, vol I (2017)
Riesen K, Bunke H (2008) IAM graph database repository for graph based pattern recognition and machine learning. In: da Vitoria Lobo N et al (eds) Structural, syntactic, and statistical pattern recognition. SSPR/SPR 2008. Lecture Notes in Computer Science, vol 5342. Springer, Berlin, Heidelberg, pp 287–297
Rosten E, Porter R, Drummond T (2010) Faster and better: a machine learning approach to corner detection. IEEE Trans Pattern Anal Mach Intell 32(1):105–119
Roy PP, Vazquez E, Lladós J, Baldrich R, Pal U (2008) A system to segment text and symbols from color maps. Lect Notes Comput Sci (including subseries Lecture Notes in Artificial Intelligence and Lecture Notes in Bioinformatics), 5046 LNCS:245–256
Sauvola J, Pietikäinen M (2000) Adaptive document image binarization. Pattern Recognit 33(2):225–236
Setitra I, Larabi S (2015) SIFT descriptor for binary shape discrimination. Classif Match CAIP 9256:489–500
Shi J, Tomasi C (1994) Good features to track. In: Proceedings of the IEEE international conference on computer vision, pp 246–253
Tan C, Ng PO (1998) Text extraction using pyramid. Pattern Recognit 31(1):63–72
Tombre K (1997) Analysis of engineering drawings: state of the art and challenges. In: Proceedings of the 2nd international conference on graphics recognition (GREC’97 ), pp 54–61
Tombre K, Tabbone S, Lamiroy B, Dosch P (2002) Text/Graphics separation revisited. DAS 2423:200–211
Ullmann JR (1976) An algorithm for subgraph isomorphism. J ACM 23(1):31–42
Vaxiviere P, Tombre K (1992) Celesstin: CAD conversion of mechanical drawings. IEEE Comput Mag 25(7):46–54
Vento M (2015) A long trip in the charming world of graphs for pattern recognition. Pattern Recognit 48(2):291–301
Viola P, Jones M (2001) Rapid object detection using a boosted cascade of simple features. Comput Vis Pattern Recognit (CVPR) 1:I-511–I-518
Wahl FM, Wong KY, Casey RG (1982) Block segmentation and text extraction in mixed text/image documents. Comput Graph Image Process 20(4):375–390
Wei Y, Zhang Z, Shen W, Zeng D, Fang M, Zhou S (2017) Text detection in scene images based on exhaustive segmentation. Sig Process Image Commun 50(June 2016):1–8
Wen R, Tang W, Su Z (2016) A 2D engineering drawing and 3D model matching algorithm for process plant. In: Proceedings—2015 international conference on virtual reality and visualization, ICVRV 2015, pp 154–159
Wenyin L, Zhang W, Yan L (2007) An interactive example-driven approach to graphics recognition in engineering drawings. Int J Doc Anal Recognit 9(1):13–29
Yamakawa T, Dobashi Y, Okabe M, Iwasaki K, Yamamoto T (2017) Computer simulation of furniture layout when moving from one house to another. In: Spring conference on computer graphics 2017, pp 1–8
Yan L, Wenyin L (2003) Engineering drawings recognition using a case-based approach. Int Conf Doc Anal Recognit 1:190–194
Yang D, Garrett JH, Shaw DS, Larry Rendell A (1994) An intelligent symbol usage assistant for CAD systems. IEEE Expert 9(3):33–40
Yang D, Rendell LA, Webster JL, Shaw DS (1994) Symbol recognition in a CAD environment using a neural network approach. Int J Artif Intell Tools (Archit Lang Algorithms) 3(2):157–185
Yang D, Webster Julie L, Rendell LA, Garrett JH, Shaw DS (1993) Management of graphical symbols in a CAD environment : a neural network approach. In: Proceedings of the 1993 international conference on tools with AI, pp 272–279
Yang S (2005) Symbol recognition via statistical integration of pixel-level constraint histograms: a new descriptor. IEEE Trans Pattern Anal Mach Intell 27(2):278–281
Yosinski J, Clune J, Bengio Y, Lipson H (2014) How transferable are features in deep neural networks? In: Proceedings of the 27th international conference on neural information processing systems (NIPS), vol 2, pp 3320–3328
Yu B (1995) Automatic understanding of symbol-connected drawings. In: Proceedings of the 3rd IAPR international conference on document analysis and recognition (ICDAR), pp 803–806
Yu B, Lin X, Wu Y (1989) A BAG-based vectorizer for automatic circuit diagram reader. In: Proceedings of the international conference on computer aided design and computer graphics (ICCADCG), pp 498–502
Yu Y, Samal A, Seth S (1994) Isolating symbols from connection lines in a class of engineering drawings. Pattern Recognit 27(3):391–404
Yu Y, Samal A, Seth S (1997) A system for recognizing a large class of engineering drawings. IEEE Trans Pattern Anal Mach Intell 19(8):868–890
Yuen PC, Feng GC, Tang YY (1998) Printed chinese character similarity measurement using ring projection and distance transform. Int J Pattern Recognit Artif Intell 12(02):209–221
Zeiler MD, Fergus R (2014) Visualizing and understanding convolutional networks. ECCV 8689:818–833
Zesheng S, Ying Y, Chunhong J, Yonggui W (1994) Symbol recognition in electronic diagrams using decision tree. In: Proceedings of 1994 EEE international conference on industrial technology—ICIT’94, number 230026, pp 719–723
Zhang D, Lu G (2004) Review of shape representation and description techniques. Pattern Recognit 37(1):1–19
Zitová B, Flusser J (2003) Image registration methods: a survey. Image Vis Comput 21(11):977–1000
Acknowledgements
We would like to thank Dr. Brian Bain from DNV-GL Aberdeen for his feedback and collaboration in the project. This work is supported by a Scottish national project granted by the Data Lab Innovation Centre.
Author information
Authors and Affiliations
Corresponding author
Rights and permissions
Open Access This article is distributed under the terms of the Creative Commons Attribution 4.0 International License (http://creativecommons.org/licenses/by/4.0/), which permits unrestricted use, distribution, and reproduction in any medium, provided you give appropriate credit to the original author(s) and the source, provide a link to the Creative Commons license, and indicate if changes were made.
About this article

Cite this article
Moreno-García, C.F., Elyan, E. & Jayne, C. New trends on digitisation of complex engineering drawings. Neural Comput & Applic 31, 1695–1712 (2019). https://doi.org/10.1007/s00521-018-3583-1
Received:
Accepted:
Published:
Issue Date:
DOI: https://doi.org/10.1007/s00521-018-3583-1