
Abstract
This paper presents a review of deep learning on engineering drawings and diagrams. These are typically complex diagrams, that contain a large number of different shapes, such as text annotations, symbols, and connectivity information (largely lines). Digitising these diagrams essentially means the automatic recognition of all these shapes. Initial digitisation methods were based on traditional approaches, which proved to be challenging as these methods rely heavily on hand-crafted features and heuristics. In the past five years, however, there has been a significant increase in the number of deep learning-based methods proposed for engineering diagram digitalisation. We present a comprehensive and critical evaluation of existing literature that has used deep learning-based methods to automatically process and analyse engineering drawings. Key aspects of the digitisation process such as symbol recognition, text extraction, and connectivity information detection, are presented and thoroughly discussed. The review is presented in the context of a wide range of applications across different industry sectors, such as Oil and Gas, Architectural, Mechanical sectors, amongst others. The paper also outlines several key challenges, namely the lack of datasets, data annotation, evaluation and class imbalance. Finally, the latest development in digitalising engineering drawings are summarised, conclusions are drawn, and future interesting research directions to accelerate research and development in this area are outlined.
1 Introduction
Engineering diagrams are considered one of the most complex to digitise. This is due to multiple reasons such as the combination of vast variety of symbols and text, dense representation of equipment and non standard formatting. Furthermore, there can be scientific annotations and the drawings can be edited over time to contain annotations from multiple disciplines. These diagrams are prevalent across multiple industries, including electrical (De et al. 2011), oil and gas (Elyan et al. 2020a), and architecture (Kim et al. 2021a). Manual analysis of these diagrams is time-consuming, prone to human error (Paliwal et al. 2021a, b) and requires subject matter experts (Paliwal et al. 2021a). There has recently been an increasing demand to digitise these diagrams for use in processes including asset performance management (Mani et al. 2020), safety studies (Gao et al. 2020), and data analytics (Moreno-García et al. 2018). Due to its importance, the problem of complex diagram digitisation is receiving interest from academia and industry (Moreno-Garcia and Elyan 2019; Hantach et al. 2021). For instance, engineering was the field with the most recent digitalisation-related publications in the Scopus database (Espina-Romero and Guerrero-Alcedo 2022). Engineering diagrams are complex and used for different purposes, as seen in Fig. 1. Fig. 1a represents part of a Piping and Instrumentation Diagram (P&ID). These are commonly used in offshore oil and gas installations, while Fig. 1b presents part of a HVAC diagram, commonly utilised in construction projects.
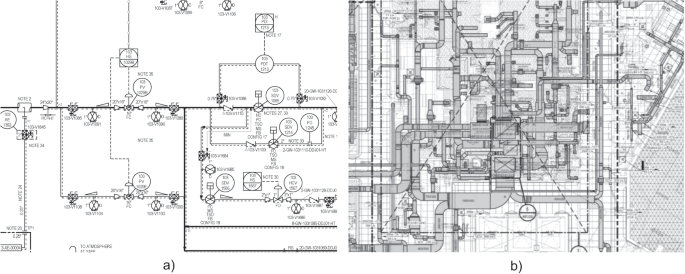
a Small section of a P&ID. b Small section of a HVAC diagram
Various methods have been developed over the past four decades to automate the processing, analysing and interpretation of these diagrams (Kang et al. 2019; Groen et al. 1985; Okazaki et al. 1988; Nurminen et al. 2020; Ablameyko and Uchida 2007). A relatively recent review by Moreno-García et al. (2018) showed that most relevant literature followed a traditional machine learning approach to automate these drawings. Traditional approaches are based on hand-crafting a set of features which are then input to a specific supervised machine learning algorithm (LeCun et al. 1998). Extensive feature engineering and expert knowledge were often required to design suitable feature extractors (LeCun et al. 1998). Image features were typically based on colour, edge and texture. Examples of commonly used image features include Histogram of Oriented Gradient (HOG) (Dalal and Triggs 2005), Scale Invariant Feature Transform (SIFT) (Lowe 2004), Speeded Up Robust Features (SURF) (Bay et al. 2006) and Local Binary Pattern (LBP) (Ojala et al. 2002). The feature vectors were classified using algorithms, such as a Support Vector Machine (SVM). Whilst traditional methods were shown to work well in specific use cases, they were not suited to the extensive range of characteristics present in engineering diagrams (Moreno-García et al. 2019). For example, traditional symbol classification methods may be limited by variations in symbol appearance, including rotation, translation and degradation (Moreno-García et al. 2019). Morphological changes and noise also compromised traditional methods’ accuracy (Yu et al. 2019). The reliance of traditional methods on pre-established rules resulted in weak generalisation ability across variations (Zhao et al. 2020).

Comparison of traditional and deep learning approaches for engineering diagram digitisation. a Traditional Approach and b deep learning approach
In recent years, deep learning has significantly advanced the domain of computer vision (LeCun et al. 2015). Deep learning is a subfield of machine learning, which is itself a subfield of artificial intelligence. Figure 2 illustrates the key differences between traditional and deep learning methods. In contrast to traditional machine learning-based methods, deep learning-based methods learn features automatically. Deep learning models contain multiple computation layers which can be trained to extract relevant features from data. Convolutional Neural Networks (CNN) have improved computer vision methods, including image classification, segmentation and object detection (LeCun et al. 2015). In 1998, LeCun et al. (1998) introduced the influential LeNet model. The authors presented a CNN-based method for handwritten character recognition. They showed that a CNN could automatically learn features from pixel data and outperform traditional approaches. However, a significant improvement in methods was seen mainly since 2012 when Krizhevsky et al. (2012) presented the AlexNet model. AlexNet was used to classify images in the 2012 ImageNet Large Scale Visual Recognition Challenge (ILSVRC) (Russakovsky et al. 2015). The authors obtained the winning score by a large margin. The top 5 error rate was 15.3%, compared to 26.2% for the second-place method. Since then, there has been a considerable rise in deep learning. This was facilitated by algorithm developments, improvements in computing hardware, and a significant increase in available data.
Despite the recent and unprecedented progress, digitising engineering drawings continues to be a challenging problem (Moreno-García et al. 2018). First of all, these diagrams are very complex, containing a large number of similar (Paliwal et al. 2021a; Rahul et al. 2019) and overlapping (Rahul et al. 2019) shapes. For example, Elyan et al. (2020a) reported on average 180 symbols of different types in a real-world P&ID dataset. The presence of text is another challenging problem. There is no consistent pattern for engineering equipment layout, meaning the text can be present anywhere in the diagram. It is also commonly present in multiple fonts (Rahul et al. 2019), scales and orientations (Gao et al. 2020). Contextualisation of the extracted data is a further challenge. This involves determining the relationships between extracted data, for example, associating a tag with the relevant symbol. Moreno-Garcia and Elyan (2019) identified three additional challenges as document quality, imbalanced data and topology. Although a large proportion of the related literature analysed high-quality drawings, in practice, the drawings can be low-quality (Moreno-Garcia and Elyan 2019). Another factor restricting the development of deep learning models in this area is the lack of publicly available datasets (Hantach et al. 2021; Moreno-García et al. 2019). Furthermore, annotation of these datasets is required for use with supervised learning algorithms, which is typically a time-consuming and often impractical manual process.
In this paper, we present a comprehensive critical investigation of existing literature that utilises state-of-the-art deep learning methods for digitising complex engineering drawings. In a related area, Pizarro et al. (2022) provided a review on the automatic analysis and recognition of floor plans. They focussed on both rule-based and learning-based approaches. However, there is a gap in the literature, as there is no published review which covers the surge in the deep learning research in engineering diagram digitisation published in the last five years.
The reviewed literature was selected according to several criteria. First, the paper should present a deep learning method for the digitisation of engineering drawings. This covers a wide variety of drawing types, such as P&IDs and architectural diagrams. This review also covers the literature that focussed on the digitisation of specific elements, such as presenting a detection method for symbols, aswell as that which presented multiple methods to digitise more than one diagram component. Papers which presented a mixture of deep learning and traditional methods were included. Second, we reviewed peer-reviewed articles from academic databases including IEEE Xplore, ACM Digital Library and Science Direct. Third, we focus on the recent literature that was published in the last five years. This shows there is an urgent need for more accurate and stable methods to handle such complex documents and engineering diagrams. Furthermore, from analysing these papers, remaining challenges were elicited, which were datasets, data annotation, evaluation and class imbalance.
The main contributions of this paper are outlined as follows:
-
A critical and comprehensive investigation of deep learning-based methods for digitising engineering diagrams.
-
A thorough discussion of the open research challenges associated with deep learning solutions for complex diagrams.
-
Recommendations for future research directions are provided to overcome the remaining challenges and improve the field of complex engineering diagram digitisation.
The rest of this paper is structured as follows:
Section 2 presents the reviewed literature in terms of application domains across various sectors. It also covers a thorough critical investigation of deep learning-based methods for digitising engineering drawings. This includes an in-depth technical discussion of state-of-the-art methods for handling symbols, text, and connectivity information in these diagrams. In Sect. 3, the challenges associated with deep learning methods for complex diagram digitisation are discussed. Finally, Sect. 4 provides the conclusion and suggestions for future work.
2 Related work
Deep learning has been used for diagram digitisation across various domains. The diagrams are composed of three elements. These are symbols, text and connectors. Connectors link symbols together and represent various line types, including continuous or dashed lines. Specialised computer vision methods are required to digitise each element type. This section introduces and discusses the application domains, together with the state-of-the-art deep learning methods used in the recent and relevant literature on complex engineering diagram digitisation.
2.1 Application domains
The reviewed literature is listed by application and extracted data type in Table 1. Amongst these applications, there has been a considerable research focus on P&IDs (Rahul et al. 2019; Sinha et al. 2019; Yu et al. 2019; Mani et al. 2020; Gao et al. 2020; Elyan et al. 2020a; Moreno-García et al. 2020; Jamieson et al. 2020; Nurminen et al. 2020; Paliwal et al. 2021a; Moon et al. 2021; Kim et al. 2021b; Stinner et al. 2021; Paliwal et al. 2021b; Toral et al. 2021; Bhanbhro et al. 2022; Hantach et al. 2021). Another research area is architecture diagram digitisation (Ziran and Marinai 2018; Zhao et al. 2020; Rezvanifar et al. 2020; Kim et al. 2021a; Renton et al. 2021; Jakubik et al. 2022). Deep learning methods were also applied to technical drawings (Nguyen et al. 2021), construction drawings (Faltin et al. 2022) engineering documents (Francois et al. 2022) and engineering drawings (Sarkar et al. 2022; Scheibel et al. 2021; Haar et al. 2023).
Most of the P&ID digitisation literature focussed on the extraction of specific data types (Sinha et al. 2019; Gao et al. 2020; Elyan et al. 2020a; Jamieson et al. 2020; Nurminen et al. 2020; Moon et al. 2021; Kim et al. 2021b; Stinner et al. 2021; Paliwal et al. 2021b; Toral et al. 2021). There is a particular focus on P&ID symbols (Elyan et al. 2020a; Nurminen et al. 2020; Paliwal et al. 2021b). For example, Elyan et al. (2020a) presented a You Only Look Once (YOLO) v3 (Redmon and Farhadi 2018) based detection method for symbols in real-world P&IDs. A Generative Adversarial Network (GAN) based (Ali-Gombe and Elyan 2019) approach was used to synthesise more data to improve classification. Meanwhile, Paliwal et al. (2021b) used a graph-based approach for symbol recognition. Other studies focussed on the text (Jamieson et al. 2020; Francois et al. 2022) or connectors (Moon et al. 2021). Studies that presented methods for multiple element types were also seen (Gao et al. 2020; Stinner et al. 2021). For instance, Gao et al. (2020) created a Region-based Fully Convolutional Network (R-FCN) (Dai et al. 2016) component detection method and a SegLink (Shi et al. 2017a) based text detection method. Meanwhile, Stinner et al. (2021) presented work on extracting symbols, lines and line crossings, however they did not consider the text.
There are only a few recent P&ID digitisation studies that presented methods for symbols, text and connectors (Paliwal et al. 2021a; Rahul et al. 2019; Yu et al. 2019; Mani et al. 2020; Hantach et al. 2021). These were often focused on specific elements of interest. For example, Mani et al. (2020) created symbols, text and connection detection methods. They considered two symbol classes and recognised the text associated with these symbols. Hantach et al. (2021) also proposed symbol, text and lines methods. The authors only had access to a limited dataset of eight P&IDs and considered one symbol class. Meanwhile, Yu et al. (2019) created methods for tables aswell as symbols, lines and text. Deep learning was used for symbols and text, while the lines and table detection methods were based on traditional image processing.
Extracted elements have been associated to each other using distance-based or graph-based methods (Mani et al. 2020; Paliwal et al. 2021a; Rahul et al. 2019; Bickel et al. 2023; Theisen et al. 2023). For instance, Mani et al. (2020) determined symbol-to-symbol connections by representing the P&ID in graph format and implementing a depth-first search. Paliwal et al. (2021a) used a graph-based method to associate lines with relevant symbols and text. Meanwhile, Rahul et al. (2019) used the euclidean distance to associate detected symbols, tags and pipeline codes with the closest pipeline. Theisen et al. (2023) presented methods for the digitisation of process flow diagrams. They used a Faster Regions with CNN features (Faster R-CNN) (Girshick et al. 2014) model to detect the unit operations, and a pixel search based algorithm to detect the connections between them. Then, the data was converted to a graph.
Deep learning has also been recently applied for the digitisation of architecture diagrams (Ziran and Marinai 2018; Zhao et al. 2020; Rezvanifar et al. 2020; Kim et al. 2021a; Renton et al. 2021; Jakubik et al. 2022). These present similar challenges to engineering diagrams, such as various semantically equivalent symbol representations (Rezvanifar et al. 2020), relatively small objects (Kim et al. 2021a) and the presence of occlusion and clutter (Rezvanifar et al. 2020). One example is the work by Zhao et al. (2020), which proposed a YOLO (Redmon et al. 2016) based method to detect components in scanned structural diagrams. The authors suggested the method as a basis for reconstructing a Building Information Model (BIM). Various approaches have been presented for symbol detection in floor plans, including YOLO (Rezvanifar et al. 2020), Faster R-CNN (Jakubik et al. 2022; Ziran and Marinai 2018) and graph-based (Renton et al. 2021) methods.
There are a wide variety of uses of the digitised diagram data. This includes similarity search (Bickel et al. 2023), diagram comparison (Daele et al. 2021) and classification (Xie et al. 2022). For instance, Daele et al. (2021) used deep learning to create a technical diagram similarity search tool (Daele et al. 2021). They used 5000 technical diagrams. A traditional method based on Density-Based Spatial Clustering of Applications with Noise (DBSCAN) (Ester et al. 1996) was used to partition the diagram. A CNN containing three convolutional layers classified drawing segments as ‘table’, ‘two-dimensional CAD drawing’ or ‘irrelevant’. A siamese neural network classified a pair of CAD images as either ‘same’ or ‘different’ based on cosine similarity. An accuracy of 96.9% was reported.
Xie et al. (2022) used deep learning to classify engineering diagrams according to the manufacturing method. A dataset of 1692 industry diagrams of engineering equipment was used. First, the diagrams were pre-processed by removing tables and dimension lines. Information tables were identified using CascadeTabNet (Prasad et al. 2020). The model contained two neural networks. The first, HRNet, was used for feature extraction and the second, Cascade R-CNN, for bounding box proposal. Reported precision was 97%. In comparison, the precision of a heuristic method based on watershed segmentation was lower at 78%. Dimension lines were detected using a Graph Neural Network (GNN), which outperformed a heuristic method. However, the authors reported that the network predictions allowed higher fault tolerance. The pre-processed diagram was then converted to graph format. Each node was embedded with line start and end positions. A GNN was used to predict the appropriate manufacturing method. This was shown to outperform various CNN and graph-based approaches. Overall accuracy of 90.8% was reported.
Digitised data from engineering diagrams can be used towards creating a digital twin (Vilgertshofer et al. 2019), (Mafipour et al. 2023). For instance, Vilgertshofer et al. (2019) created a CNN-based symbol detection method to check for discrepancies between archived railway technical drawings and built infrastructure. They noted that the method provided significant support towards creating a digital twin of railway infrastructure.
Dzhusupova et al. (2022) proposed a YOLOv4 (Bochkovskiy et al. 2020) based model to detect specific combinations of shapes in P&IDs that represented engineering errors. Domain experts manually labelled 2253 industry P&IDs with eight classes of equipment combinations. A balanced dataset was obtained by creating new examples of rare symbol instances manually. The authors reported around 70% correct recognition, however the results per class were not presented.
The literature shows that deep learning has been employed for various digitisation applications. Amongst the different types of complex engineering diagrams and documents used, there was considerable research attention on P&IDs. Diagrams were sourced from a range of industries such as nuclear (Gao et al. 2020), construction (Zhao et al. 2020), and oil and gas (Elyan et al. 2020a). In addition to digitising diagram elements, existing literature showed that deep learning was also used for related diagram analysis purposes. These include creating a diagram search tool (Daele et al. 2021), determining the appropriate manufacturing method (Xie et al. 2022) and detecting engineering errors (Dzhusupova et al. 2022). Data contained within engineering diagrams is of critical importance, and there is potential for deep learning to be used for additional digitisation applications.
2.2 Metrics
Evaluation metrics are calculated using model predictions and the ground truth. The precision, recall and F1 score are calculated using True Positives, False Positives and False Negative detections. Precision is the ratio of True Positives to the number of predicted positives, refer to Eq. 1. Recall is the ratio of True Positives to the number of actual positives, refer to Eq. 2. The F1 score combines the previous two metrics and is defined as the harmonic mean of precision and recall, as shown in Eq. 3.
A True Positive detection is defined using object class and location. Firstly, the predicted symbol class must match that of the ground truth. Secondly, the Intersection Over Union (IOU) (Eq. 4) is considered.
Symbol detection methods were also commonly evaluated using the mean Average Precision (mAP). This is defined as the mean of the Average Precision (AP) across all classes, as shown in Eq. 5. Here \(AP_{\textit{i}}\) is the AP of the i-th class and C is the total number of classes.
The AP for each class is defined as the Area Under the Curve (AUC) of the precision-recall curve. This metric is commonly specified at an IOU threshold of 0.5. Note that other IOU thresholds may be specified, for example the COCO dataset (Lin et al. 2014) uses AP@[.5 : .05 : .95], which calculates the average AP at ten different IOU thresholds.
2.3 Symbols
Symbols are considered one of the main drawing elements in engineering diagrams. Examples of symbols are shown in Fig. 3. Symbol recognition can be a complex task for multiple reasons. Each diagram typically contains numerous symbol instances, for example, one study reported on average 180 symbols per P&ID (Elyan et al. 2020a). Symbols represent a wide range of equipment types, and consequently, they vary in size and shape. Additionally, there is often a low amount of interclass variation (Paliwal et al. 2021a; Rahul et al. 2019) which can result in difficulty distinguishing between symbol classes, refer to Fig. 4. Moreover, symbols may be overlapped by other drawing elements (Nurminen et al. 2020), shown in varying orientations (Nurminen et al. 2020), represented by simple shapes (Ziran and Marinai 2018) or even by only a few lines (Rezvanifar et al. 2020).
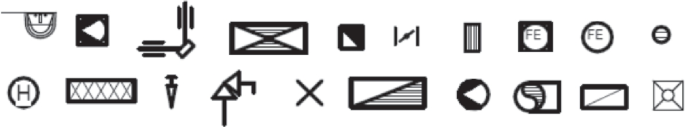
Examples of engineering symbols as shown in the diagram legend
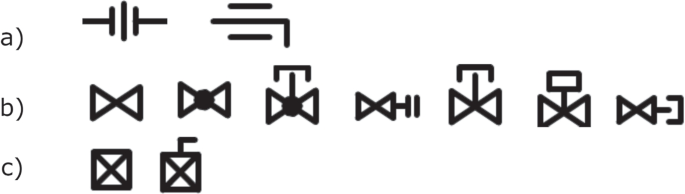
Visually similar symbols from mechanical engineering diagrams: a Union and Butterfly Valve, b gate valve, globe valve, lockable flow control valve, hose-end drain valve, lockshield valve, automatic control valve, valve and capped provision, c flow switch and balancing valve (plug)
Recent literature shows an increasing number of deep learning-based methods for recognising symbols in engineering diagrams, as shown in Table 2. The most commonly used methods were object detection models. These models predict the location, defined by a bounding box, and the class of objects within an image.
Faster R-CNN (Ren et al. 2015) based methods were popular for engineering symbol detection (Ziran and Marinai 2018; Nguyen et al. 2021; Gao et al. 2020; Stinner et al. 2021; Hu et al. 2021; Joy and Mounsef 2021; Sarkar et al. 2022; Jakubik et al. 2022; Zheng et al. 2022). Faster R-CNN is a two-stage object detector presented in 2015. Two related models were published earlier (Girshick et al. 2014; Girshick 2015). R-CNN (Girshick et al. 2014) was created in 2014. The selective search algorithm (Uijlings et al. 2013) was used to generate around 2000 region proposals from the input image. CNN features were extracted from each region. These features were then input into class-specific linear SVMs for classification purposes. On the prominent PASCAL Visual Object Classes (VOC) (Everingham et al. 2010) dataset, 30% relative improvement was reported over traditional methods based on features such as HOG (Dalal and Triggs 2005). However, the method was computationally slow. Separate CNN computation was required for each region proposal. Fast Region-based CNN (Fast R-CNN) (Girshick 2015) was presented the following year. The model was designed to speed up computation compared to R-CNN. One convolutional feature map was produced for the whole input image. Then, a feature vector was extracted for each region using a Region of Interest (RoI) pooling layer. Class probabilities and bounding box positions were predicted for each region. Later that same year, Faster R-CNN (Ren et al. 2015) was proposed. A Region Proposal Network (RPN) was introduced to speed up the costly region proposal. Convolutional features were shared between the RPN and the downstream CNN.
The feature extraction network used in Faster R-CNN was changed in several studies (Gao et al. 2020; Dai et al. 2016; Hu et al. 2021). For example, Gao et al. (2020) developed a Faster R-CNN component detection method. A dataset of 68 nuclear power plant diagrams was used. Components were split into three groups based on aspect ratio and scaling factor. These groups were small symbols, steam generator symbols and pipes. A separate model was trained for each group. ResNet-50 (He et al. 2016) was used as the feature extractor. ResNet-50 is a type of residual network with 50 layers. The mAP was 96.6%, 98% and 92% for each group. Two other models were evaluated for the detection of the small symbols. The first was Faster R-CNN with Inception (Szegedy et al. 2015) network. Although 100% AP was still obtained for certain classes, lower performance was observed overall. A R-FCN model (Dai et al. 2016) with ResNet-50 was also evaluated. Dai et al. (2016) introduced R-FCN in 2016. All trainable layers in R-FCN are convolutional. Faster inference time was reported compared to Faster R-CNN (Dai et al. 2016). Although the authors of (Dai et al. 2016) reported comparative performance to Faster R-CNN on the PASCAL VOC dataset (Everingham et al. 2007), this was not the case on the nuclear power plant diagrams. The reported AP was significantly lower at 16.24%. The authors used publicly available diagrams, which may be simplified compared to those in a real-world scenario.
Hu et al. (2021) presented an approach to detect the surface roughness symbol from mechanical drawings. A dataset of 3612 mechanical drawings was used. The approach involved symbol detection and text detection. Various object detection models were evaluated. The highest recall and F1 score were reported with Faster R-CNN using ResNet-101 (He et al. 2016) in surface roughness detection. The authors used Single Shot Detector (SSD) (Liu et al. 2015) with ResNet-50 for localising text and LeNet (Cun et al. 1990) for character recognition. An F1 score of 96% was reported. The approach was designed specifically for the surface roughness symbol and may be limited in applicability to a wider range of symbols.
Several engineering diagram studies required the use of a diagram legend (Joy and Mounsef 2021; Sarkar et al. 2022). For example, Joy and Mounsef (2021) used a Faster R-CNN method with ResNet-50 for symbol detection in electrical engineering diagrams. First, symbol shapes were obtained using morphological operations to identify symbol grid cells in the legend table. Next, data augmentation was used to increase the available training data. Detection and recognition rates of 83% and above were reported on a small test set of five diagrams. Increasing the training data diversity may help to improve the results. Sarkar et al. (2022) also used a Faster R-CNN model for symbol detection in engineering drawings. All symbols were treated as belonging to one class. Detected symbols were then assigned a class based on similarity with the symbols in the diagram legend. Two similarity measures were evaluated. The first was based on traditional SIFT (Lowe 2004) features. The second employed a CNN as a feature extractor. Better performance was reported using the SIFT-based approach. These studies relied on the use of a diagram legend, however, this may not be available in practice. Moreover, symbols can be present in the diagrams that do not appear in the legend (Sarkar et al. 2022).
Yun et al. (2020) also created an R-CNN-based method for symbol recognition from P&IDs. Ten industry P&IDs were used. Region proposals were generated using image processing methods customised for each symbol type. Positive and negative regions were obtained. The negative regions were divided into classes using negative class decomposition through unsupervised learning models, namely k-means and Deep Adaptive image Clustering (DAC) (Chang et al. 2017). Positive regions were assigned classes manually. Results showed that the incorporation of the negative classes reduced false positives. A slight improvement was reported using DAC compared to k-means. This method is rule-based and requires manual adjustment for a different use case.
Faster R-CNN based symbol detection methods were also used on floor plan images (Ziran and Marinai 2018; Jakubik et al. 2022). For instance, Ziran and Marinai (2018) presented a Faster R-CNN method for object detection in floor plan images. Two datasets were used. The first contained 135 diverse floor plans obtained from internet search queries. The second consisted of 160 industry floor plans sourced from an architectural firm. Although detailed results of the preliminary experiments were unavailable, improved performance using Faster R-CNN compared to SSD was reported. The initial performance on the first dataset was comparatively low, at 0.26 mAP. Data augmentation and anchor specification increased the mAP to 0.31. For the second, more standardised dataset, the mAP was higher at 0.86. Additionally, the authors used transfer learning to improve performance on the more diverse dataset. The model was pre-trained on the second dataset and then fine-tuned on the first dataset. Performance improved by 0.08 mAP.
Jakubik et al. (2022) presented a human-in-the-loop system for object detection and classification in floor plans. The symbol detection method was based on Faster R-CNN. A training dataset of 20, 000 synthetic images was created using legend symbols and data augmentation. The test set of 44 industry floor plans was manually annotated with 5907 symbols from 39 classes. An uncertainty score was calculated for each detected and then classified symbol. Symbols were then labelled by a human expert in order of decreasing uncertainty. A range of uncertainty measures was evaluated. Increased accuracy was reported compared to random selection at 50% of the labelling budget, using all but one uncertainty measure.
One-stage object detection models have also been used for engineering symbol detection (Zhao et al. 2020; Rezvanifar et al. 2020; Elyan et al. 2020a; Toral et al. 2021; Zheng et al. 2022). These models are faster than two-stage models. One of the most well-known one-stage object detection models is YOLO (Redmon et al. 2016), which was created in 2016. A real-time inference speed of 45 fps was reported. In contrast, the authors of Faster R-CNN (Ren et al. 2015) reported a lower processing speed of 5 fps. YOLO is comparatively faster as a single neural network was used to predict bounding boxes and class probabilities. The network had 24 convolutional layers followed by 2 fully connected layers. The input image is divided into a S x S grid. Objects are assigned to the grid cell that contains the object centre. Each grid cell predicts B bounding boxes. The centre of the bounding box is defined relative to the grid cell, whereas the width and height are predicted relative to the whole image. Class-specific confidence scores for each box are also predicted. Several extensions to the initial YOLO version (Redmon et al. 2016) were proposed. YOLOv2 (Redmon and Farhadi 2017) contained several modifications, including multi-scale training and anchor boxes. The base network, Darknet-19, had 19 convolutional layers. In YOLOv3 (Redmon and Farhadi 2018), the bounding boxes were predicted at three different scales. A feature extractor with 53 convolutional layers was used. Newer versions, YOLOv4 (Bochkovskiy et al. 2020), YOLOv5 (Jocher et al. 2020), YOLOv6 (Li et al. 2022) and YOLOv7 (Wang et al. 2022) were also proposed. Another one-stage object detection model is SSD (Liu et al. 2015). The single network employs multi-scale feature maps for predictions. RetinaNet (Lin et al. 2017) is also a one-stage detector. The model was introduced in 2017 and employs the novel focal loss function.
YOLO-based methods have been used for symbol detection in several different diagram types, including structural diagrams (Zhao et al. 2020), floor plans (Rezvanifar et al. 2020), and P&IDs (Elyan et al. 2020a). For example, Zhao et al. (2020) presented a YOLO-based method to detect components in scanned structural diagrams. Five symbol classes were considered. Related semantic information, such as the symbol tag, was included in the symbol bounding box. Data augmentation increased the dataset size from 500 to 1500 images. F1 score of 86.7% and above was reported.
Focusing on architectural floor plans, Rezvanifar et al. (2020) proposed a YOLOv2 symbol detection method. A private dataset of 115 diagrams was used. Various backbone networks were evaluated. Higher mAP was reported using ResNet-50 compared to Darknet-19 and Xception (Chollet 2017). However, detection performance varied widely across the 12 classes considered. For example, the accuracy for the window symbol was 76% compared to 100% for the shower symbol. This may be due to the window symbol’s varying aspect ratio and visual similarity compared to other image components. Additionally, 70 floor plans from the public Systems Evaluation SYnthetic Documents (SESYD) dataset were used. Results improved compared to traditional symbol spotting methods. However, the authors observed that the SESYD diagrams were simpler than typical real-world floor plans. Moreover, there were no intra-class symbol variations. Although YOLOv3 performance was not evaluated, its multi-scale prediction may improve the performance on the relatively small symbols (Redmon and Farhadi 2018).
In another study, Elyan et al. (2020a) created methods for symbol detection and classification in P&IDs. A dataset of 172 industry P&IDs from an oil and gas company was used. The symbol detection method was based on YOLOv3. Accuracy was 95% across 25 symbol classes. The authors observed lower class accuracy for the least represented classes. Additionally, a Deep Generative Adversarial Neural Network was presented to handle class imbalance for symbol classification. GAN (Goodfellow et al. 2014) are deep learning models designed to generate data. GANs contain two models. These are a generator and a discriminator. A generative model is trained to produce fake data which is indistinguishable from real data by the discriminator. The authors used a Multiple Fake Class GAN (MFC-GAN) (Ali-Gombe and Elyan 2019) to generate synthetic instances of the minority class. Experiments showed that realistic synthetic samples were generated. The synthetic instances improved CNN classification. Note that these results were based on using only a few training samples per class. For instance, the Angle Choke Valve class was represented by only two instances in the initial dataset.
A number of researchers used a CNN classifier with a sliding window approach to detect symbols in engineering diagrams (Mani et al. 2020; Yu et al. 2019). Classifiers predict an object class for a given image. For instance, Mani et al. (2020) created a classification-based method for extracting two symbol classes from P&IDs. A dataset of 29 P&IDs was used. The sliding window method extracted fixed-size image patches from the diagram. The CNN had three convolutional layers and two fully connected layers. Patches were classified as ‘tag’, ‘Locally Mounted Instrument’ (LMI) or ‘no symbol’. On 11 test diagrams, tags were classified with a precision of 100% and recall of 98%. LMIs were classified with a precision of 85% and recall of 95%. According to the authors, results were poorer for LMIs due to visually similar components.
Yu et al. (2019) used a similar approach to detect symbols in P&IDs. A dataset of 70 industry P&IDs was used. First, image processing techniques were employed for diagram realignment and to remove the outer border. An AlexNet (Krizhevsky et al. 2012) classifier was then used with a sliding window approach. Candidate symbol regions were identified by means of morphological close and open operations. The window size was customised for each symbol class. The symbol recognition accuracy was 91.6%. This method was tested on a limited test set of only two P&IDs. Moreover, the test diagrams contained a simple equipment layout with little interference between components. Whilst promising results were reported in these studies, this method would likely become computationally expensive for a more extensive use case. Although the sliding window approach was frequently used with traditional methods, including Haar cascades (Viola and Jones 2001) and Deformable Part Models (Felzenszwalb et al. 2008), there is a prohibitive computational cost of classifying each window using a CNN. Moreover, small stride and multi-scale windows are typically required to obtain high localisation accuracy.
Segmentation-based methods have also been used to digitise symbols from engineering diagrams (Paliwal et al. 2021a; Rahul et al. 2019). Rather than predicting a symbol bounding box, segmentation methods generate pixel-level predictions. For instance, Rahul et al. (2019) created a Fully Convolutional Network (FCN) (Long et al. 2015) method to segment 10 symbol classes from P&IDs. The authors used four real-world P&IDs from an oil company. F1 scores of 0.87 and above were recorded. However, the authors reported that their methods’ performance dropped in the presence of visually similar symbols. This was observed in a dataset of P&IDs with a relatively blank background.
Paliwal et al. (2021a) used a combination of methods to recognise symbols in P&IDs. Basic shape symbols were detected using traditional methods, such as Hough transform for circle detection. Complex symbols were localised using an FCN (Long et al. 2015) segmentation model and classified using Three-branch and Multi-scale learning Network (TBMSL-Net) (Zhang et al. 2020). The methods were evaluated on 100 synthetic P&IDs and a smaller private dataset of 12 real-world P&IDs. An F1 score of 0.820 and above across 32 symbol classes was reported on the synthetic test set. Improved performance compared to Rahul et al. (2019) was observed on the real-world P&IDs. The use of the Hough transform for basic shapes is unlikely to generalise well across different symbol sizes and appearance variations.
Graph-based methods have been used to recognise symbols in engineering diagrams (Paliwal et al. 2021b; Renton et al. 2019, 2021). A graph in this context is comprised of nodes connected by edges. For example, Paliwal et al. (2021b) created a Dynamic Graph Convolutional Neural Network (DGCNN) (Wang et al. 2018) to recognise symbols in P&IDs. The symbols were represented in graph form and then classified using the DGCNN. Classification accuracy of 86% was recorded on 100 synthetic P&IDs. Symbol misclassifications were observed due to noise and clutter. The method was compared to the FCN based-method presented by Rahul et al. (2019) on 12 real-world P&IDs, and improved F1 scores were reported for 3 out of 11 classes. Only one instance per class was used to train the DGCNN. To increase the model’s robustness, it was augmented with embeddings from a ResNet-34 network pre-trained on symbols.
Renton et al. (2019) introduced a GNN method for symbol detection and classification in floor plans. A dataset of 200 floor plans was used. First, the floor plans were converted into Region Adjacency Graphs (RAGs). The nodes represented parts of images, and the edges represented relationships between these parts. Using a GNN, nodes were classified as one of 17 symbol types. This work was developed further in Renton et al. (2021), when the authors clustered the nodes into subgraphs corresponding to symbols. Here a symbol detection accuracy of 86% was reported.
Mizanur Rahman et al. (2021) employed a combination of graph-based methods and Faster R-CNN for symbol detection in circuit diagrams. A dataset of 218 diagrams was used. The symbol detection method was based on Faster R-CNN with ResNet-50. Graph methods were then used to refine the model. Detected symbols were graph nodes. Symbol-to-symbol connectors, identified through image processing-based blob detection, were graph edges. Graph Convolutional Networks (GCN) and node degree comparison were used to identify graph anomalies, which were potentially false negative predictions from Faster R-CNN. The Faster R-CNN model was then fine-tuned using the anomaly regions. An improvement in recall between 2 and 4% was reported, although the overall F1 score decreased by up to 3%. Additionally, graph refinement techniques were used to identify incorrectly labelled nodes. However, the recall was reduced by up to 3% compared to Faster R-CNN alone. One drawback of the symbol-to-symbol connection method was that it missed complex connections which looped around a symbol.
Studies on engineering symbols classification are also available in the published literature (Elyan et al. 2020b, 2018). For example, Elyan et al. (2018) presented work on engineering symbols classification. Symbols were classified using Random Forest (RF), Support Vector Machine (SVM) and CNN. Comparable results with all three methods were reported. The authors also applied a clustering-based approach to find within-class similarities. This benefitted RF and SVM performance. However, there was a slight decrease in CNN performance, potentially due to the limited dataset size.
In summary, it can be said that despite the use of state-of-the-art deep learning methods, detecting and recognising symbols in complex documents and engineering drawings continues to be an inherently challenging problem. Many factors contribute to the challenge including symbol characteristics such as a lack of features (Ziran and Marinai 2018; Rezvanifar et al. 2020), high intra-class variation (Rezvanifar et al. 2020) and low inter-class variation (Paliwal et al. 2021a; Rahul et al. 2019). Moreover, the lack of publicly available annotated datasets (Moreno-García et al. 2019) increases the difficulty of the task. Consequently, further research is required to improve methods for symbol digitisation from complex diagrams.
2.4 Text
Text is another major component that exists in almost all types of engineering diagrams. Text digitisation here involves two stages, first, the detection of the text and second, the recognition of the text. This is illustrated in Fig. 5. Both the detection and recognition steps are considered challenging for multiple reasons. Each diagram typically contains numerous text strings. For example, Jamieson et al. (2020) used 172 P&IDs and reported on average 415 text instances per diagram, whilst Francois et al. (2022) used 330 engineering documents and reported on average 440 text boxes. Unlike text in documents with a specific format, text in complex diagrams can be present anywhere in the drawing (Francois et al. 2022), including within symbols (Mani et al. 2020). Additionally, these text strings are often shown in various fonts (Rahul et al. 2019), printed in multiple orientations (Jamieson et al. 2020; Gao et al. 2020; Toral et al. 2021) and vary widely in length (Francois et al. 2022). Moreover, this text is often present in a cluttered environment and can overlap other diagram elements (Kang et al. 2019), as is shown in Fig. 6.

Text digitisation is most commonly approached in recent engineering diagram literature in two steps. Firstly, a text detection model predicts text regions within an image. Secondly, a text recognition model predicts a text string from a cropped text instance
The text within engineering diagrams is commonly shown in multiple orientations, a cluttered environment and overlapped by separate text strings or other shapes
Whilst there has been a considerable amount of research on text digitisation, most of it was focused on scene text (Ye and Doermann 2015). Scene text is defined as text that appears in natural environments (Long et al. 2018; Liu et al. 2020). However, text in undigitised complex documents presents unique challenges that are generally not observed for text in natural scenes. These specific challenges include image degradation (Moreno-García et al. 2018) and the presence of multiple visually similar drawing elements. Complex documents often lack colour features that can be used to distinguish text from the background. Moreover, the task is more complicated than digitising text from standard format documents, where text is typically presented in straight lines and composed of known words.
There is a clear shift toward using deep learning-based methods in text digitisation, as shown in a relatively recent extensive review paper (Long et al. 2018). Deep learning models automatically extract image features, whereas traditional text methods rely heavily on manually extracted features. For instance, text detection methods commonly used image features based on colour, edge, stroke and texture (Ye and Doermann 2015). Specific features used included HOG, Stroke Width Transform, and Maximally Stable Extremal Regions. Two popular traditional text detection methods were based on Connected Components Analysis (CCA) and sliding window classification (Ye and Doermann 2015; Long et al. 2018). CCA methods extract candidate text components and then filter out non-text regions using heuristic or feature-based methods (Long et al. 2018).
Various deep learning models were used to detect text in complex diagrams, as shown in Table 3. The majority of studies used models designed for text detection, including Character Region Awareness for Text Detection (CRAFT) (Baek et al. 2019), Efficient and Accurate Scene Text Detector (EAST) (Zhou et al. 2017), Connectionist Text Proposal Network (CTPN) (Tian et al. 2016) and SegLink (Shi et al. 2017a). CRAFT (Baek et al. 2019) was designed to localise individual characters, whereas EAST (Zhou et al. 2017) uses a FCN to predict word or text line instances from full images. Meanwhile, CTPN (Tian et al. 2016) localises text lines, while SegLink (Shi et al. 2017a) decomposes text into oriented boxes (segments) connected by links.
Object detection models have also been used to detect text in engineering diagrams (Nguyen et al. 2021; Hu et al. 2021; Toral et al. 2021). For example, Nguyen et al. (2021) created a Faster R-CNN method to detect symbols and text in scanned technical diagrams. A large dataset of 4630 technical diagrams was used. Five classes were considered. Individual characters were recognised from the text regions using a CNN separation line classifier and a CNN character classifier. The average F1 score was 89%, although performance varied across object classes. The lowest F1 score, 78%, was reported for the least represented class. Text recognition exact match accuracy was 68.5%. Toral et al. (2021) also used an object detection model for text detection. They created a YOLOv5 method to detect pipe specifications and connection points. Pipe specifications are text strings with a specific format, whereas the connection point symbol contains a short text string. A heuristic method was applied to the detected object regions to obtain text regions. The text was recognised using Tesseract. Detection and recognition accuracy of 93% and 94% was reported. Rumalshan et al. (2023) presented methods for component detection in railway technical maps. The components were a combination of text codes and simple shapes. Their Faster-RCNN method outperformed YOLOv3 and SSD methods. Seeded region growing (Adams and Bischof 1994) was used to preprocess the detected regions prior to OCR. White pixels at the edge of the regions were the seeds.
Whilst there is a range of deep learning models designed for text recognition, a popular choice was to use Tesseract software (Smith 2007), as shown in Table 3. The latest versions of this employ deep learning. Deep learning text recognition models can be considered segmentation-based or segmentation-free methods (Chen et al. 2021). Segmentation methods generally contain preprocessing, character segmentation and character recognition steps. In contrast, segmentation-free approaches predict a text string from the entire text instance. For example, these methods may comprise image preprocessing, feature extraction, sequence modelling, and prediction steps (Chen et al. 2021). Sequence modelling considers contextual information within a character sequence. A type of Recurrent Neural Network (RNN) known as a Bi-directional Long-Short Term Memory (LSTM) Network is often used. The two main prediction methods are attention based (Bahdanau et al. 2015) and Connectionist Temporal Classification (CTC) (Graves et al. 2006). One example of a deep learning text recognition method is the Convolutional Recurrent Neural Network (CRNN) (Shi et al. 2017b). It combines a CNN, an RNN and a transcription layer.
Engineering diagrams may contain symbols and shapes that are visually similar to text. This was reported in a study by Jamieson et al. (2020). Here, the authors built a framework to digitise engineering drawings. They used EAST (Zhou et al. 2017) to localise text and LSTM-based Tesseract (Smith 2007) for text recognition. Good performance was achieved overall with 90% of text instances detected. However, false positives were predicted for shapes visually similar to text, including dashed lines and symbol sections. Yu et al. (2019) also reported a similar challenge. They used a CTPN (Tian et al. 2016) based method to detect text in P&IDs. Character recognition accuracy was 83.1%. Although the two test diagrams used had a simple equipment layout, part of a symbol was recognised as a character.
Another challenging problem with text digitisation is the orientation of the text. This was reported in several studies (Kim et al. 2021b; Gao et al. 2020; Paliwal et al. 2021a), and various methods were proposed to handle it. For example, Kim et al. (2021b) created methods to recognise symbols and text in P&IDs. The text was detected using the easyOCRFootnote 1 framework and recognised using Tesseract (Smith 2007). EasyOCR is based on CRAFT (Baek et al. 2019) and CRNN methods. Text rotation was estimated based on aspect ratio and text recognition score. Text detection and recognition combined precision and recall were 0.94 and 0.92, respectively. The authors used P&IDs that contained no noise or transformations, however this is not necessarily the case in practice (Moreno-Garcia and Elyan 2019). Text digitisation methods were also applied on rotated diagrams (Gao et al. 2020; Paliwal et al. 2021a). For instance, Paliwal et al. (2021a) proposed methods to digitise P&IDs. First, the text was detected using CRAFT and recognised using Tesseract. Then, the diagram was rotated and the process was repeated to capture missing vertical text strings. Text detection and recognition accuracy of 87.18% and 79.21% was reported.
Another key challenge is that text in engineering diagrams is often composed of codes rather than known words. This differs from the text in other document types, which typically belongs to a specific lexicon. Rahul et al. (2019) used prior knowledge of the text structure when they digitised pipeline codes from P&IDs. The method was based on a CTPN model (Tian et al. 2016) and Tesseract. Text detection accuracy was 90%. The pipeline codes had a fixed structure, which was used to filter out false positive text strings. However, complex diagrams contain text for numerous reasons, and details of the various structures are not always available.
Francois et al. (2022) proposed a correction method for recognised text. The dataset comprised 330 industry engineering documents, including P&IDs and isometrics. Their text method was based on the EAST model (Zhou et al. 2017) and Tesseract. A post-OCR correction step involved text clustering using affinity propagation. The Levenshtein distance was used as the similarity measure. Clusters were defined to maximise the similarity score between data points. The post-OCR correction improved tag recognition from 75 to 82%. However, the application of this method to other scenarios relies on the text character structure being known in advance.
Text digitisation from complex engineering diagrams remains challenging. Although text detection and recognition has received large research interest (Long et al. 2018; Ye and Doermann 2015; Chen et al. 2021), the majority was focussed on scene text (Ye and Doermann 2015). The literature shows that text within engineering diagrams presents different challenges. In engineering diagrams, the text can be present anywhere in the image (Francois et al. 2022), of multiple orientations (Jamieson et al. 2020), and is frequently overlapped by other shapes. One particular challenge for deep learning models is distinguishing text from other similar shapes in the diagram (Jamieson et al. 2020; Yu et al. 2019). Moreover, compared to other domains, there is a lack of publicly available annotated text datasets. Further research is necessary to enable accurate text detection and recognition from complex engineering diagrams.
2.5 Connectors
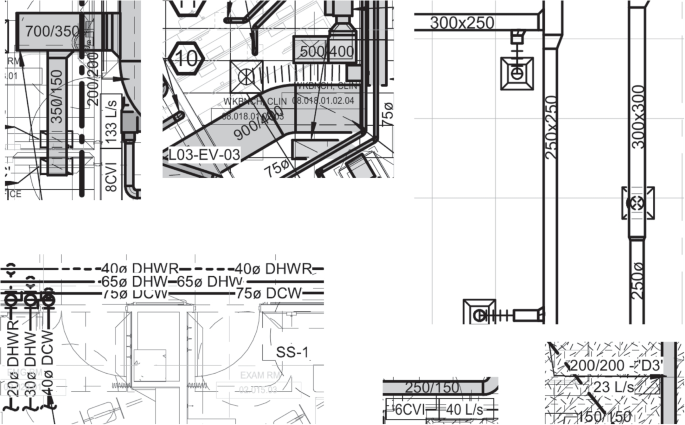
Connectors in engineering diagrams represent the relationship between symbols. The simplest representation of a connector is a solid line, which typically represents a pipeline. More complex line types such as dotted lines and dashed lines are also used, which represent specialised connectors such as electrical signal or air lines. Examples of different connectors can be seen in Fig. 7. Although connector extraction may seem a simple task, it can be difficult for computer vision methods to distinguish between connectors and other shapes in the diagram. This problem occurs as all diagram elements are essentially composed of lines. For instance, the character ‘l’ may also be considered a short line. Methods to overcome this challenge and accurately digitise connectors are required, as their information is vital for understanding the flow through a system.
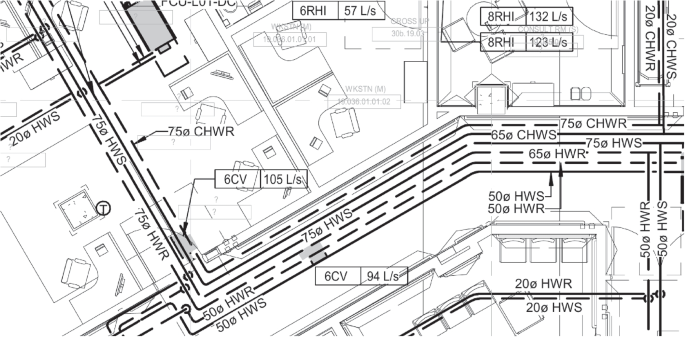
Section of engineering diagram showing different line representations
Despite the recent advances in deep learning, methods employed for line detection are still primarily based on traditional approaches (Rahul et al. 2019; Stinner et al. 2021; Yu et al. 2019; Kang et al. 2019). For instance, Yu et al. (2019) introduced methods for line recognition in P&IDs. First, image processing techniques were employed for diagram realignment and to remove the outer border. A series of image processing methods was used for line recognition. This involved determining the most common line thickness. Reported accuracy was 90.6%. The authors reported that symbol sections were recognised as lines. Difficulty in recognising dotted and diagonal lines was also reported in this study. This was observed even in a very limited test set of only two P&IDs which contained a simple equipment layout with little interference between components. Kang et al. (2019) also used a traditional method for line extraction from P&IDs. Lines were extracted based on the symbol connection point and sliding window method. Particular difficulties recognising diagonal and separated lines were reported.
Other traditional line extraction methods include those based on the Hough transform or kernels. In a study by Stinner et al. (2021), lines were detected using binarisation and Hough transform. Line crossings were detected using a line intersection algorithm. Meanwhile, Rahul et al. (2019) used the more efficient Probabilistic Hough Transform (PHT) (Kiryati et al. 1991) to detect pipelines in P&IDs. Although the P&IDs appear to have a relatively blank background, the pipeline detection accuracy, 65%, was still effected by noise and overlapping drawing elements. In the kernel-based method, a small filter is passed over the diagram and a convolution operation is applied. Paliwal et al. (2021a) used a kernel-based method to detect lines in P&IDs. A higher detection accuracy for complete lines (99%) than for dashed lines (83%) was reported. The authors considered the line width and image spatial resolution when designing the structuring element matrix. It should be noted, however, that kernel-based methods are very sensitive to noise and the thickness of lines.
Although not commonly seen in the literature, line detection may be considered as an object detection problem. This approach was employed by Moon et al. (2021) in their study on line detection in P&IDs. A dataset of 82 remodelled industry P&IDs was used. First, the P&ID border was removed using binarisation, pixel processing and morphological operations. A RetinaNet (Lin et al. 2017) object detection model was used to detect flow arrows and specialised line types, such as electrical signal lines. These lines were composed of either a line with a shape overlaid, or a series of dashes. In the latter case, each dash was treated as an object. A post-processing step was needed to merge the detected line sections. Continuous lines were detected using traditional image processing methods, including line thinning and Hough transform. Symbol and text regions detected using the method created by Kim et al. (2021b) were removed to discard false-positive lines. A precision of 96.1% and recall of 89.6% was reported. The dataset was imbalanced, although the results showed that highest performance was not always obtained for the most represented class.
Connector detection is also considered a challenging problem. Despite the recent popularity of deep learning digitisation methods for symbols and text, this is not the case for connector digitisation methods. Methods used for this task are still primarily based on traditional approaches (Rahul et al. 2019; Kang et al. 2019; Stinner et al. 2021). Such approaches include the Hough transform, Probabilistic Hough Transform (Kiryati et al. 1991) and kernel-based methods. Furthermore, the scale of the problem is increased as multiple line types can be present in one diagram (Moon et al. 2021; Rahul et al. 2019; Kang et al. 2019). Distinguishing connectors from other shapes in the diagram can be difficult for computer vision methods. Moreover, there is a lack of connector-labelled datasets for use with deep learning models. Therefore, accurate connector detection from complex engineering diagrams remains difficult, and improved methods are required.
3 Challenges
Although there are numerous benefits of using deep learning methods for diagram digitisation, such as their generalisability to the variations seen in the drawings and automatic feature extraction, the existing literature also suggests various challenges. These are a lack of public datasets, data annotation, evaluation, class imbalance and contextualisation. Compared to traditional methods, deep learning methods typically require large quantities of training data. Due to proprietary and confidentiality reasons, diagram datasets are generally not available in the public domain. Furthermore, when datasets can be obtained, they typically need to be labelled for use with supervised deep learning models. The lack of annotated datasets increases the difficulty of evaluating digitisation methods. The fourth challenge arises from the fact that while deep learning models are typically designed for balanced datasets, engineering diagram datasets are inherently imbalanced. A detailed discussion of these challenges is presented in this section.
3.1 Datasets
The lack of publicly available engineering diagram datasets makes it difficult to compare and benchmark various methods. As can be seen in Table 4, most methods are evaluated using proprietary datasets. It should also be pointed out that there is a vast variety of formats for these drawings. Specific organisations or even specific projects may adopt their own drawing formats, which would not be captured in publicly available datasets. This means that retraining models to suit specific engineering drawing datasets is an important and necessary factor to consider. One example of a public dataset used in the digitisation literature is the Systems Evaluation SYnthetic Documents (SESYD) floor plan dataset (Rezvanifar et al. 2020). However, this dataset is synthetic, contained no intra-class symbol variations and was considered simpler than typical real-world floor plans (Rezvanifar et al. 2020). Moreover, researchers working on floor plan digitisation still report a lack of available training data (Ziran and Marinai 2018).
Synthetic diagrams have been utilised in the absence of sufficient real-world data (Paliwal et al. 2021a; Sierla et al. 2021; Nurminen et al. 2020; Haar et al. 2023; Bickel et al. 2021). For instance, Paliwal et al. (2021a) generated a dataset comprising 500 annotated synthetic P&IDs. Image noise was added. The dataset contained 32 equally represented symbol classes. However, class imbalance is inherent in real-world P&IDs and can cause models to be biased towards overrepresented classes. Sierla et al. (2021) included data extraction from scanned P&IDs as a step in their methodology for the semi-automatic generation of digital twins. YOLO was used for symbol detection. The authors generated artificial images by placing symbols from process simulation software on a white background. However, these images were relatively simple and did not present the challenges associated with scanned P&IDs. Similarly, Nurminen et al. (2020) created artificial images using process simulation software. They created a YOLOv3-based model for symbol detection in P&IDs. The method was evaluated on artificial images and scanned industrial P&IDs. Meanwhile, Bickel et al. (2021, 2023) generated synthetic training data for symbol detection in principle sketches. They used a fixed set of rules to generate symbols, which was practical in this case owing to the defined representation limits of the drawings used.
Stinner et al. (2021) used images from symbol standards and internet search images to increase the training dataset size. They presented work on extracting symbols, lines and line crossings from P&IDs. The authors used five industry P&IDs. They used a Faster R-CNN-based method to detect four symbol types. The authors reported 93% AP over all symbol classes. However, performance was lower for certain object classes compared to others.
Haar et al. (2023) presented symbol and text detection methods for engineering and manufacturing drawings. A dataset of 15 real drawings and 1000 synthetic images was used. Synthetic data was generated by cropping symbols from the real drawings and randomly placing them on the basic drawings with varying orientations and sizes. YOLOv5 was used to detect symbols. EasyOCR was used for the text. The model utilised VGG and ResNet for feature extraction, LSTM and CTC. The YOLOv5 model performance on the real diagrams (36.4 mAP) was lower than on the synthetic dataset (87.6 mAP). The text method was evaluated on five diagrams and correctly recognised 68% of text characters. Mathematical special characters and rotated texts were highlighted as a challenge.
Although there is a lack of text datasets for engineering diagrams, many text datasets exist in other domains. In 2015, commonly used text datasets were discussed in a review (Ye and Doermann 2015). The largest dataset mentioned was IIIT5K Word (Mishra et al. 2012), which contains 5, 000 cropped images. Since then, demand for significantly bigger datasets to train deep learning models has increased. Today, the largest text datasets contain millions of synthetic text instances (Chen et al. 2021). For example, Synth90K (Jaderberg et al. 2014) contains 9 million synthetic annotated text instances. The Unreal text dataset (Long and Yao 2020) comprises 12 million cropped text instances. In contrast, realistic text datasets are smaller, containing thousands of data samples (Chen et al. 2021). Veit et al. (2016) introduced the COCO-Text dataset in 2016. The dataset contained over 173k annotated instances of text in natural images, making it the largest dataset of its type at the time. The International Conference for Document Analysis and Recognition (ICDAR) also introduced text datasets (Karatzas et al. 2013, 2015).
The literature shows an urgent need to have more engineering diagram datasets available in the public domain. Most of the proposed digitisation methods were evaluated on proprietary datasets, which may contain a limited number of diagrams (Hantach et al. 2021; Yu et al. 2019). Although synthetic datasets were also used, these diagrams were typically simple in appearance and not as complex as those in the real-world (Rezvanifar et al. 2020; Sierla et al. 2021). Public access to diagram datasets would also allow for improved comparison between proposed methods. Therefore, the release of public datasets is crucial to accelerate research and development in the area of engineering diagram digitisation.
3.2 Data annotation
Obtaining sufficient annotated data is also regarded as a challenge. When datasets are available, they must be annotated for use with supervised deep learning models. Typically, a large annotated dataset is required for training purposes (Jakubik et al. 2022). Acquiring such data is usually carried out manually. Various software can be used to facilitate this, such as Sloth,Footnote 2 LabelImgFootnote 3 and LabelMe (Russell et al. 2008.). For example, to obtain a symbol dataset, the user needs to draw a bounding box around the symbol and then label it with the relevant class. These steps are required for every symbol of interest in the diagram. Given the high number of symbols per diagram, the process is very time-consuming, costly and prone to human error. Furthermore, given the technical nature of these drawings, a subject matter expert is normally required to complete this task.
One method to reduce the required labelling effort is to create synthetic training data (Gao et al. 2020; Bin et al. 2022; Gupta et al. 2022). The simplest approach is to use traditional image processing algorithms. For instance, Gao et al. (2020) presented a method for component detection in nuclear power plant diagrams. They manually annotated symbols and then used traditional data augmentation techniques, such as image resizing, to increase the training symbol instances (Gao et al. 2020). The AP increased from 40 to 82% when the training dataset increased from 100 to 1000 images. Gupta et al. (2022) created a YOLOv2 method for valve detection in P&IDs. A dataset of three P&IDs was used. Synthetic training data was generated by cropping a symbol and randomly placing it on the background. Experiments showed that model performance improved when the amount of background and similar symbols in the training data was increased. However, evaluation of more than one symbol type and one test diagram is required to determine if the method can be applied to other scenarios.
Synthetic training data was also created using generative deep learning models (Bin et al. 2022; Khallouli et al. 2022). For example, Bin et al. (2022) used a method based on CycleGAN (Zhu et al. 2017) and CNN for P&ID symbol recognition. A dataset of seven P&ID sheets was used. CycleGAN (Zhu et al. 2017) uses unpaired images. The accuracy improved from 90.75 to 92.85% when equal representations of synthetic to authentic samples were used for training. However, the authors reported that the performance gain decreased with a 2:1 ratio of synthetic to authentic samples, as an accuracy of 91.88% was reported. Khallouli et al. (2022) presented work on OCR from industrial engineering documents. Nine drawings of ships were used. They used a method based on ScrabbleGAN (Fogel et al. 2020) to generate synthetic word images. The model contains a generator, discriminator and text recogniser. When the synthetic data was added to manually labelled training data, the character recognition accuracy increased from 96.83 to 97.45% and the word recognition accuracy increased from 88.79 to 92.1%.
Most of the relevant literature used supervised deep learning, which learns from labelled training data. An alternative approach is semi-supervised learning, which uses both labelled and unlabelled data (Van Engelen and Hoos 2020). In contrast, weakly supervised methods use partially labelled data. For example, weakly supervised object detection methods mostly use image-level labels (Zhang et al. 2022). In the area of scene text detection, Liu et al. (2020) presented a semi-supervised method named Semi-Text. ICDAR 2013 (Karatzas et al. 2013), ICDAR 2015 (Karatzas et al. 2015) and Total-Text (Ch’ng and Chan 2017) datasets were used. A Mask R-CNN based model was pre-trained on the SynthText dataset (Gupta et al. 2016). Then, positive samples were obtained by applying the model to unannotated images. The model was then retrained using a dataset of positive samples and SynthText data. The performance improved compared to the baseline model.
Data annotation continues to be largely carried out manually, which proved to be extremely time-consuming and costly. Furthermore, as the diagrams are highly technical, identifying the different symbol classes within a diagram typically requires a domain expert. Therefore, improved methods to speed up the data annotation process, or reduce the need for annotated data, are required.
3.3 Evaluation
Evaluating deep learning methods for complex document digitisation is considered a complex task. Methods used for symbols, text and connectors must all be evaluated separately. Moreover, multiple different metrics are used for the same task. For instance, symbol digitisation methods are evaluated with various metrics including precision, recall, F1 score and mAP. The lack of standard evaluation protocol, along with the use of disparate datasets, increases the difficulty of thoroughly comparing proposed methods.
Symbol detection methods define a True Positive at a specific IOU threshold. The PASCAL (Everingham et al. 2010) evaluation metric was often used in the related work (Jakubik et al. 2022). This defines a correct detection if the IOU is over a threshold of 0.5. More stringent criteria to define a correct detection were also seen. For instance, Rezvanifar et al. (2020) defined a correct detection if the IOU was over 0.75. Meanwhile, Paliwal et al. (2021a) defined a correct symbol detection based on an IOU greater than 0.75 and a correct associated text label. Different symbol evaluation metrics may be used in the case of graph-based methods. For example, Renton et al. (2021) used a GNN for symbol detection and classification. They defined a correct detection if all the symbol nodes representing a symbol were found without any extra node.
Evaluation of diagram digitisation methods is further complicated as the ground truth information is often unavailable. This is a particular issue for the evaluation of text and connector digitisation methods. Manually labelling these components would require substantially more effort than symbol annotation. Therefore, the current evaluation of text and connector digitisation methods is generally subjective (Mani et al. 2020). For instance, Mani et al. (2020) used EAST (Zhou et al. 2017) and Tesseract to digitise text in a set of industry P&IDs. They presented sample output detection and recognition results, however evaluation metrics were not used. Objective evaluation methods were used for text and connector digitisation in a limited number of cases. This occurred when ground truth data was available owing to the use of digital (Francois et al. 2022) or synthetic diagrams (Paliwal et al. 2021a). For example, Paliwal et al. (2021a) created a synthetic dataset of 500 P&IDs. The ground truth data of horizontal and vertical line locations, text locations and text strings were available. Their digitisation methods were evaluated on 100 synthetic P&IDs and a smaller private dataset of 12 real-world P&IDs. However, the text and lines methods were objectively evaluated on the synthetic dataset only. The text was considered correct if the string exactly matched the ground truth. Francois et al. (2022) used text locations extracted from PDF engineering documents as the ground truth. A detection was considered correct if the predicted area corresponded to the ground truth area within an acceptable margin of 10 pixels.
The performance of text recognition methods can be objectively measured by comparing the predicted string to the ground truth. This was seen in cases where digital or synthetic diagrams were used, or for a subset of the text. For instance, Nguyen et al. (2021) extracted two specific text strings from technical diagrams. They applied the Exact Match accuracy for text recognition. The text was considered to be correct if it exactly matched the ground truth. In another study, Kim et al. (2021b) used digital P&IDs for which the text ground truth metadata was available. In addition to text detection precision and recall, Kim et al. (2021b) also evaluated the combined text detection and recognition performance. More specifically, they used the Character Level Evaluation (CLEval) (Baek et al. 2020) metric to obtain precision and recall scores that combined text detection and recognition. CLEval (Baek et al. 2020) employs both instance matching and character scoring. Meanwhile, Khallouli et al. (2022) evaluated their text recognition method using three metrics. These were character recognition rate, word recognition rate and average Levenshtein distance. The latter metric is the number of character edits (such as substitution, insertion or deletion) required to alter the predicted text to the ground truth text.
3.4 Class imbalance
Class imbalance occurs when one or more classes are over-represented in a dataset. It is inherent in engineering diagrams as equipment types are represented with varying frequencies. The problem of class imbalance is known to occur in both deep learning and traditional machine learning (Buda et al. 2018). Learning algorithms trained on imbalanced data are typically biased towards the majority class, which causes minority class instances to be classified as majority classes (Johnson and Khoshgoftaar 2019).
Class imbalance was shown to occur in both engineering symbols classification and detection (Elyan et al. 2020b, a; Kim et al. 2021b; Ziran and Marinai 2018). An example is the work presented by Elyan et al. (2020b), which showed that class imbalance effected the CNN classification performance of a P&ID symbols dataset. Lower performance on underrepresented classes compared to overrepresented classes was reported. In work on object detection, Elyan et al. (2020a) created a YOLOv3 (Redmon and Farhadi 2018) based method for symbol detection of an imbalanced dataset. Overall accuracy was high at \(95\%\), although it varied across classes. A class accuracy of 98% for the majority class with 2810 instances was reported, whereas the accuracy for the minority classes with only 11 instances was 0%.
Similarly, Kim et al. (2021b) reported comparable results in their study on P&ID symbol detection. In particular, a lack of data for large symbols was reported. Lower class-accuracies were observed for underrepresented instances. Ziran and Marinai (2018) also recorded imbalanced symbol distribution in two floor plan datasets. Interestingly, class representation was not strictly correlated with the performance of the Faster R-CNN based model. The highest precision and recall values were not all for the most represented classes. This may be due to the high within-class diversity in the majority classes.
3.5 Contextualisation
In a previous review (Moreno-García et al. 2019), authors defined contextualisation as the process of converting the digitised information (i.e. the shapes detected by the computer vision algorithms) into structured information, which can be used to better explore, manipulate or redraw the diagrams in more interactive and representative ways. In this subsection, we discuss the most common solutions in literature that have been presented for this purpose. We have split the contextualisation challenge into three sub-challenges: (1) the storing challenge, where systems have to be devised in order to save the structural representation in an easy to read/access manner, (2) the connectivity challenge, which refers to how the digitised objects are arranged in from their spatial representation in a way that users are able to know how symbols are connected and (3) the matching challenge, in which we address the issue of how to use these structural representations for real-life purposes, such as finding certain sections within a larger drawing, localising which portions of the drawing have relation to a 3D representation (i.e. the real facility or a digital twin), and ensuring consistency of the structural representation by inspecting it in semi-automated ways.
Since the earliest stages of P&ID digitisation, researchers have realised the need to convert the digitised information into some sort of structural graph representation to address the storing challenge. In the 90s, Howie et al. (1998) proposed a symbolic model output with each of the shapes (symbols and pipes) as a node, and edges connecting them. This means that, despite pipes being connectors within the drawing, these should be represented as another node, as pipes themselves have their own attributes. A toy example is presented in Fig. 8.
Left: A snippet of a P&ID with two shapes connected by a pipe. Right: The structural graph representation as proposed in Howie et al. (1998)
To address both the connectivity and storing challenges simultaneously, other authors have used the notions of graphs to find the connectivity between the symbols, bypassing the line detection. For instance, Mani et al. (2020) used graph search to discover symbol to symbol connections in a P&ID. Each pixel was represented as a node, and links between neighbouring pixels were represented as graph edges. Then, symbol to symbol connections were determined using a depth-first search starting a symbol node. This approach results interesting when drawings have a high quality and the algorithm can traverse from one symbol to another with relative ease. This system relies on connectors not overlapping with each other (since the graph search algorithm could be confused by the direction to take) and thus, have limited applicability when the drawing is complex and presents an entangled connector structure.
There are a handful of applications found in literature to address the matching challenge. For instance, Wen et al. (2017b, 2017a) presented a system to measure 2D–3D process plant model similarities based on their topological distribution, establishing a relation between a 2D engineering drawing and a 3D hydrocarbon plant model. To do this, each model was extracted as a graph, and then the feature similarity is calculated to measure a degree of matching between the two models using a geometric deformation invariant algorithm. Contrary to most of the literature reviewed in this study, authors used a type of CAD drawing called ISO drawing, which is relatively easier to digitise compared to classical engineering drawings mentioned before (e.g. P&IDs) since it is more standardised and contains far more measurements and indicators. Still ISO drawings require vast knowledge and field experience to be correctly digitised and, therefore, the extraction of the attributed graph is done in a semi-automated way. Regarding the 3D plant, extracting the attributed graph is easier since the 3D model is still contained in a CAD file which retains all the meta-data needed for this reconstruction.
Rantala et al. (2019) also applied graph matching techniques to better use plant design information from older designs. Authors performed a review of graph matching techniques and evaluated six algorithms using an illustrative dataset built for purpose. In their evaluation, authors concluded that an algorithm based on simulated annealing with a certain combination of parameters was the best option for this task, as it was capable to detect spurious and inexact correlations. Later on, Sierla et al. (2020, 2021) presented related work on automatic generation of graphs from P&IDs. In this study the input was a P&ID represented in XML format, which was able to be converted into an attributed graph. To this end, authors used a recursive algorithm which also relies in pictures taken from the actual facilities, but that reconstruct the graph with an increased accuracy.
In more recent work presented by Rica et al. (2020, 2021), authors propose graph embeddings which are used to train NNs on how to distinguish local substructures which may be incorrect, this reducing the human effort on performing manual validation of the digitised information. To this end, authors first construct the graphs based on proximity information provided by the digitisation module, and then learn the most common substructures that can be found in the particular drawing set. For instance, a drawing may depict three valves connected in a loop, but no more than that. Afterwards, a GNN is trained to retain this information and validate the drawings. As in most graph-based problems, the complexity of this review increases with the size of the graph; therefore, authors tested this method in a smaller dataset.
4 Conclusion and future directions
Significant progress has taken place in the area of processing and analysing engineering diagrams and complex documents. This includes aspects such as symbol detection, text recognition, and contextualisation. A wide variety of deep learning models were used, for instance the literature shows that symbol digitisation methods are not only based on object detectors but also segmentation, classification and graph approaches. Meanwhile text digitisation methods were based on both specialised text methods and object detectors. Methods for connector detection have received comparatively less attention than symbol and text methods. Only 21% of the reviewed papers presented a method for connector detection. Overall, deep learning methods used for digitisation have proved to be beneficial compared to traditional methods and result in improved performance.
However, further research is still required to solve the timely and challenging problem of complex engineering diagram digitisation. Improved methods are still needed for all diagram components, namely symbols, text and connectors. Newly developed deep learning models such as transformers (Dosovitskiy et al. 2020) maybe of benefit to engineering drawing digitisation, such as in recent related work on CAD drawings (Fan et al. 2022).
The literature shows that engineering diagram digitisation is still regarded as challenging. This can be attributed to several factors including diagram complexity, visually similar drawing components (Kim et al. 2021a; Mani et al. 2020), large intra-class variance (Rezvanifar et al. 2020) and low inter-class variance (Paliwal et al. 2021a; Rahul et al. 2019), amongst others. The remaining key challenges for engineering diagram digitisation were identified as dataset acquisition, data annotation, imbalanced class distribution, evaluation methods and contextualisation. Although methods such as synthetic data generation and data augmentation exist, the literature suggests that further work is needed to address the specific challenges of engineering drawing digitisation.
Therefore, the first and most important need in this area is to develop and release datasets to the public domain to accelerate research and development. Real-world datasets are typically confidential however, datasets released publicly should ideally be of similar complexity and contain properties such as noise, overlapping elements and a wide range of symbols. Furthermore, allowing researchers to use standard datasets would facilitate benchmarking of proposed methods.
Another area that requires improvement is the data annotation process, which is typically time-consuming and consequently costly. One potential research direction that aims to reduce the amount of required labelled data is active learning. These algorithms aim to choose the most informative samples from the unlabelled data (Ren et al. 2021). Labelling only the most informative samples could reduce the amount of data required to train the learning algorithm, reducing the effort required compared to random labelling.
An additional suggestion to reduce the annotation requirement is to include synthetic images in the training data. This was seen in the literature through various methods, including specialist engineering visualisation software (Kim et al. 2021b) and image processing data augmentation techniques (Gao et al. 2020; Joy and Mounsef 2021; Ziran and Marinai 2018; Jakubik et al. 2022). Another method that has been explored is the use of deep learning generative models such as GAN-based approaches (Bin et al. 2022; Elyan et al. 2020a; Khallouli et al. 2022). For the synthetic images to be of the most benefit, they should closely represent the real-world data.
An alternative approach that could reduce the reliance on labelled data is to use methods other than supervised learning. One possible solution is the use of semi-supervised methods. These methods are designed to learn from both labelled and unlabelled data (Van Engelen and Hoos 2020). Another potential future research direction is the use of deep learning methods that learn from a few instances. This could be of particular use given the frequent presence of underrepresented and rare symbols within engineering diagrams. State-of-the-art methods such as few-shot learning are suggested. Unlike supervised learning models, which typically require vast amounts of labelled training data, few-shot methods aim to learn from only a few samples (Antonelli et al. 2022).
References
Ablameyko S, Uchida S (2007) Recognition of engineering drawing entities: review of approaches. Int J Image Graph 7:709–733. https://doi.org/10.1142/S0219467807002878
Adams R, Bischof L (1994) Seeded region growing. IEEE Trans Pattern Anal Mach Intell 16(6):641–647. https://doi.org/10.1109/34.295913
Ali-Gombe A, Elyan E (2019) MFC-GAN: class-imbalanced dataset classification using multiple fake class generative adversarial network. Neurocomputing 361:212–221. https://doi.org/10.1016/j.neucom.2019.06.043
Antonelli S, Avola D, Cinque L et al (2022) Few-shot object detection: a survey. ACM Comput Surv. https://doi.org/10.1145/3519022
Baek Y, Lee B, Han D et al (2019) Character region awareness for text detection. In: 2019 IEEE/CVF conference on computer vision and pattern recognition (CVPR), pp 9357–9366. https://doi.org/10.1109/CVPR.2019.00959
Baek Y, Nam D, Park S et al (2020) Cleval: Character-level evaluation for text detection and recognition tasks. In: 2020 IEEE/CVF conference on computer vision and pattern recognition workshops (CVPRW), pp 2404–2412. https://doi.org/10.1109/CVPRW50498.2020.00290
Bahdanau D, Cho K, Bengio Y (2015) Neural machine translation by jointly learning to align and translate. In: Bengio Y, LeCun Y (eds) 3rd International conference on learning representations, ICLR 2015, San Diego, CA, USA, 7–9 May 2015, conference track proceedings. arXiv:1409.0473
Bay H, Tuytelaars T, Van Gool L (2006) SURF: speeded up robust features. In: European conference on computer vision. Springer, Berlin, pp 404–417
Bhanbhro H, Hooi YK, Hassan Z et al (2022) Modern deep learning approaches for symbol detection in complex engineering drawings. In: 2022 International conference on digital transformation and intelligence (ICDI), pp 121–126. https://doi.org/10.1109/ICDI57181.2022.10007281
Bickel S, Schleich B, Wartzack S (2021) Detection and classification of symbols in principle sketches using deep learning. Proc Des Soc 1:1183–1192. https://doi.org/10.1017/pds.2021.118
Bickel S, Goetz S, Wartzack S (2023) From sketches to graphs: a deep learning based method for detection and contextualisation of principle sketches in the early phase of product development. Proc Des Soc 3:1975–1984
Bin OK, Hooi YK, Kadir SJA et al (2022) Enhanced symbol recognition based on advanced data augmentation for engineering diagrams. Int J Adv Comput Sci Appl. https://doi.org/10.14569/IJACSA.2022.0130563
Bochkovskiy A, Wang CY, Liao HYM (2020) Yolov4: optimal speed and accuracy of object detection. arXiv preprint. arXiv:2004.10934
Buda M, Maki A, Mazurowski MA (2018) A systematic study of the class imbalance problem in convolutional neural networks. Neural Netw 106:249–259. https://doi.org/10.1016/j.neunet.2018.07.011
Chang J, Wang L, Meng G et al (2017) Deep adaptive image clustering. In: 2017 IEEE International conference on computer vision (ICCV), pp 5880–5888. https://doi.org/10.1109/ICCV.2017.626
Chen X, Jin L, Zhu Y et al (2021) Text recognition in the wild: a survey. ACM Comput Surv. https://doi.org/10.1145/3440756
Ch’ng CK, Chan CS (2017) Total-text: a comprehensive dataset for scene text detection and recognition. In: 2017 14th IAPR international conference on document analysis and recognition (ICDAR). IEEE, pp 935–942
Chollet F (2017) Xception: deep learning with depthwise separable convolutions. In: 2017 IEEE conference on computer vision and pattern recognition (CVPR), pp 1800–1807. https://doi.org/10.1109/CVPR.2017.195
Cun YL, Boser B, Denker JS et al (1990) handwritten digit recognition with a back-propagation network. Morgan Kaufmann, San Francisco, pp 396–404
Daele DV, Decleyre N, Dubois H et al (2021) An automated engineering assistant: Learning parsers for technical drawings. In: AAAI
Dai J, Li Y, He K et al (2016) R-FCN: object detection via region-based fully convolutional networks. CoRR. arXiv:1605.06409
Dalal N, Triggs B (2005) Histograms of oriented gradients for human detection. In: 2005 IEEE computer society conference on computer vision and pattern recognition (CVPR’05), vol 1, pp 886–893. https://doi.org/10.1109/CVPR.2005.177
De P, Mandal S, Bhowmick P (2011) Recognition of electrical symbols in document images using morphology and geometric analysis. In: 2011 International conference on image information processing, pp 1–6. https://doi.org/10.1109/ICIIP.2011.6108910
Dosovitskiy A, Beyer L, Kolesnikov A et al (2020) An image is worth 16 × 16 words: transformers for image recognition at scale. CoRR. arXiv:2010.11929
Dzhusupova R, Banotra R, Bosch J et al (2022) Pattern recognition method for detecting engineering errors on technical drawings. In: 2022 IEEE World AI IoT congress (AIIoT), pp 642–648. https://doi.org/10.1109/AIIoT54504.2022.9817294
Elyan E, Garcia CM, Jayne C (2018) Symbols classification in engineering drawings. In: 2018 International joint conference on neural networks (IJCNN), pp 1–8
Elyan E, Jamieson L, Ali-Gombe A (2020a) Deep learning for symbols detection and classification in engineering drawings. Neural Netw 129:91–102. https://doi.org/10.1016/j.neunet.2020.05.025
Elyan E, Moreno-García CF, Johnston P (2020b) Symbols in engineering drawings (SIED): an imbalanced dataset benchmarked by convolutional neural networks. In: Iliadis L, Angelov PP, Jayne C et al (eds) Proceedings of the 21st EANN (Engineering Applications of Neural Networks) 2020 conference. Springer, Cham, pp 215–224
Espina-Romero L, Guerrero-Alcedo J (2022) Fields touched by digitalization: analysis of scientific activity in Scopus. Sustainability. https://doi.org/10.3390/su142114425
Ester M, Kriegel HP, Sander J et al (1996) A density-based algorithm for discovering clusters in large spatial databases with noise. In: KDD, pp 226–231
Everingham M, Van Gool L, Williams CKI et al (2007) The PASCAL visual object classes challenge 2007 (VOC2007) results. http://www.pascal-network.org/challenges/VOC/voc2007/workshop/index.html
Everingham M, Van Gool L, Williams CK et al (2010) The pascal visual object classes (VOC) challenge. Int J Comput Vis 88(2):303–338
Faltin B, Schönfelder P, König M (2022) Inferring interconnections of construction drawings for bridges using deep learning-based methods. In: ECPPM 2022—eWork and eBusiness in architecture, engineering and construction 2022, pp 343–350. CRC Press, Boca Raton. https://doi.org/10.1201/9781003354222-44
Fan Z, Chen T, Wang P et al (2022) Cadtransformer: Panoptic symbol spotting transformer for cad drawings. In: 2022 IEEE/CVF conference on computer vision and pattern recognition (CVPR), pp 10976–10986. https://doi.org/10.1109/CVPR52688.2022.01071
Felzenszwalb P, McAllester D, Ramanan D (2008) A discriminatively trained, multiscale, deformable part model. In: 2008 IEEE conference on computer vision and pattern recognition, pp 1–8. https://doi.org/10.1109/CVPR.2008.4587597
Fogel S, Averbuch-Elor H, Cohen S et al (2020) Scrabblegan: semi-supervised varying length handwritten text generation. In: 2020 IEEE/CVF conference on computer vision and pattern recognition (CVPR), pp 4323–4332. https://doi.org/10.1109/CVPR42600.2020.00438
Francois M, Eglin V, Biou M (2022) Text detection and post-ocr correction in engineering documents. In: Uchida S, Barney E, Eglin V (eds) Document analysis systems. Springer, Cham, pp 726–740
Gao W, Zhao Y, Smidts C (2020) Component detection in piping and instrumentation diagrams of nuclear power plants based on neural networks. Prog Nucl Energy 128:103491. https://doi.org/10.1016/j.pnucene.2020.103491
Girshick R (2015) Fast R-CNN. In: 2015 IEEE International conference on computer vision (ICCV), pp 1440–1448. https://doi.org/10.1109/ICCV.2015.169
Girshick R, Donahue J, Darrell T et al (2014) Rich feature hierarchies for accurate object detection and semantic segmentation. In: 2014 IEEE conference on computer vision and pattern recognition, pp 580–587. https://doi.org/10.1109/CVPR.2014.81
Goodfellow I, Pouget-Abadie J, Mirza M et al (2014) Generative adversarial nets. In: Ghahramani Z, Welling M, Cortes C et al (eds) Advances in neural information processing systems, vol 27. Curran Associates, San Francisco, pp 2672–2680. http://papers.nips.cc/paper/5423-generative-adversarial-nets.pdf
Graves A, Fernández S, Gomez F et al (2006) Connectionist temporal classification: labelling unsegmented sequence data with recurrent neural networks. In: Proceedings of the 23rd International conference on machine learning (ICML ’06). ACM, New York, pp 369–376. https://doi.org/10.1145/1143844.1143891,
Groen FC, Sanderson AC, Schlag JF (1985) Symbol recognition in electrical diagrams using probabilistic graph matching. Pattern Recogn Lett 3(5):343–350
Gupta A, Vedaldi A, Zisserman A (2016) Synthetic data for text localisation in natural images. In: IEEE conference on computer vision and pattern recognition
Gupta M, Wei C, Czerniawski T (2022) Automated valve detection in piping and instrumentation (P&ID) diagrams. In: Proceedings of the 39th international symposium on automation and robotics in construction, ISARC 2022. International Association for Automation and Robotics in Construction (IAARC), pp 630–637
Haar C, Kim H, Koberg L (2023) AI-based engineering and production drawing information extraction. In: International conference on flexible automation and intelligent manufacturing, Springer, Berlin, pp 374–382
Hantach R, Lechuga G, Calvez P (2021) Key information recognition from piping and instrumentation diagrams: where we are? In: Barney Smith EH, Pal U (eds) Document analysis and recognition—ICDAR 2021 workshops. Springer, Cham, pp 504–508
He K, Zhang X, Ren S et al (2016) Deep residual learning for image recognition. In: 2016 IEEE conference on computer vision and pattern recognition (CVPR), pp 770–778. https://doi.org/10.1109/CVPR.2016.90
He K, Gkioxari G, Dollár P et al (2017) Mask R-CNN. In: 2017 IEEE international conference on computer vision (ICCV), pp 2980–2988
Howie C, Kunz J, Binford T et al (1998) Computer interpretation of process and instrumentation drawings. Adv Eng Softw 29(7):563–570. https://doi.org/10.1016/S0965-9978(98)00022-2
Hu H, Zhang C, Liang Y (2021) Detection of surface roughness of mechanical drawings with deep learning. J Mech Sci Technol 35(12):5541–5549
Jaderberg M, Simonyan K, Vedaldi A et al (2014) Synthetic data and artificial neural networks for natural scene text recognition. In: Workshop on deep learning, NIPS
Jakubik J, Hemmer P, Vossing M et al (2022) Designing a human-in-the-loop system for object detection in floor plans. Karlsruhe Institute of Technology, Karlsruhe
Jamieson L, Moreno-Garcia CF, Elyan E (2020) Deep learning for text detection and recognition in complex engineering diagrams. In: 2020 International joint conference on neural networks (IJCNN), pp 1–7. https://doi.org/10.1109/IJCNN48605.2020.9207127
Jocher G, Nishimura K, Mineeva T et al (2020) YOLOv5. Code repository. http://github.com/ultralytics/yolov5
Johnson JM, Khoshgoftaar TM (2019) Survey on deep learning with class imbalance. J Big Data 6(1):27
Joy J, Mounsef J (2021) Automation of material takeoff using computer vision. In: 2021 IEEE international conference on industry 4.0, artificial intelligence, and communications technology (IAICT), pp 196–200. https://doi.org/10.1109/IAICT52856.2021.9532514
Kang SO, Lee EB, Baek HK (2019) A digitization and conversion tool for imaged drawings to intelligent piping and instrumentation diagrams P&ID. Energies. https://doi.org/10.3390/en12132593,
Karatzas D, Shafait F, Uchida S et al (2013) ICDAR 2013 robust reading competition. In: 2013 12th International conference on document analysis and recognition, pp 1484–1493
Karatzas D, Gomez-Bigorda L, Nicolaou A et al (2015) Icdar 2015 competition on robust reading. In: 2015 13th International conference on document analysis and recognition (ICDAR), pp 1156–1160. https://doi.org/10.1109/ICDAR.2015.7333942
Khallouli W, Pamie-George R, Kovacic S et al (2022) Leveraging transfer learning and gan models for OCR from engineering documents. In: 2022 IEEE World AI IoT Congress (AIIoT), pp 015–021. https://doi.org/10.1109/AIIoT54504.2022.9817319
Kim H, Kim S, Yu K (2021a) Automatic extraction of indoor spatial information from floor plan image: a patch-based deep learning methodology application on large-scale complex buildings. ISPRS Int J Geo-Inf. https://doi.org/10.3390/ijgi10120828
Kim H, Lee W, Kim M et al (2021b) Deep-learning-based recognition of symbols and texts at an industrially applicable level from images of high-density piping and instrumentation diagrams. Expert Syst Appl 183:115337. https://doi.org/10.1016/j.eswa.2021.115337
Kiryati N, Eldar Y, Bruckstein AM (1991) A probabilistic hough transform. Pattern Recogn 24(4):303–316
Krizhevsky A, Sutskever I, Hinton GE (2012) Imagenet classification with deep convolutional neural networks. In: Pereira F, Burges CJC, Bottou L et al (eds) Advances in neural information processing systems 25. Curran Associates, San Francisco, pp 1097–1105. http://papers.nips.cc/paper/4824-imagenet-classification-with-deep-convolutional-neural-networks.pdf
LeCun Y, Bottou L, Bengio Y et al (1998) Gradient-based learning applied to document recognition. Proc IEEE 86(11):2278–2324
LeCun Y, Bengio Y, Hinton G (2015) Deep learning. Nature 521(7553):436
Li C, Li L, Jiang H et al (2022) Yolov6: a single-stage object detection framework for industrial applications. Comput Vis Pattern Recog. arXiv:2209.02976
Lin TY, Maire M, Belongie S et al (2014) Microsoft coco: common objects in context. In: Fleet D, Pajdla T, Schiele B et al (eds) Computer vision—ECCV 2014. Springer, Cham, pp 740–755
Lin T, Goyal P, Girshick R et al (2017) Focal loss for dense object detection. In: 2017 IEEE international conference on computer vision (ICCV), pp 2999–3007. https://doi.org/10.1109/ICCV.2017.324
Liu W, Anguelov D, Erhan D et al (2015) SSD: single shot multibox detector. CoRR. arXiv:1512.02325
Liu J, Zhong Q, Yuan Y et al (2020) Semitext: scene text detection with semi-supervised learning. Neurocomputing 407:343–353. https://doi.org/10.1016/j.neucom.2020.05.059
Long S, Yao C (2020) Unrealtext: Synthesizing realistic scene text images from the unreal world. CoRR. arXiv:2003.10608
Long J, Shelhamer E, Darrell T (2015) Fully convolutional networks for semantic segmentation. In: 2015 IEEE conference on computer vision and pattern recognition (CVPR), pp 3431–3440. https://doi.org/10.1109/CVPR.2015.7298965
Long S, He X, Yao C (2018) Scene text detection and recognition: the deep learning era. CoRR. arXiv:1811.04256
Lowe DG (2004) Distinctive image features from scale-invariant keypoints. Int J Comput Vis 60(2):91–110
Mafipour MS, Ahmed D, Vilgertshofer S et al (2023) Digitalization of 2D bridge drawings using deep learning models. In: Proceedings of the 30th international conference on intelligent computing in engineering (EG-ICE)
Mani S, Haddad MA, Constantini D et al (2020) Automatic digitization of engineering diagrams using deep learning and graph search. In: 2020 IEEE/CVF conference on computer vision and pattern recognition workshops (CVPRW), pp 673–679
Mishra A, Alahari K, Jawahar C (2012) Scene text recognition using higher order language priors. In: Proceedings of the British machine vision conference. BMVA Press, Guildford, pp 127.1–127.11 https://doi.org/10.5244/C.26.127
Mizanur Rahman S, Bayer J, Dengel A (2021) Graph-based object detection enhancement for symbolic engineering drawings. In: Document analysis and recognition—ICDAR 2021 workshops: Lausanne, Switzerland, 5–10 Sept 2021, proceedings, Part I. Springer, Berlin. pp 74–90. https://doi.org/10.1007/978-3-030-86198-8_6
Moon Y, Lee J, Mun D et al (2021) Deep learning-based method to recognize line objects and flow arrows from image-format piping and instrumentation diagrams for digitization. Appl Sci 11(21):10054
Moreno-Garcia CF, Elyan E (2019) Digitisation of assets from the oil and gas industry: challenges and opportunities. In: 2019 International conference on document analysis and recognition workshops (ICDARW), pp 2–5. https://doi.org/10.1109/ICDARW.2019.60122
Moreno-García CF, Elyan E, Jayne C (2018) New trends on digitisation of complex engineering drawings. Neural Comput Appl. https://doi.org/10.1007/s00521-018-3583-1
Moreno-García CF, Elyan E, Jayne C (2019) New trends on digitisation of complex engineering drawings. Neural Comput Appl 31(6):1695–1712. https://doi.org/10.1007/s00521-018-3583-1
Moreno-García CF, Johnston P, Garkuwa B (2020) Pixel-based layer segmentation of complex engineering drawings using convolutional neural networks. In: 2020 International joint conference on neural networks (IJCNN), pp 1–7. https://doi.org/10.1109/IJCNN48605.2020.9207479
Nguyen T, Pham LV, Nguyen C et al (2021) Object detection and text recognition in large-scale technical drawings. In: Proceedings of the 10th international conference on pattern recognition applications and methods, vol 1: ICPRAM, INSTICC. SciTePress, Setúbal, pp 612–619. https://doi.org/10.5220/0010314406120619
Nurminen JK, Rainio K, Numminen JP et al (2020) Object detection in design diagrams with machine learning. In: Burduk R, Kurzynski M, Wozniak M (eds) Progress in computer recognition systems. Springer, Cham, pp 27–36
Ojala T, Pietikainen M, Maenpaa T (2002) Multiresolution gray-scale and rotation invariant texture classification with local binary patterns. IEEE Trans Pattern Anal Mach Intell 24(7):971–987. https://doi.org/10.1109/TPAMI.2002.1017623
Okazaki A, Kondo T, Mori K et al (1988) An automatic circuit diagram reader with loop-structure-based symbol recognition. IEEE Trans Pattern Anal Mach Intell 10(3):331–341. https://doi.org/10.1109/34.3898
Paliwal S, Jain A, Sharma M et al (2021a) Digitize-PID: automatic digitization of piping and instrumentation diagrams. In: Gupta M, Ramakrishnan G (eds) Trends and applications in knowledge discovery and data mining—PAKDD 2021 Workshops, WSPA, MLMEIN, SDPRA, DARAI, and AI4EPT, Delhi, India, 11 May 2021, proceedings. Lecture notes in computer science, vol 12705. Springer, Berlin, pp 168–180. https://doi.org/10.1007/978-3-030-75015-2_17,
Paliwal S, Sharma M, Vig L (2021b) OSSR-PID: one-shot symbol recognition in P&ID sheets using path sampling and GCN. In: 2021 International joint conference on neural networks (IJCNN), pp 1–8. https://doi.org/10.1109/IJCNN52387.2021.9534122
Pizarro PN, Hitschfeld N, Sipiran I et al (2022) Automatic floor plan analysis and recognition. Autom Constr 140:104348. https://doi.org/10.1016/j.autcon.2022.104348
Prasad D, Gadpal A, Kapadni K et al (2020) Cascadetabnet: An approach for end to end table detection and structure recognition from image-based documents. In: 2020 IEEE/CVF Conference on Computer Vision and Pattern Recognition Workshops (CVPRW), pp 2439–2447, https://doi.org/10.1109/CVPRW50498.2020.00294
Rahul R, Paliwal S, Sharma M et al (2019) Automatic information extraction from piping and instrumentation diagrams. In: Marsico MD, di Baja GS, Fred ALN (eds) Proceedings of the 8th international conference on pattern recognition applications and methods, ICPRAM 2019, Prague, Czech Republic, 19–21 Feb 2019. SciTePress, Setúbal, pp 163–172. https://doi.org/10.5220/0007376401630172
Rantala M, Niemistö H, Karhela T et al (2019) Applying graph matching techniques to enhance reuse of plant design information. Comput Ind 107:81–98
Redmon J, Farhadi A (2017) Yolo9000: better, faster, stronger. In: 2017 IEEE conference on computer vision and pattern recognition (CVPR), pp 6517–6525. https://doi.org/10.1109/CVPR.2017.690
Redmon J, Farhadi A (2018) Yolov3: an incremental improvement. CoRR. arXiv:1804.02767
Redmon J, Divvala S, Girshick R et al (2016) You only look once: unified, real-time object detection. In: Proceedings of the IEEE conference on computer vision and pattern recognition, pp 779–788
Ren S, He K, Girshick R et al (2015) Faster R-CNN: Towards real-time object detection with region proposal networks. In: Proceedings of the 28th international conference on neural information processing systems, NIPS’15, vol 1. MIT, Cambridge, pp 91–99. http://dl.acm.org/citation.cfm?id=2969239.2969250
Ren P, Xiao Y, Chang X et al (2021) A survey of deep active learning. ACM Comput Surv. https://doi.org/10.1145/3472291
Renton G, Héroux P, Gaüzère B et al (2019) Graph neural network for symbol detection on document images. In: 2019 International conference on document analysis and recognition workshops (ICDARW), pp 62–67. https://doi.org/10.1109/ICDARW.2019.00016
Renton G, Balcilar M, Héroux P et al (2021) Symbols detection and classification using graph neural networks. Pattern Recogn Lett 152:391–397. https://doi.org/10.1016/j.patrec.2021.09.020
Rezvanifar A, Cote M, Albu AB (2020) Symbol spotting on digital architectural floor plans using a deep learning-based framework. In: 2020 IEEE/CVF conference on computer vision and pattern recognition workshops (CVPRW), pp 2419–2428. https://doi.org/10.1109/CVPRW50498.2020.00292
Rica E, Moreno-García CF, Álvarez S et al (2020) Reducing human effort in engineering drawing validation. Comput Ind 117:103198. https://doi.org/10.1016/j.compind.2020.103198
Rica E, Álvarez S, Serratosa F (2021) Group of components detection in engineering drawings based on graph matching. Eng Appl Artif Intell 104:104404. https://doi.org/10.1016/j.engappai.2021.104404
Rumalshan OR, Weerasinghe P, Shaheer M et al (2023) Transfer learning approach for railway technical map (RTM) component identification. In: Proceedings of 7th international congress on information and communication technology, Springer, pp 479–488
Russakovsky O, Deng J, Su H et al (2015) Imagenet large scale visual recognition challenge. Int J Comput Vis (IJCV) 115(3):211–252. https://doi.org/10.1007/s11263-015-0816-y
Russell BC, Torralba A, Murphy KP et al (2008) Labelme: a database and web-based tool for image annotation. Int J Comput Vis 77(1):157–173
Sarkar S, Pandey P, Kar S (2022) Automatic detection and classification of symbols in engineering drawings. Comput Vis Pattern Recogn. https://doi.org/10.48550/arxiv.2204.13277,
Scheibel B, Mangler J, Rinderle-Ma S (2021) Extraction of dimension requirements from engineering drawings for supporting quality control in production processes. Comput Ind 129:103442. https://doi.org/10.1016/j.compind.2021.103442
Shi B, Bai X, Belongie S (2017a) Detecting oriented text in natural images by linking segments. In: 2017 IEEE conference on computer vision and pattern recognition (CVPR), pp 3482–3490. https://doi.org/10.1109/CVPR.2017.371
Shi B, Bai X, Yao C (2017) An end-to-end trainable neural network for image-based sequence recognition and its application to scene text recognition. IEEE Trans Pattern Anal Mach Intell 39(11):2298–2304. https://doi.org/10.1109/TPAMI.2016.2646371
Sierla S, Azangoo M, Fay A et al (2020) Integrating 2D and 3D digital plant information towards automatic generation of digital twins. In: 2020 IEEE 29th international symposium on industrial electronics (ISIE), pp 460–467. https://doi.org/10.1109/ISIE45063.2020.9152371
Sierla S, Azangoo M, Rainio K et al (2021) Roadmap to semi-automatic generation of digital twins for brownfield process plants. J Ind Inf Integr. https://doi.org/10.1016/j.jii.2021.100282
Sinha A, Bayer J, Bukhari SS (2019) Table localization and field value extraction in piping and instrumentation diagram images. In: 2019 International Conference on Document Analysis and Recognition Workshops (ICDARW), pp 26–31, https://doi.org/10.1109/ICDARW.2019.00010
Smith R (2007) An overview of the tesseract OCR engine. In: 9th International conference on document analysis and recognition (ICDAR 2007). IEEE, pp 629–633
Stinner F, Wiecek M, Baranski M et al (2021) Automatic digital twin data model generation of building energy systems from piping and instrumentation diagrams. Comput Vis Pattern Recogn. arXiv:2108.13912
Szegedy C, Vanhoucke V, Ioffe S et al (2015) Rethinking the inception architecture for computer vision. CoRR. arXiv:1512.00567
Theisen MF, Flores KN, Schulze Balhorn L et al (2023) Digitization of chemical process flow diagrams using deep convolutional neural networks. Digit Chem Eng 6:100072. https://doi.org/10.1016/j.dche.2022.100072
Tian Z, Huang W, He T et al (2016) Detecting text in natural image with connectionist text proposal network. CoRR. arXiv:1609.03605
Toral L, Moreno-García CF, Elyan E et al (2021) A deep learning digitisation framework to mark up corrosion circuits in piping and instrumentation diagrams. In: Barney Smith EH, Pal U (eds) Document analysis and recognition—ICDAR 2021 workshops. Springer, Cham, pp 268–276
Uijlings JR, Van De Sande KE, Gevers T et al (2013) Selective search for object recognition. Int J Comput Vis 104(2):154–171
Van Engelen JE, Hoos HH (2020) A survey on semi-supervised learning. Mach Learn 109(2):373–440
Veit A, Matera T, Neumann L et al (2016) Coco-text: Dataset and benchmark for text detection and recognition in natural images. arXiv:1601.07140
Vilgertshofer S, Stoitchkov D, Borrmann A et al (2019) Recognising railway infrastructure elements in videos and drawings using neural networks. Proc Inst Civ Eng Smart Infrastruct Constr 172(1):19–33. https://doi.org/10.1680/jsmic.19.00017
Viola P, Jones M (2001) Rapid object detection using a boosted cascade of simple features. In: Proceedings of the 2001 IEEE computer society conference on computer vision and pattern recognition. CVPR 2001, pp I–I. https://doi.org/10.1109/CVPR.2001.990517
Wang Y, Sun Y, Liu Z et al (2018) Dynamic graph CNN for learning on point clouds. CoRR. arXiv:1801.07829
Wang CY, Bochkovskiy A, Liao HYM (2022) Yolov7: trainable bag-of-freebies sets new state-of-the-art for real-time object detectors. arXiv:2207.02696
Wen R, Tang W, Su Z (2017a) Measuring 3D process plant model similarity based on topological relationship distribution. Computer Aid Des Appl 14(4):422–435
Wen R, Tang W, Su Z (2017b) Topology based 2D engineering drawing and 3d model matching for process plant. Graph Models 92:1–15. https://doi.org/10.1016/j.gmod.2017.06.001
Xie L, Lu Y, Furuhata T et al (2022) Graph neural network-enabled manufacturing method classification from engineering drawings. Comput Ind 142(103):697. https://doi.org/10.1016/j.compind.2022.103697
Ye Q, Doermann D (2015) Text detection and recognition in imagery: a survey. IEEE Trans Pattern Anal Mach Intell 37(7):1480–1500. https://doi.org/10.1109/TPAMI.2014.2366765
Yu ES, Cha JM, Lee T et al (2019) Features recognition from piping and instrumentation diagrams in image format using a deep learning network. Energies. https://doi.org/10.3390/en12234425
Yun DY, Seo SK, Zahid U et al (2020) Deep neural network for automatic image recognition of engineering diagrams. Appl Sci. https://doi.org/10.3390/app10114005
Zhang F, Zhai G, Li M et al (2020) Three-branch and mutil-scale learning for fine-grained image recognition (TBMSL-NET). CoRR. arXiv:2003.09150
Zhang D, Han J, Cheng G et al (2022) Weakly supervised object localization and detection: a survey. IEEE Trans Pattern Anal Mach Intell 44(9):5866–5885. https://doi.org/10.1109/TPAMI.2021.3074313
Zhao Y, Deng X, Lai H (2020) A deep learning-based method to detect components from scanned structural drawings for reconstructing 3D models. Appl Sci. https://doi.org/10.3390/app10062066
Zheng Z, Li J, Zhu L et al (2022) GAT-CADNet: graph attention network for panoptic symbol spotting in CAD drawings. In: Proceedings of the IEEE/CVF conference on computer vision and pattern recognition, pp 11747–11756
Zhou X, Yao C, Wen H et al (2017) EAST: an efficient and accurate scene text detector. CoRR. arXiv:1704.03155
Zhu JY, Park T, Isola P et al (2017) Unpaired image-to-image translation using cycle-consistent adversarial networks. In: Proceedings of the IEEE international conference on computer vision, pp 2223–2232
Ziran Z, Marinai S (2018) Object detection in floor plan images. In: Pancioni L, Schwenker F, Trentin E (eds) Artificial neural networks in pattern recognition. Springer, Cham, pp 383–394
Acknowledgements
We would like to thank TaksoAI for providing the engineering diagrams, through a related project.
Author information
Authors and Affiliations
Contributions
L.J., C.F.M.G. and E.E. all contributed to this paper.
Corresponding author
Ethics declarations
Competing interests
The authors have no competing interests to declare that are relevant to the content of this article.
Additional information
Publisher's Note
Springer Nature remains neutral with regard to jurisdictional claims in published maps and institutional affiliations.
Rights and permissions
Open Access This article is licensed under a Creative Commons Attribution 4.0 International License, which permits use, sharing, adaptation, distribution and reproduction in any medium or format, as long as you give appropriate credit to the original author(s) and the source, provide a link to the Creative Commons licence, and indicate if changes were made. The images or other third party material in this article are included in the article's Creative Commons licence, unless indicated otherwise in a credit line to the material. If material is not included in the article's Creative Commons licence and your intended use is not permitted by statutory regulation or exceeds the permitted use, you will need to obtain permission directly from the copyright holder. To view a copy of this licence, visit http://creativecommons.org/licenses/by/4.0/.
About this article

Cite this article
Jamieson, L., Francisco Moreno-García, C. & Elyan, E. A review of deep learning methods for digitisation of complex documents and engineering diagrams. Artif Intell Rev 57, 136 (2024). https://doi.org/10.1007/s10462-024-10779-2
Accepted:
Published:
DOI: https://doi.org/10.1007/s10462-024-10779-2