
Abstract
Temporal variations in magma discharge rates on Iceland’s neovolcanic rift zones have been associated with deglaciation. We have used tephrochronological and stratigraphic dating of 175 separate eruptive units to estimate volumetric output and reconstruct eruption rates in the Askja region over the postglacial period. We have identified 14 tephra layers that can be used as time marker horizons in the near vicinity of Askja, including the Vatnaöldur (871 ± 2 AD) tephra which has not previously been reported in surface cover profiles in this region. Our improved tephrochronological resolution indicates that, over the past c. 1,500 years, Askja has been significantly more active than has previously been recognised. A minimum of 39 km3 of basaltic magma has been erupted at Askja since the area became ice-free at around 10.3 ka. The absence of the 7.2 ka Hekla 5 tephra from the Askja region suggests that all postglacial lavas now exposed at the surface are younger than 7.2 ka. Time-averaged magma discharge rates at Askja were highest between 7.2 and 4.3 ka. However, the available tephrochronological resolution is not sufficient to resolve any peak in volcanic activity following deglaciation.
Introduction
Numerous studies have examined the relationship between volcanism and glacial cycles, both on local and global scales (e.g. Rampino et al. 1979; Nakada and Yokose 1992; Jellinek et al. 2004; Huybers and Langmuir 2009; Watt et al. 2013 and references therein). It has been estimated that global subaerial volcanic activity increased by a factor of 2–6 between 12 and 7 ka, due to enhanced eruption rates in deglaciating regions (Huybers and Langmuir 2009). The clearest demonstration of increased volcanism following a period of rapid deglaciation is observed in Iceland (e.g. Slater et al. 1998; Maclennan et al. 2002; Sinton et al. 2005); similar effects have been documented in continental Europe (Nowell et al. 2006); eastern California (Jellinek et al. 2004); and, to a lesser extent, at volcanic arcs including the southern Chilean, Cascade and Kamchatka arcs (Watt et al. 2013). An expected corollary of subaerial deglaciation is decreased magmatic productivity at ocean ridges due to the additional loading associated with rising sea levels. There is considerable interest in the feedbacks between subaerial and submarine CO2 emissions and glacial cycles: recent papers have proposed that pulsing of ocean ridge magma productivity, and hence CO2 emissions, may feed back into climate cycles and possibly contribute to the abrupt ending of ice ages on a 100-kyr timescale (Burley and Katz 2015; Crowley et al. 2015; Olive et al. 2015; Tolstoy 2015).
Variations in magma discharge rate across Iceland’s neovolcanic zones over the past 10 kyr, and high magma discharge rates in specific volcanic systems or volcanic zones around 12–10 ka, coincide with the final phase of ice retreat following the last glacial maximum. Mantle melt production rates and magma surface discharge rates within Theistareykir and Krafla volcanic systems in Iceland’s Northern Volcanic Zone (NVZ) have been inferred to be up to 100 times higher at 12–10 ka than in the past 5 kyr (Slater et al. 1998; Maclennan et al. 2002). In the Western Volcanic Zone (WVZ), high magma production and discharge rates of >32 km3/kyr at c.12 ka have declined steadily to <2 km3/kyr at the present day (Sinton et al. 2005).
Iceland’s high magma discharge in the early Holocene has been linked to rapid deglaciation. Two contrasting models have been proposed to explain this feedback. Firstly, mantle decompression in response to glacial unloading results in increased mantle melt production (Jull and McKenzie 1996), leading in turn to increased magma discharge by way of volcanic eruptions. Secondly, stress fields generated in response to rapid uplift and bending of the crust following deglaciation may permit the opening of new crustal fractures, thereby tapping a greater number of pre-existing crustal magma chambers and resulting in increased volcanism at the surface (Gudmundsson 1986). While Iceland’s early postglacial lavas are compositionally variable with a wide range of MgO contents, various studies have documented that at a given MgO content, early postglacial lavas have lower concentrations of incompatible elements than glacial-age (>12 ka) or recent (<2 ka) eruptions (Hardarson and Fitton 1991; Slater et al. 1998; Maclennan et al. 2002; Sinton et al. 2005). This pattern is consistent with increased melt generation in the mantle following glacial unloading. Depleted geochemical signatures are also present in late glacial eruptive units (∼11.7–10.5 ka) from the WVZ, which may indicate that melt generation and volcanic productivity peaked after the onset of deglaciation but before ice removal was complete (Eason et al. 2015). In contrast, Gee et al. (1998) argued that the geochemical variations observed at Theistareykir and on the Reykjanes Peninsula were best explained by processes of crystallisation, assimilation and mixing in magma chambers, with incompatible element-depleted early postglacial compositions reflecting decreased magma residence times in the crust.
At Askja volcano, north Iceland, Sigvaldason et al. (1992) estimated that magma production in the period 10.0–4.5 ka was at least 20 to 30 times higher than over the past ∼2.9 kyr. They attributed this to the release of stored melts in the crust in response to decreased lithostatic pressure and/or the opening of new crustal fractures. However, the temporal resolution of this postulated early postglacial peak in productivity is very poor. It is therefore not known whether the Askja region experienced a short, high-intensity peak in magma discharge in the ∼1,000 years following deglaciation in a similar manner to Theistareykir (Maclennan et al. 2002), or a gradual but steady decline in magma discharge over the postglacial period similar to the WVZ (Sinton et al. 2005).
Here we present the results of a new study of postglacial erupted products from the Askja region. Our study area extends from Askja central volcano to the furthest reaches of Askja’s southern, eastern and northern lava aprons. We have been able to map the outcrop extent of lava flows in greater detail than previous studies. By estimating the original erupted volumes of these flows, we determine the minimum volumetric output of the Askja region over the postglacial period. We present a refined eruption chronology for the Askja region based on detailed logging and geochemical analysis of tephra layers in surface cover profiles. Our new data are used to improve the resolution of changes to Askja’s magmatic productivity over the postglacial period, and to reassess the link between volcanism and deglaciation in the Askja region.
The Askja volcanic system
Askja volcanic system is the longest of five volcanic systems in Iceland’s Northern Volcanic Zone, extending over 200 km from beneath Vatnajökull glacier to the northern coastline. Askja central volcano, also known as the Dyngjufjöll volcanic centre, is located near the southern end of the volcanic system. The Askja volcanic edifice primarily comprises Pleistocene glaciovolcanic tuffs, hyaloclastites, pillow basalts and intercalated subaerial lavas (e.g. Graettinger et al. 2013), overlain by Holocene subaerial lavas and pumice from an explosive, rhyolitic eruption on 28–29 March 1875. Askja is crowned by a complex of at least three nested calderas, the youngest of which formed over a period of 40–50 years following the 1875 eruption (Hartley and Thordarson 2012) and is now filled by lake Öskjuvatn.
The 28–29 March 1875 eruption is the oldest event at Askja whose age is known with certainty. Tephra from this eruption has been the subject of numerous studies examining its stratigraphy and physical characteristics (Sparks et al. 1981; Carey et al. 2008a, b), dispersal (Carey et al. 2010) and composition (Sigvaldason 1979; Sigurdsson and Sparks 1981; Macdonald et al. 1987). Askja has produced at least two other explosive rhyolitic eruptions the Holocene period. Tephra from the ∼10 ka Skolli eruption is found in several locations in and around Askja central volcano, where primary deposits are 45–260 cm thick (Sigvaldason 2002). Tephra from an eruption at ∼2.1 ka, found in peat bogs across Scotland and Sweden (Dugmore et al. 1995; Wastegård and Boygle 2012) is also thought to be associated with Askja, although no deposits of the same age and composition have yet been found at Askja central volcano. The volume of rhyolitic tephra erupted in 1875 has been determined as 0.3 km3 dense rock equivalent (DRE; Carey et al. 2010). The volumes of the ∼10 and ∼2.1 ka eruptions are not well constrained, but the collective volume of Holocene silicic volcanism at Askja is likely not more than 0.5 to 0.7 km3 DRE. With the exception of these explosive rhyolitic eruptions, postglacial activity on the Askja volcanic system has been dominated by effusive basaltic volcanism. Since the settlement of Iceland in the early ninth century several reports of eruptions in the region have been recorded in historical archives (e.g. Jónsson 1945), although the precise locations of the vents are not specified due to the remoteness of the area.
Postglacial lavas partially fill the Askja caldera, and drape Askja’s flanks forming extensive lava aprons to the south, east and north of the central volcano. Four lava shields (Litladyngja, Svartadyngja, Flatadyngja, Kollóttadyngja), each representing several cubic kilometres of lava, are located northeast of the central volcano. Numerous small fissures and scoria cones are found across the region. Activity within Askja caldera has included both effusive eruptions along caldera ring fractures and short fissures located on the western margin of the caldera, and at least two explosive phreatomagmatic eruptions that formed thick tuff sequences which crop out in the walls of Askja and Öskjuvatn calderas (Hartley and Thordarson 2013). At least seven small-volume basaltic eruptions occurred along ring fractures of Öskjuvatn caldera between c.1910 and c.1930. The most recent eruption occurred in 1961 (Thórarinsson and Sigvaldason 1962).
Surface cover in the Askja region is primarily a partial, patchy cover of sandy sediment deposited following aeolian and/or meltwater transport. The eastern part of Askja caldera and the eastern lava apron are covered by rhyolitic tephra from the 1875 eruption, which is up to 5 m thick near the margins of Öskjuvatn caldera, and up to 0.5 m thick near Herðubreiðartögl, ∼15 km ENE of Öskjuvatn. The southern margins of Askja’s southern lava apron lie in the outwash plains of Dyngjujökull glacier, and are covered by thick glacial outwash deposits.
Field work and analytical methods
Mapping and stratigraphic relations
Previous mapping in the Askja region utilised both aerial photographs and field studies to identify lava flow boundaries (Annertz et al. 1985; Sigvaldason et al. 1992). We employed a similar methodology, first identifying flow field boundaries by stereoscopic inspection of aerial photographs and SPOT satellite images, and then verifying these interpretations in the field. Lava flow field boundaries were identified by steep steps in topography that mark the perimeters of flow fields; differences in flow morphology or surface cover distribution; and, in the field, by differences in the colour or phenocryst content of fresh lava surfaces.
Our field investigations made only minor changes to previously identified lava flow field boundaries. However, we have been able to trace flow field boundaries at much higher resolution than previous studies, and also to extend significantly the mapped area, which now includes the furthest reaches of Askja’s eastern, northern and southern lava aprons.
Calculation of lava flow areas and volumes
The youngest lavas exposed on Askja’s eastern and southern lava aprons have approximately constant widths, and high length:width ratios, as is seen in the southern branch of the 1924–1929 AD Thorvaldshraun lava (length/width ratio 1:6.5) and in the 1961 AD Vikrahraun lava past the point where it ceased to be constrained by the boundaries of the Öskjuop (length:width ratio 1:5.5). For older lavas where the flow boundaries are obscured near the vents, we therefore assumed a basic flow geometry of long, thin lava flows extending from their source vents to the edges of the flow lobes identified in the field. Effusive eruptions at central volcanoes often occur on short ring fracture segments or radial fissures (Thordarson and Larsen 2007), so younger eruptions are likely to reactivate older fissures or to form new fissures only a short distance from older eruptive vents. The fissure eruption at Holuhraun in 2014–2015 also reactivated a fissure that had erupted twice before (e.g. Sigmundsson et al. 2015), which indicates that it is possible for long-lived vent sites to exist even out on the fissure swarm. For each lava, the most probable source vent was identified by tracing the flow back to the position of the eruptive vent or fissure of the youngest lava with a similar flow direction. The above constraints were used to reconstruct estimated areal extents of individual lava flows on the Askja lava aprons. ArcGIS software was used to measure the area covered by each reconstructed lava flow.
Flow areas were multiplied by an appropriate flow thickness to obtain the erupted volume. Where possible, flow thicknesses were estimated from field observations; however, this is not trivial since lavas are expected to thin systematically from the vent towards the edge. For example, the 2014–2015 lava at Holuhraun has an average thickness of ∼19 m (e.g. Gíslason et al. 2015), but is over 40 m thick near the vents and 5–10 m thick at its edges. Similarly the Thorvaldshraun lava is at least 5–6 m thick at its edges, and is expected to be at least 10 m thick at the eruptive fissure (Hartley and Thordarson 2012). The oldest and largest postglacial flow on Askja’s eastern lava apron is 5–7 m thick near its edge, where it is exposed in a small gorge near Upptyppingar mountain (65.02928°N 16.29632°W), but the base of the lava is not exposed and the flow top has been removed by erosion. The true thickness of this lava may thus have been 10 m or more at the flow edge, and significantly thicker nearer the source vent. There are no fully exposed cross-sections of typical Askja lavas from which to estimate an average flow thickness. For the purpose of this study, we have therefore assumed an average thickness of 10 m for postglacial lavas on Askja’s lava aprons, and 5–8 m for lavas in the Askja caldera, which cover smaller areas than eruptions on the lava aprons. These assumptions are likely to underestimate the volumes of the largest eruptions on the lava aprons, but overestimate the volumes of smaller eruptions.
Dating of lavas
Well-dated tephra layers from several of Iceland’s major volcanoes form readily identifiable layers in surface cover profiles. The tephra stratigraphy within the regolith overlying the lava thus establishes its minimum age. Here we use tephrochronology to date lava flows across the Askja region, by obtaining detailed logs of surface cover profiles and identifying both primary tephra layers and reworked tephra-rich horizons. Wherever possible, samples of these tephra layers were obtained for geochemical analysis.
Previous studies recognised seven distinctive tephra layers in surface cover profiles in the Askja region (Annertz et al. 1985; Sigvaldason et al. 1992), which are summarised in Table 1 and Fig. 1. The ages of four of these tephra layers are known precisely from historical records; the remaining three have been dated by 14C in soil profiles both in Iceland and further afield (Table 1). The Veiðivötn 1477 and Öræfajökull 1362 tephras have distinct macroscopic characteristics which aids their identification in the field. The Veiðivötn 1477 tephra is up to 10 cm thick in the Askja region (Fig. 1) and is relatively fine grained, consisting of brown vitreous, angular particles; thicker deposits may exhibit differently coloured horizons ranging from greyish brown to blue-black. The Öræfajökull 1362 tephra is typically ∼1 cm thick in the Askja region (Fig. 1), and is yellowy white in colour with platy grains. The Hekla 3, Hekla 4, Hekla 1104 and Hekla 1158 tephras are similar in appearance (e.g. Larsen and Thorarinsson 1977), but can be distinguished from one another by stratigraphic position and by geochemical analysis (Larsen et al. 1999; Meara 2012). The rhyolitic tephra labelled the ‘x layer’ by Sigvaldason et al. (1992) is compositionally similar to erupted products from Snæfellsjökull (Hayward and Thordarson, unpublished data), and its age and stratigraphic position suggest that it may correspond to the ∼4 ka Sn-2 tephra (Wastegård et al. 2009).

Isopach maps of distinctive tephra layers that may be used as tephrochronological marker horizons in the Askja region. On each map, Askja central volcano is marked by a red triangle. Isopach maps have been modified after Thórarinsson (1958, 1967, 1976); Thórarinsson et al. (1960); Larsen (1984, 1992); Jóhannesson et al. (1981). Isopach thicknesses are given in centimetres. The Sn-2 tephra has not been mapped outside the Snæfellsjökull peninsula
These seven tephra layers, alongside new marker tephras identified in this study (see Discussion), were used to establish minimum ages for lava flows across the Askja region. Throughout this study, ages are reported in calendar years before 2000. All 14C ages have been converted to calendar years using the IntCal13 scheme of Reimer et al. (2013).
Surface cover in the Askja region is prone to aeolian or fluvial reworking, and the preservation potential of primary tephra deposits is low. It is rare to find surface cover profiles containing a complete tephra stratigraphy, and it is not uncommon to find profiles that preserve no tephra horizons. Many lavas in the Askja region therefore cannot be dated by tephrochronology alone, although it is possible to establish the relative ages of these lavas by examining their stratigraphic relations to dated lavas.
Electron microprobe analysis
Samples from primary tephra layers and reworked tephra-rich horizons were sieved to remove the <125-μm size fraction and then washed with distilled water. Vitreous grains from each sample were hand-picked under a binocular microscope, mounted in epoxy discs and polished for analysis. Major and minor element concentrations of the glassy tephra fragments were measured by WDS Cameca SX100 electron microprobe (EPMA) at the University of Edinburgh using the analytical conditions described by Hayward (2012), which are optimised for rapid, high-resolution analysis of silicate glasses with minimal beam damage to the sample. Between 10 and 40 measurements were made on each sample.
Results
Identification of primary tephra layers
We logged a total of 65 surface cover profiles in the Askja region (Table 2). Three profiles contained no discernible tephra horizons, and a further 12 profiles contained no tephra layers except the Askja 1875 tephra at the top of the profile. A total of 2,418 EPMA analyses were obtained for 151 unique samples from the remaining 50 profiles.
We used the criteria outlined by Óladóttir et al. (2011b) to distinguish primary tephra layers from reworked tephra horizons. In particular, primary tephra layers are expected to be compositionally homogeneous, whereby the standard deviation is <10 % of the average composition. Heterogeneous compositions may indicate either contamination by surrounding material during sampling; reworked material within the horizon; or deposition of tephra from near-contemporaneous eruptions on two or more volcanic systems.
Of the 151 samples analysed, 103 were compositionally homogeneous and met the criteria for pristine, primary tephra. Forty-eight samples did not meet the criterion of compositional homogeneity. Twelve of these 48 samples featured up to three analyses with outlier compositions, but the remaining 12–35 analyses in individual samples revealed homogeneous compositions. Seven of the 48 samples had strongly bimodal or trimodal compositions, with each sub-population being internally homogeneous. These samples were interpreted as mixtures of two or three distinct tephra layers. The remaining 29 samples contained clasts with a wide variety of compositions, and were interpreted as reworked material. In three surface cover profiles, all of the tephras sampled were deemed to be reworked.
Geochemical fingerprinting of primary tephras
Electron microprobe analysis was used to determine the provenance of the tephra layers found in the surface cover profiles. We used EPMA data from the literature to establish reference compositional fields (RCF) for erupted products from Askja, Grímsvötn, Bárðarbunga-Veiðivötn, Kverkfjöll, Katla, Öræfajökull, Snæfellsjökull and Hekla volcanoes (Fig. 2). These RCFs formed the basis for determining the geochemical ‘fingerprint’ of each unknown tephra, enabling us to identify its source volcano. We also established RCFs for Krafla, Eyjafjallajökull, Tindfjöll, Torfajökull and Vestmannaeyjar, but none of the unknown tephra layers had compositions similar to the erupted products of these volcanoes.

Bivariate plots showing the major element reference compositional fields (RCF) used as the basis for geochemical fingerprinting of tephra. a–c RCF for basaltic tephra from Askja, Grímsvötn, Bárðarbunga-Veiðivötn, Kverkfjöll and Katla volcanic systems. d–e RCF for rhyolitic tephra from Askja, Hekla, Öræfajökull and Snæfellsjökull. f RCF for different Hekla tephras. Dashed lines show the evolution of the H3 and H4 tephras from their initial rhyolitic compositions (solid lines) through to dacite and basaltic andesite. For all plots, symbols show EPMA analyses of tephra layers in surface cover profiles analysed during this study. EPMA data used to construct RCFs were taken from Boygle (1994); Larsen et al. (1999); Óladóttir et al. (2008, 2011a, b); Hartley and Thordarson (2013); Jude-Eton (2013); Meara (2012); T. Thordarson (unpublished data)
Most of the basaltic tephras analysed were tholeiitic, with geochemical affinities for Askja or Bárðarbunga-Veiðivötn (Fig. 2a). The products of these volcanic systems are very similar in composition, but can be distinguished on the basis of K2O vs. Mg# or TiO2 (Fig. 2b, c). Several tephras originating from Grímsvötn volcano were also identified, as were two alkaline tephras from Katla. Most of the rhyolitic tephras analysed originated from Hekla (Fig. 2d–f). The Hekla 3 and Hekla 1104 tephras are very similar in composition (Fig. 2f), but can usually be distinguished from one another on the basis of tephra stratigraphy within the surface cover profile. We did not identify tephra from the Hekla 5 eruption anywhere within the study area. This is consistent with previous studies which have found Hekla 5 tephra in soil profiles at locations just outside the study area along the periphery of the Vatnajökull ice cap but not within the Askja region itself (Óladóttir et al. 2011a).
In addition to the seven marker tephras known to be present in the Askja region (Annertz et al. 1985; Sigvaldason et al. 1992), we were able to identify seven new tephra layers of known (i.e. historical) age that can be used as time marker horizons in surface cover profiles.
Age distribution of lavas in the Askja region
Our results are summarised in Fig. 3, which provides a map of the postglacial lava flows in the Askja region and their ages as determined by a combination of tephrochronological and stratigraphic dating. For areas where the surface cover profiles from this study were insufficient to establish lava flow ages, we have adopted the ages determined by Sigvaldason et al. (1992). This principally applies to the lavas in the Sn-2 age bracket, in the north-western sector of the region. Shape files for postglacial lava flow boundaries, lava shields, and hyaloclastites in the study area are provided as Electronic supplementary material (ESM).

Summary map showing postglacial lava flow boundaries in the Askja region, with lavas coloured by tephrochronological age. Hyaloclastite mountains are shown in beige shading. Lava shields are indicated by dashed lines radiating outwards from the locations of their summit craters. Black and red symbols show the locations of surface cover profiles measured in this study (Table 2). The boxes with dashed outlines divide the study area into four geographical sub-regions, as mentioned in the text. Volcanic systems are shaded in light blue and outlined by dashed blue lines. Prominent regional landmarks including Herðubreið mountain, Vaðalda interglacial lava shield and the 2014–2015 Holuhraun lava are also shown
We identified a total of 175 individual eruptive units, which makes the Askja volcanic system one of the five most active systems in Iceland in terms of number of eruptions during the Holocene (e.g. Thordarson and Larsen 2007; Thordarson and Höskuldsson 2008). More importantly, this number represents the minimum number of postglacial eruptions to have occurred in the region, for the following reasons: (1) The oldest and largest postglacial lavas that crop out in the region terminate in a glacial outwash plain (Fig. 3). An unknown number of older, larger lavas may be completely buried by thick surface cover and/or younger lava flows and are thus unaccounted for. (2) Some lava flow field boundaries are likely to be obscured by surface cover, leading to an underestimation of the total number of flows and a corresponding overestimation of the area of some flows. (3) Small lava flow fields that have been completely covered by younger flows are not accounted for. The number and total volume of missing flow fields is expected to decrease with age (assuming a higher probability of burial with increasing age), but there is no practical way to assess the number of buried flows. (4) The numerous small-volume (≪0.001 km3) postglacial scoria cones and lava flows in the region are not included in this total.
The absence of pre-Hekla 5 lavas at Askja implies that at least 3,000 years’ worth of Holocene erupted products are no longer exposed at the surface. The 175 eruptions identified since 7.2 ka imply an average repose interval of 24 years between individual eruptive events in the Askja region. If Askja maintained this level of activity throughout the postglacial period then an additional 75–100 eruptions may have occurred in the 3–4 kyr after deglaciation, bringing the total number of postglacial eruptions to around 250. This is comparable with number of postglacial eruptions at Hekla (200–300), Katla (250–400) and Bárðarbunga-Veiðivötn (∼200), although significantly lower than the number of eruptions at Grímsvötn (Óladóttir et al. 2008; 2011a; Thordarson and Höskuldsson 2008).
Postglacial magmatic output at Askja
Erupted volumes for tephrochronological age brackets were obtained by summing the calculated volumes of individual eruptions within each age bracket. The total erupted volume for the Askja region is given in Table 3. We also report the volumes erupted within five sub-categories of the study area: Askja caldera; the eastern, southern and northern lava aprons; and the lava shields. The total volume of postglacial lava erupted in the Askja region was calculated to be 39.0 km3. This is in excellent agreement with the 40.0 km3 estimated by Sigvaldason et al. (1992). These figures should be regarded as minimum estimates of Askja’s postglacial volumetric output, since lavas that have been either entirely covered by younger flows or obscured by thick surface cover are unaccounted for in these totals; these figures also exclude the intracaldera lava pile within Askja caldera.
Geometric constraints on erupted volumes
Simple geometric calculations can be used to provide an external check on the erupted volumes determined by summing the volumes of individual lava flows. For example, the lavas covering the floor of Askja caldera could be regarded as a ∼150° sector of a cone-shaped polygenetic shield, with lavas radiating outwards from the vents and fissures in the northwest of the Askja caldera (Figs. 3 and 4). The elevation at these source vents is 1,210–1,220 m a.s.l. The lava flows dated as younger than Hekla 1158 extend 4 km from these vents, and have an average elevation of 1100 m at their eastern edge. Assuming a horizontal base, the shield sector thus has a maximum thickness of 110–120 m and a volume of 0.77–0.84 km3. Although this calculation greatly simplifies the geometry of the intracaldera lava pile, the volume obtained is in good agreement with the volume of 0.76 km3 obtained by summing the volumes of individual lavas younger than Hekla 1158 (Fig. 3 and Table 3).

Schematic cross-sections illustrating the possible subsurface structure of the Öskjuop. Lines of section are shown on Fig. 3. Note the vertical exaggeration. a Cross-section A–B–C from the western edge of Askja caldera running parallel to the Öskjuop. b Cross-section X–Y, running perpendicular to the Öskjuop bounding faults
Similarly, Askja’s eastern lava apron can be regarded as a ∼70° sector of a polygenetic shield extending from the eastern end of the Öskjuop (elevation 930 m) to the southern tip of Herðubreiðartögl (elevation 630 m), with a radial distance of 11 km (Fig. 3). The volume of this shield sector is 7.39 km, which is in good agreement with the volume of 7.7 km3 for Askja’s eastern lava apron given in Table 3. This lends credence to the approach used to estimate the areas and thicknesses of individual lava flows in the Askja region, and suggests that the erupted volumes given in Table 3 are reasonable.
Volume of postglacial intracaldera lavas
The postglacial intracaldera lava pile in Askja caldera is estimated to be 300–500 m thick (Fig. 4), and is underlain by hyaloclastite (Brown et al. 1991). Assuming a constant cross-sectional area of 33 km2 for Askja’s intracaldera lava fill, the postglacial lava pile has an estimated volume of 9.9–16.5 km3 (Table 3).
The uppermost ∼110 m of the caldera fill comprises lavas younger than 1158 AD, with volume ∼0.76 km3 (Fig. 3). Below this is at least 60 m of fresh, unaltered lava flows, which are exposed in the northern and western walls of Öskjuvatn caldera. Tephra stratigraphy in surface cover profile 29-08-06 (Fig. 5) indicates that the uppermost of these lavas is not much older than 1158 AD, and is younger than 871 AD. We therefore infer that 20–60 m of lava, with corresponding volume 0.65–2.0 km3, could fall within the pre-Hekla 1158 to post-Vatnaöldur 871 AD age bracket, i.e. historic lavas erupted since the settlement of Iceland. The remainder of the caldera fill sequence would then be prehistoric.

Surface cover profiles showing tephra layers found on lavas within Askja caldera. Coloured intervals are tephra layers, with the colour approximating the colour of the layer in the field. Interpretation of the source volcano is given to the right of each profile: A, Askja; G, Grímsvötn; V, Bárðarbunga-Veiðivötn; H, Hekla; Ö, Öræfajökull; K, Katla. Layers marked rw are interpreted as being reworked
Although the age distribution of the prehistoric intracaldera lavas is unspecified, a brief discussion of the age and depth of the Öskjuop (Fig. 4) provides some insights into the possible thickness of pre- and post-Hekla 4 lavas. Öskjuop is an east–west-trending pass through the hyaloclastite mountains on the northeast side of Askja caldera (Fig. 3). Its northern edge is bounded by normal faults (Sigvaldason 2002), which truncate lavas older than Hekla 4 but do not cut any post-Hekla 4 lavas. This suggests that movement on the Öskjuop faults took place around the time of, or just prior to, the Hekla 4 eruption, such that post-Hekla 4 lavas originating from vents within the Askja caldera were able to flow through the Öskjuop and onto Askja’s eastern lava apron. The distribution of post-Hekla 4 lavas on the eastern lava apron indicates that the bottom of the Öskjuop must be higher than 700 m a.s.l., and cannot extend much above 900 m. The bottom of Öskjuop must therefore lie between 50 and 200 m below the present-day ground surface. Assuming an average total lava thickness of 100–120 m within the Öskjuop, and that the upper ∼25 m of this comprises historic flows, then the thickness of pre-871 AD to post-Hekla 4 lava is of the order 75–100 m (Fig. 4). Pre-871 AD to post-Hekla 4 lavas within Askja caldera are expected to be of comparable thickness, and therefore to have a volume of ∼2.5±3.3 km3. Pre-Hekla 4 intracaldera lavas may therefore be at least 200 m thick with a volume of ∼6.6 km3. It is not known how much of this volume may be older than 7.2 ka.
The assumptions made in calculating the volume of the intracaldera lava pile mean that these volumes are subject to considerable uncertainty. However, we note that if the intracaldera lava pile is assumed to be 300 m thick then the total postglacial erupted volume increases by 25 %, from 39.0 to 48.9 km3 (Table 3).
Discussion
Identification of new tephrochronological marker layers
We have identified seven new potential marker tephra layers that may facilitate further tephrochronological dating of lavas in the Askja region. In the section below we briefly describe how these tephras were identified.
-
1.
A tephra layer with composition corresponding to the Grímsvötn 1873 tephra (Hartley 2012) is present in profile C104t (Fig. 5), on a young lava in the west of the caldera. Tephra of this composition is present in two further profiles; one within the caldera (C126) and one in the Öskjuop pass (12-07-08). Logs of these profiles are provided in the ESM.
-
2.
A tephra layer with compositional affinity for the Bárðarbunga-Veiðivötn volcanic system, but on average more MgO-rich than the Veiðivötn 1477 tephra, is identified in several profiles in Askja caldera and Öskjuop (labelled V1717 on Figs. 5 and 6). This tephra sits stratigraphically above a thick scoria lapilli layer, which is in turn stratigraphically above Veiðivötn 1477 tephra (Fig. 5). It can be deduced from these stratigraphic relationships that this tephra most likely corresponds to the Veiðivötn 1717 eruption.
Fig. 6 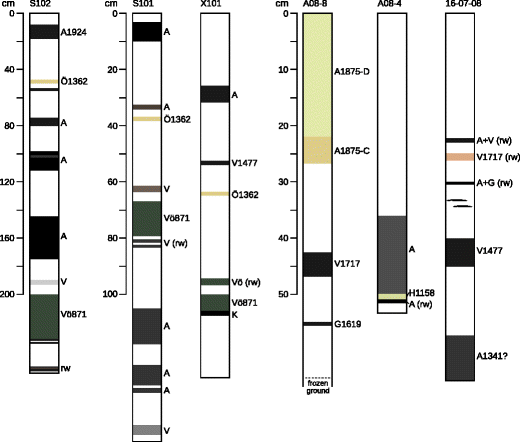
Surface cover profiles showing tephra layers found above lavas on Askja’s northern, eastern and southern lava aprons. Coloured intervals are tephra layers, with the colour approximating the colour of the layer in the field. Interpretation of the source volcano is given to the right of each profile: A, Askja; G, Grímsvötn; V, Bárðarbunga-Veiðivötn; H, Hekla; Ö, Öræfajökull; K, Katla. Layers marked rw are interpreted as being reworked
-
3.
The scoria lapilli layer mentioned above has compositional affinity for Askja, and may correspond to an eruption in 1510 AD that was described by Jónsson (1945). It was found in three profiles within the caldera (C135, 02-08-08, 29-08-06; Fig. 5), but with thickness ranging from 2 to 25 cm suggesting that the logged profiles were located perpendicular to the dispersal axis.
-
4.
A tephra layer from Grímsvötn was found in profile A08-8 in the Öskjuop pass (Fig. 6), on a flow stratigraphically below the 1961 lava but above a flow on which Veiðivötn 1477 tephra is found. Due to its stratigraphic position, this tephra most probably corresponds to the Grímsvötn 1619 AD eruption.
-
5.
Tephra associated with the Fjárhólahraun eruption, in the north-east of the study area, was found resting on the Fjárhólahraun lava, below a primary tephra interpreted as Veiðivötn 1477 (A1341 in profile 16-07-08, Fig. 6). This stratigraphic relationship indicates that the Fjárhólahraun lava was not associated with the 1874–1876 volcano-tectonic episode at Askja, as has been previously suggested (Hartley and Thordarson 2013), but instead may be associated with an event in 1341 AD and attributed to the Askja region by Jónsson (1945). Historical reports imply that several eruptions took place at various locations across Iceland at this time, including at Hekla volcano, Lómagnúpur, Öræfajökull and possibly in the region southwest of Vatnajökull (Jónsson 1945).
-
6.
A second scoria lapilli layer with a composition slightly more evolved than the Fjárhólar tephra was found above Hekla 1158 tephra in profile A08-4 on a flow located 300 m southeast of the Fjárhólar fissure (Fig. 6). This tephra is not found in profile 16-07-08, so it must be older than 1341 AD but no older than 1158 AD or of a similar age to the Fjárhólar tephra. Although its precise eruption age is not known, we suggest that this tephra may form a second potential marker horizon in the Fjárhólar region.
-
7.
In three profiles on Askja’s southern lava apron (S101, S102, X101; Fig. 6) we identified an olive green to brown, fine- to medium-grained ash layer containing abundant plagioclase fragments and cross-laminated on a cm to dm-scale, with a geochemical affinity for the Bárðarbunga-Veiðivötn volcanic system. The macroscopic and compositional characteristics of this tephra closely match those of the Vatnaöldur tephra of 871 ± 2 AD (e.g. Larsen 1984; Dugmore et al. 2000). This is the first occasion that the Vatnaöldur tephra has been reported in the Askja region.

Documentation on the tephra fall from the Grímsvötn 1873 and 1619, Veiðivötn 1717 and Vatnaöldur 871 eruptions indicate that their tephras were widely dispersed across north Iceland (Larsen 1984; Larsen et al. 2014). The Askja 1510 and 1341 tephras are likely to be more locally dispersed, but nevertheless may form useful time marker horizons in the vicinity of Askja central volcano. Geochemical plots of the compositions of the seven tephras, alongside relevant reference compositional data, are provided in the ESM.
Age distribution of Askja lavas
The tephra stratigraphy revealed in surface cover profiles within Askja caldera indicates that the age distribution of lavas now exposed at the caldera floor is considerably greater than has previously been recognised. While Sigvaldason et al. (1992) reported that the lavas within the caldera were all older than 1477 AD, our results suggest that over half the area of the caldera floor is covered by lavas erupted after 1510 AD. The vents and fissures located along the western rim of Askja caldera have therefore been active within the past 500 years. Furthermore, the presence of Hekla 1158 tephra in profile 29-08-06 (Fig. 5), in the eastern part of Askja caldera, further refines the age distribution of older lavas within the caldera. This is the first time that tephra layers older than Veiðivötn 1477 have been identified in the surface cover overlying the intracaldera lavas.
With the exception of the 1924–1929 AD Thorvaldshraun lava, the eruptive output of Askja’s southern lava apron has previously been dated as older than Hekla 3 (3.1 ka) with the majority of the erupted volume being older than Hekla 4 (4.3 ka). We identified the Vatnaöldur 871 AD tephra in three profiles above lavas on Askja’s southern lava apron (Fig. 6). Hekla 3 tephra was not found in these profiles. This could be due to removal of Hekla 3 tephra, but the fact that the Vatnaöldur tephra is found near the base of two of the three profiles suggests that the underlying lavas post-date the Hekla 3 eruption. This indicates that the fissures south of Askja have been much more active over the past ∼1,500 years than has previously been recognised. Excavation of surface cover profiles is very labour-intensive in the region south of Askja due to the thick surface cover, and tephrochronological investigations are hampered by the rapid reworking of primary tephras by aeolian and/or meltwater transport. Future work in this region is likely to provide further refinements to our knowledge of the age distribution of lavas on Askja’s southern lava apron.
Flatadyngja lava shield has previously been dated as older than Sn-2 tephra (3.6 ka) (Sigvaldason et al. 1992). We did not find Sn-2 tephra in the surface cover above Flatadyngja: the oldest tephra we found was Hekla 1158 in a profile located on the southwest side of Herðubreið (Fig. 3). Furthermore, we note that Flatadyngja lava surfaces are often well preserved and that the surface cover is often sparse and thin, containing few tephra horizons. This youthful appearance and apparent absence of older tephra layers raises the possibility that Flatadyngja may be much younger than previously thought. However, further work is required to test this hypothesis. In the remainder of the discussion we have therefore retained the previously determined age of >3.6 ka for Flatadyngja (Sigvaldason et al. 1992). We also explore the implications of a younger age for Flatadyngja.
Time-averaged magma discharge rates during the postglacial period
Timing of deglaciation at Askja
The timing of major changes in ice sheet size must be understood in order to assess the relationship between deglaciation and volcanism in the Askja region. The last major deglaciation of Iceland began at around 15.5 ka and continued until ∼10.5 ka, over which time the ice sheet retreated from outside Iceland’s present-day coastline to approximately its present size. Over this period there were several glacial advances and retreats, including periods of very rapid retreat between ∼14.7–12.8 and ∼11.7–10.5 ka and re-advances during colder periods between ∼14–13.7 and ∼12.8–11.7 ka (Geirsdóttir et al. 2007, 2009; Norðdahl et al. 2008). By ∼10.8–10.5 ka, Iceland is thought to have been largely ice-free except for its highest peaks (e.g. Eason et al. 2015, and references therein). The Bárðardálshraun lava, erupted from vents in the Dyngjuháls area ∼35 km south-west of Askja (i.e. inland of Askja), has been dated as older than 10.3 ka (Hjartarson 2003), which verifies that the Askja region must have been ice-free by this time.
It has previously been suggested that the absence of Hekla 5 tephra (7.2 ka) from Askja’s postglacial lava aprons may indicate that the area was not fully deglaciated at the time of the Hekla 5 eruption (Annertz et al. 1985). However, Hekla 5 tephra has been found at Kárahnjúkar and several other locations on the northern edge of Vatnajökull glacier, inland of Askja (Óladóttir et al. 2011b). This demonstrates that these locations, and hence the Askja region, were ice-free at 7.2 ka. Our preferred interpretation of the absence of Hekla 5 tephra at Askja is therefore that the lavas now exposed at Askja are younger than 7.2 ka. Hekla 5 tephra is expected to have been deposited in the region (Fig. 1), but may have been covered by younger lavas and/or removed by reworking of the surface cover.
Postglacial magma discharge rates in the Askja region
Figure 7 shows the variation in total erupted volume and magma discharge rate from 7.2 ka (i.e. time after the Hekla 5 eruption) to the present day, excluding the intracaldera lava pile. Magma discharge rates are assumed to remain constant within each tephrochronological age bracket, thus the calculated variations in magma discharge rate are necessarily a function of the available tephrochronological resolution. It is important to note that this time-averaged magma discharge rate does not convey any information concerning the mass eruption rate during periods of eruptive activity. For example, lava shields such as Kollóttadyngja are thought to be emplaced during monogenetic eruptions that last decades to centuries (e.g. Rossi 1996), but in order to derive Fig. 7 the 18 km3 of lava erupted at Kollóttadyngja contributes to the total volume of lava in the period 7.2 and 4.3 ka, i.e. between the Hekla 4 and 5 eruptions, and thus contributes to the time averaged discharge through that interval.

a Cumulative erupted volume of magma in the Askja region, with the area below the grey dotted line expanded in b. The intracaldera lava pile is not included, since there are considerable uncertainties involved in calculating its volume. Symbols indicate identified tephrochronological age markers; the magma discharge rate is assumed to be constant within each age bracket. The grey-shaded area shows time before the Hekla 5 eruption (7.2 ka). Since Hekla 5 tephra has not been found in the Askja region, we assume that postglacial lavas that pre-date Hekla 4 were erupted between 7.2 and 4.3 ka. The dashed lines illustrate the effect of assuming that pre-Hekla 4 lavas were erupted between 10.3 and 4.3 ka. c Variations in time-averaged magma discharge rate in the Askja region. Note the different scales on the y-axes of sub-plots. The black line in the uppermost panel shows the magma discharge rate for the total erupted volume including the four lava shields Litladyngja, Svartadyngja, Flatadyngja and Kollóttadyngja; the grey line shows the total erupted volume excluding these lava shields
Time-averaged magma discharge rates across the whole Askja region are greatest between 3.6 and 4.3 ka, i.e. between the Sn-2 and Hekla 4 eruptions (Fig. 7). The erupted volume in this period is dominated by the 2.6 km3 Flatadyngja lava shield, which is here assumed to be older than 3.6 ka. Average magma discharge rates are almost as high between 7.2 and 4.3 ka (Fig. 7). The erupted volume in this period was dominated by Kollóttadyngja; the average magma discharge rate is 9.9 km3/kyr if all erupted products are taken into account, but 3.1 km3/kyr excluding Kollóttadyngja. Magma discharge rates on the northern and southern lava aprons appear to be higher between 3.1 and 4.3 ka than in the period prior to 4.3 ka, but this may be an artefact caused by an underestimation of the true volume of older lava. At 3.1 ka, there is a sharp decrease in the time-averaged magma discharge rate, which is seen on all three lava aprons.
If the pre-Hekla 4 lavas are assumed to have erupted between 10.3 and 4.3 ka, then the average magma discharge rate in the Askja region remains relatively constant, at 5.0–5.1 km3/kyr, between 10.3 and 3.1 ka. However, calculated magma discharge rates for the lava shields alone are higher between 4.3 and 3.1 ka than between 10.3 and 4.3 ka (Fig. 7).
Between 3.1 and 1.1 ka, the average magma discharge rate dropped to <0.2 km3/kyr. After 1.1 ka, calculated magma discharge rates are highly variable due to the increased tephrochronological resolution available. This is particularly evident for lavas in the Askja caldera: for example, the peak magma discharge rate of 3 km3/kyr (Fig. 7c) occurs in the narrowest tephrochronological age bracket of 1510 to 1477 AD.
Taking all erupted products into account, the average magma discharge rate from 1.1 ka to the present day is 2.0 km3/kyr, an order of magnitude greater than between 3.1 and 1.1 ka. The increase in magma discharge rate is to some extent due to the fact that multiple young, small-volume eruptions are accounted for within this time period, thereby biasing the calculated magma discharge rate towards a higher value. For older tephrochronological age brackets, an unknown number of small-volume eruptions have been completely covered by younger lavas and are not accounted for, thereby biasing the calculated magma discharge rate towards lower values. The magma discharge rates shown in Fig. 7 should therefore be regarded as minima, especially for the older tephrochronological age brackets.
If Flatadyngja is assumed to have a younger age, erupting sometime between the Hekla 3 and Hekla 1158 AD tephras, then the time-averaged magma discharge rate between 3.6 and 4.3 ka is reduced by a factor of 4.8 to 2.1 km3/kyr (Fig. 8). The corresponding increase in time-averaged magma discharge rate between 3.1 and 0.88 ka sees an additional 1.18 km3/kyr attributed to Flatadyngja within this time interval. The poor temporal resolution of this 3.1–0.88 ka tephrochronological age bracket means that a younger age for Flatadyngja does not affect the apparent decrease in time-averaged magma discharge rate at 3.1 ka.

As Fig. 7, but exploring the implications of a younger age for Flatadyngja lava shield. Black and orange lines show cumulative erupted volumes and time-averaged magma discharge rates if Flatadyngja is assumed to have erupted between 4.3 and 3.6 ka. Red lines show the cumulative erupted volumes and time-averaged magma discharge rates if Flatadyngja has a younger tephrochronological age and erupted in the period between 3.1 ka and 1158 AD
Time-averaged magma discharge rates prior to 1158 AD are increased if the intracaldera lava pile is taken into account (Fig. 9). This increase is particularly pronounced between 871 and 1158 AD. The pre-4.3 ka erupted volume is significantly increased by the intracaldera lava fill; however, it is unknown how much of this volume is older than 7.2 ka. If the intracaldera lavas are assumed to be younger than 7.2 ka, then the pre-Hekla 4 time-averaged magma discharge rate reaches a peak of 11.5–13.1 km3/kyr for the Askja region. If the intracaldera pile includes lavas erupted between 10.3 and 7.2 ka, then the time-averaged magma discharge rate within the caldera appears to have remained steady between 10.3 and ∼1 ka and there is no pre-4.3-ka regional peak in time-averaged magma discharge rate. However, given the considerable uncertainties involved in estimating the volume and age distribution of the intracaldera lava pile, it is difficult to assess the accuracy of the calculated time-averaged magma discharge rates shown in Fig. 9.

As Fig. 7, but including the buried lava pile within Askja caldera. The shaded regions indicate cumulative erupted volumes and time-averaged magma discharge rates given our assumptions concerning possible minimum and maximum thicknesses of intracaldera lavas erupted within different time periods (see Table 3 and text). Cumulative erupted volumes and time-averaged magma discharge rates excluding the intracaldera pile are shown by dark red (total), dark green (total excluding lava shields) and dark blue (caldera), respectively
Comparison with postglacial magma discharge rates in coastal regions of Iceland
In order to compare the postglacial magma discharge rates calculated for the Askja region with other areas in Iceland, we followed the method of Maclennan et al. (2002) which facilitates the comparison of magma discharge rates for volcanic systems of different sizes. The normalised magma discharge rate is calculated by dividing the magma discharge rate in km3/ka by the total postglacial erupted volume to give a rate in volume percent per thousand of years.
Normalised magma discharge rates for Askja, Theistareykir (Maclennan et al. 2002) and the Western Volcanic Zone (WVZ) (Sinton et al. 2005) are shown in Fig. 10. For both Theistareykir and the WVZ, the highest magma discharge rates occur in the early postglacial period between 12 and 10 ka. This early postglacial peak in productivity has been attributed to decreased confining pressure and amplified melt production rates in the mantle in response to removal of glacial ice (Jull and McKenzie 1996; Slater et al. 1998; Maclennan et al. 2002). Sigvaldason et al. (1992) argued that a similar argument could be applied to the Askja region on the basis of high magma discharge rates in the period between deglaciation (∼10 ka) and the Hekla 4 eruption (4.3 ka). However, if all the postglacial lavas exposed at Askja are younger than Hekla 5 (7.2 ka), then it is not possible to resolve magma discharge rates for the early postglacial period between 10 and 7.2 ka. Even if the pre-Hekla 4 lavas are assumed to have erupted between 10.3 and 4.3 ka, the available tephrochronological resolution is not sufficient to detect any early postglacial peak in magma productivity.

Normalised magma discharge rates, in percent per thousand of years, for the Askja region, Theistareykir (Maclennan et al. 2002), and the Western Volcanic Zone (WVZ; Sinton et al. 2005). Black lines do not include the Askja intracaldera lava pile; thin red lines and red-shaded areas show the effect on normalised magma discharge rates when the intracaldera lavas are taken into account. The grey-shaded area shows the period of rapid postglacial rebound experienced in near-coastal areas of Iceland as used by Maclennan et al. (2002). The solid black line assumes that lavas in the Askja region that pre-date Hekla 4 were erupted between 7.2 and 4.3 ka, while the dashed black line assumes that these lavas were erupted between 10.3 and 4.3 ka
Our data do not exclude the possibility that the Askja region experienced high magma discharge rates following deglaciation. Indeed, it is possible that some proportion of the hyaloclastites and pillow lavas found in the Askja region date were erupted into shallow lakes following the end of deglaciation but before isostatic rebound was complete (Sigvaldason et al. 1992). However, there is no reliable way to determine the age of these hyaloclastites; thus, the volume associated with any early postglacial eruptions remains unknown.
We also note that existing models of melt production in response to glacial unloading assume that deglaciation resulted in the removal of ∼2 km of ice over a period of ∼1,000 years (e.g. Jull and McKenzie 1996). However, the reconstructed deglaciation history of North Iceland suggests four plausible glacial re-advances and retreats between c.14.7 and 10.9 ka (e.g. Geirsdóttir et al. 2007). The effect of these short- to medium-period (tens to hundreds of years) oscillations in glacial loading and unloading on melt production rate is not taken into account by existing models. In addition, timescales of melt extraction, and the response lag time between surface unloading changes and the arrival of new melt to into the crust, are not yet well constrained but could be significant, on the order of several thousands of years (Jellinek et al. 2004; cf Burley and Katz 2015).
Summary and conclusions
We have used a combination of tephrochronological dating and detailed mapping of postglacial lava flows to estimate the total volume of magma erupted in the vicinity of Askja central volcano during the postglacial period. At least 39 km3 of basaltic lava has been erupted at Askja since the area became ice-free; an additional volume of 9.6–16.5 km3 forms the 300–500 m-thick lava pile that partially fills Askja caldera.
The discovery of seven tephra layers of known age, not previously reported in the Askja region, have allowed us to considerably refine the chronology of eruptive activity within Askja caldera and on the postglacial lava aprons. Much of Askja caldera floor is occupied by lava flows that post-date 1477 AD, while the oldest lavas exposed in the caldera floor pre-date 1158 AD. Furthermore, the identification of the Vatnaöldur 871 AD tephra above lavas on Askja’s southern lava apron indicates that the fissures south of Askja have been much more active in historical time than has previously been recognised.
Over 70 % of postglacial magmatic output in the Askja region was produced before the Hekla 4 eruption of 4.3 ka. The absence of Hekla 5 tephra from Askja’s postglacial lava aprons suggests that all the lavas exposed on Askja’s eastern, southern and northern lava aprons are younger than 7.2 ka, and do not sample the eruptive activity of the early postglacial period. Furthermore, the tephrochronological resolution preserved in surface cover profiles in the Askja region is not sufficient to resolve any peak in magma productivity following deglaciation of the region. An alternative sampling and dating method is therefore required if the eruptive history of the early postglacial period is to be studied in the Askja region.
References
Annertz K, Nilsson M, Sigvaldason GE (1985) The postglacial history of Dyngjufjöll. Nord Volcanol Inst 85
Boygle JE (1994) Tephra in lake sediments: an unambiguous geochronological marker? PhD thesis, Univ Edinburgh
Brown GC, Everett SP, Rymer H, McGarvie DW, Foster I (1991) New light on caldera evolution—Askja, Iceland. Geology 19:352–355
Burley JMA, Katz RF (2015) Variations in mid-ocean ridge CO2 emissions driven by glacial cycles. Earth Planet Sci Lett 426:246–258
Carey RJ, Houghton BF, Thordarson T (2008a) Contrasting styles of welding observed in the proximal Askja 1875 eruption deposits I: regional welding. J Volcanol Geotherm Res 171:1–19
Carey RJ, Houghton BF, Thordarson T (2008b) Contrasting styles of welding observed in the proximal Askja 1875 eruption deposits II: local welding. J Volcanol Geotherm Res 171:20–44
Carey RJ, Houghton BF, Thordarson T (2010) Tephra dispersal and eruption dynamics of wet and dry phases of the 1875 eruption of Askja Volcano, Iceland. Bull Volcanol 72:259–278
Crowley JW, Katz RF, Huybers P, Langmuir CH, Park S-H (2015) Glacial cycles drive variations in the production of oceanic crust. Science 347:1237–1240
Dugmore AJ, Larsen G, Newton AJ (1995) Seven tephra isochrones in Scotland. The Holocene 5:257–266
Dugmore AJ, Newton AJ, Larsen G, Cook GT (2000) Tephrochronology, environmental change and the Norse settlement of Iceland. Environ Archaeol 5:21–34
Eason DE, Sinton JM, Grönvold K, Kurz MD (2015) Effects of deglaciation on the petrology and eruptive history of the Western Volcanic Zone, Iceland. Bull Volcanol 77:47
Gee MAM, Thirlwall MF, Taylor RN, Lowry D, Murton BJ (1998) Crustal processes: major controls on Reykjanes Peninsula lava chemistry, SW Iceland. J Petrol 39:819–839
Geirsdóttir Á, Miller GH, Andrews JT (2007) Glaciation, erosion and landscape evolution of Iceland. J Geodyn 43:170–186
Geirsdóttir Á, Miller GH, Axford Y, Ólafsdóttir S (2009) Holocene and late Pleistocene glacier fluctuations in Iceland. Quat Sci Rev 28:2107–2118
Gíslason SR, Stefánsdóttir G, Pfeffer MA, Barsotti S, Jóhannsson T, Galeczka I, Bali E, Sigmarsson O, Stefánsson A, Keller NS, Sigurdsson Á, Bergsson B, Galle B, Jacobo VC, Arellano S, Aiuppa A, Jónasdóttir EB, Eiríksdóttir ES, Jakobsson S, Guðfinsson GH, Halldórsson SA, Gunnarsson J, Haddadi B, Jónsdóttir I, Thordarson T, Riishuus M, Högnadóttir T, Dürig T, Pedersen GBM, Höskuldsson Á, Gudmundsson MT (2015) Environmental pressure from the 2014–15 eruption of Bárðarbunga volcano, Iceland. Geochem Perspect Lett 1:84–93
Graettinger AH, Ellis MK, Skilling IP, Reath K, Ramsey MS, Lee RJ, Hughes CG, McGarvie DW (2013) Remote sensing and geologic mapping of glaciovolcanic deposits in the region surrounding Askja (Dyngjufjöll) volcano, Iceland. Int J Remote Sens 34:7178–7198
Grönvold K, Óskarsson N, Johnsen SJ, Clausen HB, Hammer CU, Bond G, Bard E (1995) Ash layers from Iceland in the Greenland GRIP ice core correlated with oceanic and land sediments. Earth Planet Sci Lett 135:149–155
Gudmundsson A (1986) Mechanical aspects of postglacial volcanism and tectonics of the Reykjanes Peninsula, southwest Iceland. J Geophys Res 91:12711–12712
Hardarson BS, Fitton JG (1991) Increased mantle melting beneath Snæfellsjökull volcano during Late Pleistocene deglaciation. Nature 353:62–64
Hartley ME (2012) Postglacial volcanism and magmatism on the Askja volcanic system, North Iceland. PhD thesis, Univ Edinburgh, 397 pp
Hartley ME, Thordarson T (2012) Formation of Öskjuvatn caldera at Askja, North Iceland: mechanism of caldera collapse and implications for the lateral flow hypothesis. J Volcanol Geotherm Res 227–228:85–101
Hartley ME, Thordarson T (2013) The 1874–76 volcano-tectonic episode at Askja, North Iceland: lateral flow revisited. Geochem Geophys Geosyst 14:2286–2309
Hayward CL (2012) High spatial resolution electron probe microanalysis of tephras and melt inclusions without beam-induced chemical modification. The Holocene 22:119–125
Hjartarson Á (2003) The Skagafjörður unconformity, north Iceland, and its geological history. PhD thesis, Geological Museum, Univ Copenhagen
Huybers P, Langmuir C (2009) Feedback between deglaciation, volcanism, and atmospheric CO2. Earth Planet Sci Lett 286:479–491
Jellinek AM, Manga M, Saar MO (2004) Did melting glaciers cause volcanic eruptions in eastern California? Probing the mechanics of dike formation. J Geophys Res 109:B09206
Jóhannesson H, Flores RM, Jónsson J (1981) A short account of the Holocene tephrochronology of the Snæfellsjökull central volcano, western Iceland. Jökull 31:23–30
Jónsson Ó (1945) Ódáðahraun I-III, Bókaútgáfan Norðri, Akureyri, 1277 pp
Jude-Eton TC (2013) Eruption dynamics within an emergent subglacial setting: a case study of the 2004 eruption of Grímsvötn volcano, Iceland. PhD thesis, Univ Edinburgh
Jull M, McKenzie D (1996) The effect of deglaciation on mantle melting beneath Iceland. J Geophys Res 101:21815–21828
Larsen G (1984) Recent volcanic history of the Veiðivötn fissure swarm, southern Iceland: an approach to volcanic risk assessment. J Volcanol Geotherm Res 22:33–58
Larsen G (1992) Gjóskulagið úr Heklugosinu 1158 (The tephra layer from the 1158 AD eruption of Hekla). Jarðfræðafélag Íslands, Vorráðstefna, Yfirlit og ágrip, 25–27
Larsen G, Thorarinsson S (1977) H and other acid Hekla tephra layers. Jökull 27:28–46
Larsen G, Dugmore A, Newton A (1999) Geochemistry of historical-age silicic tephras in Iceland. The Holocene 9:463–471
Larsen G, Eiríksson J, Gudmundsdóttir ER (2014) Last millennium dispersal of air-fall tephra and ocean-rafted pumice towards the north Icelandic shelf and the Nordic seas. Geol Soc Lond Spec Publ 398:113–140
Macdonald R, Sparks RSJ, Sigurdsson H, Mattey DP, McGarvie DW, Smith RL (1987) The 1875 eruption of Askja volcano, Iceland: combined fractional crystallisation and selective contamination in the generation of rhyolitic magma. Mineral Mag 51:183–202
Maclennan J, McKenzie D, Grönvold K (2001) Plume-driven upwelling under central Iceland. Earth Planet Sci Lett 194:67–82
Maclennan J, Jull M, McKenzie D, Slater L, Grönvold K (2002) The link between volcanism and deglaciation in Iceland. Geochem Geophys Geosyst 3:1062
Meara RH (2012) Geochemical fingerprinting of Icelandic silicic Holocene tephra layers. PhD thesis, Univ Edinburgh, 338 pp
Nakada M, Yokose H (1992) Ice age as a trigger of active Quaternary volcanism and tectonism. Tectonophysics 212:321–329
Norðdahl H, Ingólfsson Ó, Pétursson HG, Hallsdóttir M (2008) Late Weichselian and Holocene environmental history of Iceland. Jökull 58:343–364
Nowell DAG, Jones MC, Pyle DM (2006) Episodic Quaternary volcanism in France and Germany. J Quat Sci 21:645–675
Óladóttir BA, Sigmarsson O, Larsen G, Thordarson T (2008) Katla volcano, Iceland: magma composition, dynamics and eruption frequency as recorded by Holocene tephra layers. Bull Volcanol 70:475–493
Óladóttir BA, Larsen G, Sigmarsson O (2011a) Holocene volcanic activity at Grímsvötn, Bárðarbunga and Kverkfjöll subglacial centres beneath Vatnajökull, Iceland. Bull Volcanol 73:1187–1208
Óladóttir BA, Sigmarsson O, Larsen G, Devidal JL (2011b) Provenance of basaltic tephra from Vatnajökull subglacial volcanoes, Iceland, as determined by major- and trace-element analyses. The Holocene 21:1037–1048
Olive J-A, Behn MD, Ito G, Buck WR, Escartìn J, Howell S (2015) Sensitivity of seafloor bathymetry to climate-driven fluctuations in mid-ocean ridge magma supply. Science 350:310–313
Rampino MR, Self S, Fairbridge RW (1979) Can rapid climate change cause volcanic eruptions? Science 16:826–829
Reimer PJ, Bard E, Bayliss A, Beck JW, Blackwell PG, Bronk Ramsey C, Buck CE, Cheng H, Edwards RL, Friedrich M, Grootes PM, Guilderson TP, Halfidason H, Hajdas I, Hatté C, Heaton TJ, Hoffmann DL, Hogg AG, Hughen KA, Kaiser KF, Kromer B, Manning SW, Niu M, Reimer RW, Richards DA, Scott EM, Southon JR, Staff R, Turney CSM, van der Plicht J (2013) IntCal13 and Marine13 radiocarbon age calibration curves 0–50,000 years cal BP. Radiocarbon 55:1869–1887
Rossi MJ (1996) Morphology and mechanism of eruption of postglacial shield volcanoes in Iceland. Bull Volcanol 57:530–540
Sigmundsson F, Hooper A, Hreinsdóttir S, Vogfjörd KS, Ófeigsson BG, Heimisson ER, Dumont S, Parks M, Spaans K, Gudmundsson GB, Drouin V, Árnadóttir T, Jónsdóttir K, Gudmundsson MT, Högnadóttir T, Fridriksdóttir HM, Hensch M, Einarsson P, Magnússon E, Samsonov S, Brandsdóttir B, White RS, Ágústsdóttir T, Greenfield T, Grenn RG, Hjartardóttir ÁR, Pedersen R, Bennett RA, Geirsson H, LaFemina P, Björnsson H, Pálsson F, Sturkell E, Bean CJ, Möllhoff M, Braiden AK, Eibl EPS (2015) Segmented lateral dyke growth in a rifting event at Bárðarbunga volcanic system, Iceland. Nature 517:191–195
Sigurdsson H, Sparks RSJ (1981) Petrology of rhyolitic and mixed magma ejecta from the 1875 eruption of Askja, Iceland. J Petrol 22:41–84
Sigvaldason GE (1979) Rifting, magmatic activity and interaction between acid and basic liquids: the 1875 Askja eruption in Iceland. Nord Volcanol Inst 79:1–41
Sigvaldason GE (2002) Volcanic and tectonic processes coinciding with glaciation and crustal rebound: an early Holocene rhyolitic eruption in the Dyngjufjöll volcanic centre and the formation of the Askja caldera, north Iceland. Bull Volcanol 64:192–205
Sigvaldason GE, Annertz K, Nilsson M (1992) Effect of glacier loading/deloading on volcanism: postglacial volcanic production rate of the Dyngjufjöll area, central Iceland. Bull Volcanol 54:385–392
Sinton J, Grönvold K, Sæmundsson K (2005) Postglacial eruptive history of the Western volcanic zone, Iceland. Geochem Geophys Geosyst 6:Q12009
Slater L, Jull M, McKenzie D, Grönvold K (1998) Deglaciation effects on mantle melting under Iceland: results from the Northern Volcanic Zone. Earth Planet Sci Lett 164:151–164
Sparks RSJ, Wilson L, Sigurdsson H (1981) The pyroclastic deposits of the 1875 eruption of Askja, Iceland. Philos Trans R Soc A 299:241–273
Thórarinsson S (1958) The Öræfajökull eruption of 1362. Acta Naturalia Islandica 2:1–99
Thórarinsson S (1971) Aldur ljósu gjóskulaganna úr Heklu samkvæmt leiðréttu geislakolstímatali. Náttúrufræðingurinn 41:99–105
Thórarinsson S, Einarsson T, Kjartansson G (1960) On the geology and geomorphology of Iceland. Geografiska Annaler Stockholm 41:135–169
Thórarinsson S, Sigvaldason G (1962) The eruption in Askja 1961: A preliminary report. Am J Sci 260:641–651
Thordarson T, Höskuldsson Á (2008) Postglacial volcanism in Iceland. Jökull 58:197–228
Thordarson T, Larsen G (2007) Volcanism in Iceland in historical time: volcano types, eruption styles and eruptive history. J Geodyn 43:118–152
Tolstoy M (2015) Mid-ocean ridge eruptions as a climate valve. Geophys Res Lett 42:1346–1351
Wastegård S, Boygle J (2012) Distal tephrochronology of NW Europe—the view from Sweden. Jökull 62:73–80
Wastegård S, Andersson S, Perkins VH (2009) A new mid-Holocene tephra in central Sweden. GFF 131:293–297
Watt SFL, Pyle D, Mather T (2013) The volcanic response to deglaciation: Evidence from glaciated arcs and a reassessment of global eruption records. Earth Sci Rev 122:77–102
Acknowledgments
This work was supported by the Natural Environment Research Council [NE/F008929/1]. Mike Hall prepared the tephra samples, and Chris Hayward at the Microbeam Analytical Facility at the University of Edinburgh assisted with the electron microprobe analyses. We thank the Institute of Earth Sciences at the University of Iceland for making their field camp at Askja available to us, and Philippe Desorgues, Remke Ellis, Ben Winpenny and David Neave for their assistance in the field. We thank David Pyle and Sebastian Watt for their thorough and constructive reviews, and Richard Brown for his editorial handling.
Author information
Authors and Affiliations
Corresponding author
Additional information
Editorial responsibility: R.J. Brown
Rights and permissions
Open Access This article is distributed under the terms of the Creative Commons Attribution 4.0 International License (http://creativecommons.org/licenses/by/4.0/), which permits unrestricted use, distribution, and reproduction in any medium, provided you give appropriate credit to the original author(s) and the source, provide a link to the Creative Commons license, and indicate if changes were made.
About this article

Cite this article
Hartley, M.E., Thordarson, T. & de Joux, A. Postglacial eruptive history of the Askja region, North Iceland. Bull Volcanol 78, 28 (2016). https://doi.org/10.1007/s00445-016-1022-7
Received:
Accepted:
Published:
DOI: https://doi.org/10.1007/s00445-016-1022-7