
Abstract
Background
Coronal alignment of the tibial component determines functional outcome and survival in total knee arthroplasty (TKA). Innovative techniques for tibial instrumentation have been developed to improve accuracy and reduce the rate of outliers.
Methods
In a prospective study, 300 patients were allocated to four different groups using a randomization process (two innovative and two conventional) techniques of tibial instrumentation (conventional: extramedullary, intramedullary; innovative: navigation and patient-specific instrumentation (PSI); n = 75 for each group). The aims were to reconstruct the medial proximal tibial angle (MPTA) to 90° and the mechanical tibio-femoral axis (mTFA) to 0°. Both angles were evaluated and compared between all groups three months after the surgery. Patients who presented with a postoperative mTFA > 3° were classified as outliers.
Results
The navigation and intramedullary technique both demonstrated that they were significantly more precise in reconstructing a neutral mTFA and MPTA compared to the other two techniques. The odd’s ratio (OR) for producing outliers was highest for the PSI method (PSI OR = 5.5, p < 0.05; extramedullary positioning OR = 3.7, p > 0.05; intramedullary positioning OR = 1.7, p > 0.05; navigation OR = 0.04, p < 0.05). We could only observe significant differences between pre- and postoperative MPTA in the navigation and intramedullary group. The MPTA showed a significant negative correlation with the mTFA in all groups preoperatively and in the extramedullary, intramedullary and PSI postoperatively.
Conclusion
The navigation and intramedullary instrumentation provided the precise positioning of the tibial component. Outliers were most common within the PSI and extramedullary technique. Optimal alignment is dependent on the technique of tibial instrumentation and tibial component positioning determines the accuracy in TKA since mTFA correlated with MPTA pre- and postoperatively.
Introduction
Coronal alignment of the tibial and femoral components determines the functional outcome and survival after TKA [1, 2]. The mechanical tibiofemoral axis (mTFA) is considered to be aligned physiologically if the axis is within a range of ± 3° [3]. A mTFA > 3° post-TKA is defined as an outlier. Tibial malalignment is associated with an impaired function, increased complication risk and reduced survival rates [4, 5]. Intra- or extramedullary tibial instrumentation are conventional techniques and have likewise been demonstrated to achieve good outcomes. Nevertheless, high rates of outliers of up to 37% have been published [6].
Extramedullary instrumentation is most frequently used due to its easy handling as well as decreased invasiveness and morbidity compared to the intramedullary technique, which is of limited use in excessive tibial deformities [7, 8]. Innovative methods such as computer-assisted navigation or individualized cutting blocks in PSI have been developed to increase the accuracy of component positioning, reduce the rate of outliers and improve the function and survival rates in TKA [9, 10].
To our knowledge, results of tibial component positioning in the frontal plane in intra- and extramedullary positioning as well as navigation and PSI have not been directly compared, yet. Therefore, the purpose of this study was to investigate the accuracy of these four different tibial positioning techniques and emphasize the specific characteristics of conventional and innovative techniques.
Methods
Study design
In this prospective study, 300 consecutive TKAs in 300 patients with primary osteoarthritis (123 men, 177 women, age: 67 ± 7.5 years; body mass index (BMI): 29. 2 ± 2.8 kg/m2) were included between 2012–2015. Exclusion criteria were: preoperative extension deficit > 20°, valgus or varus malalignment > 15° and previous surgery of the affected joint. Patients deemed eligible for study inclusion were asked to participate in the study. Written informed consent was obtained from all patients. The local ethics committee approved this study (Landesärztekammer Brandenburg, approval number: S 12 (a) 2012).
Sample size calculations were performed using nQuery (Statistical Solutions Ltd, Cork, Ireland). Group sizes were determined given a significance level of 0.05, number of groups = 4, a power of 80% and a common standard deviation of the MPTA as stated in the literature for the gap-balancing technique of SD = 2.0 [11]. Given this, each group consisted of n = 75 patients. For randomization, a consecutively numbered list with 300 positions was created. Each number was randomly assigned one operative technique using a spreadsheet (Excel, Microsoft Corporation, New Mexico, USA). Subsequently, patients were allocated to one of the four operative techniques in ascending order of their operation date in the clinic.
Preoperatively, the implant components were digitally planned perpendicular to the mechanical femoral and tibial axes using x-rays and the software mediCAD (Hectec GmbH, Altdorf, Germany). In all preoperative plannings, both the mTFA and MPTA were aimed to be reconstructed to their physiological angle of 0° and 90°, respectively.
Operative technique
All operations were performed by one single senior surgeon (H.H.). A medial parapatellar approach was used and surgery took place under general anesthesia. All TKAs were operated using the gap-balancing and tibia-first technique [12]. Patients with navigated TKA or extramedullary instrumentation were implanted a TC PLUS PRIMARY (Smith & Nephew, Memphis, TN, USA). In PSI and intramedullary the Journey II CR (Smith & Nephew, Memphis, TN, USA) was used.
In extramedullary instrumentation, the cutting jig was positioned with the orientation to the anteromedial tibial crest, the center of the upper ankle and the second metatarsal bone [13]. When the intramedullary instrumentation was used, the rod of the instrumentation system was entered through an entry point located at the center of the tibial plateau. The rod was inserted at least 20 cm into the tibial diaphysis [14]. Computer-assisted navigation was conducted using the PI Galileo system, which works via landmarks that are defined through infrared optical markers [15]. In the PSI group, the Visionare Patient Match Technology was used (Visionaire®, Smith & Nephew, Memphis, TN). Individual cutting blocks made of nylon were produced based on three dimensional models from MRI and standing long-leg radiographs [16].
Radiological analysis
Anterior–posterior (a.p.) and lateral radiographs of the knee joint as well as a.p. radiographs of the entire leg were aquired under full weight-bearing. The leg was in neutral rotation with the patella facing straight forward, the fibular head covered by the tibia for one third and correct projection of the trochanter minor and ankle [17,18,19,20]. Geometrical angles and axes were measured using the software mediCad. The mTFA was defined as the angle between the mechanical tibial axis and the mechanical femoral axis. The mechanical axis of the femur was measured from the center of the femoral head to the center of a line drawn from the medial to the lateral femoral epicondyles. The mechanical axis of the tibia was measured from the ankle talus center to the center of a line drawn from the medial to the lateral edge of the bony resection surface of the proximal tibia plateau [18, 21,22,23]. Positive values were set for varus and negative values for valgus alignment. The medial proximal tibia angle (MPTA) was defined as the medial angle between the mechanical axis of the tibia and the bony resection surface of the proximal tibia [17, 23].
Statistical analysis
Statistics were calculated using “R” and the software RStudio© (RStudio, Inc., Boston, USA). Data were analyzed concerning normal/nonnormal distribution using histograms QQ-plots and mean/median. Analysis of variance (ANOVA) was used to assess differences between the four groups, pairwise testing was done with sequential Bonferroni correction (Holm’s method). Results with normal distribution are presented as means with standard deviation, results with nonnormal distribution are presented as medians with interquartile ranges. Logistic regression was performed to demonstrate the odd’s ratio (OR) of rendering an outlier for each method. Logistic regression results are presented as OR and 95% confidence interval (CI). A p value < 0.05 was considered statistically significant. Correlations were displayed with scatter plots and calculated using Pearsons’s correlation coefficient.
Results
The accuracy of frontal tibial positioning was determined through measurement of the postoperative MPTA. Using ANOVA we could show that the preoperative MPTA was not significantly different distributed between all groups, hence demonstrating that deformities were equally randomized between groups. The postoperative MPTA, however, was significantly different distributed between all groups. The mean postoperative MPTA closest to the neutral alignment of 90° was in the navigation group (Table 1). Post-hoc analysis showed that navigation and the intramedullary technique were each significantly more precise in reconstructing a neutrally aligned postoperative MPTA compared to PSI and the extramedullary technique (Fig. 1). Significant differences between the pre- and postoperative MPTA could only be found in the navigation and intramedullary group. We did not find any significant differences in postoperative MPTA between the navigation and intramedullary technique. In the extramedullary and PSI group, pre- and postoperative MTPA did not differ significantly. Subsequently, reconstruction of the MPTA using the extramedullary or PSI technique was deemed insufficient in this cohort.
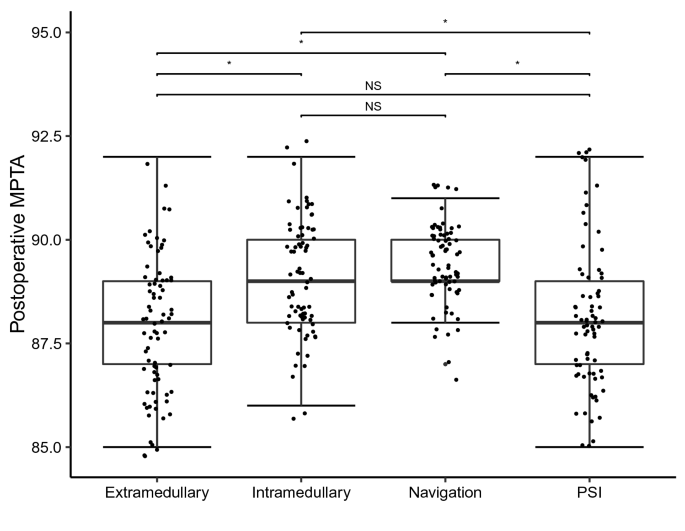
Dot plot displaying the postoperative medial proximal tibia angle (MPTA) for each method separately. Each dot represents one patient. Boxplots displaying the median with interquartile ranges of the postoperative MPTA for each method. Asterisks indicate significant differences between indicated groups
ANOVA testing equally showed that the preoperative mTFA was not significantly different distributed between all groups, demonstrating that malalignments were equally randomized between groups, as well. The postoperative mTFA was significantly different distributed between all groups. The mean postoperative mTFA closest to the neutral axis could be found in the navigation group (Table 1). Post-hoc analysis reveled that navigation and the intramedullary technique were each significantly more precise in reconstructing a neutral mTFA compared to PSI and the extramedullary technique (Fig. 2). We could not find significant differences between navigation and the intramedullary technique concerning postoperative mTFA (Fig. 2). Further analysis demonstrated that the postoperative mTFA was significantly improved compared to the preoperative mTFA in each technique.
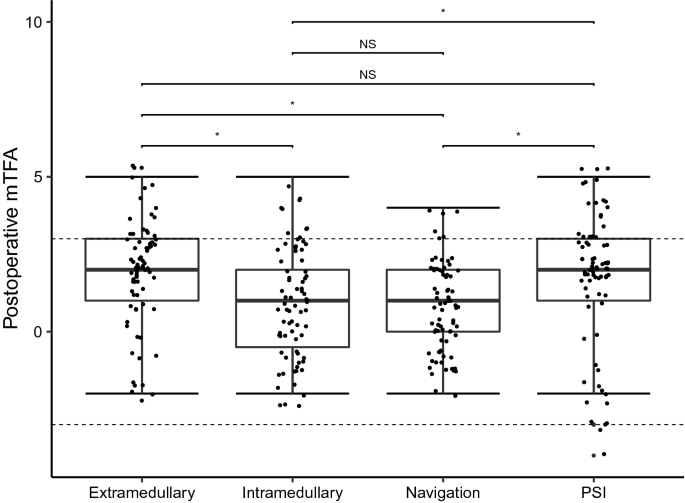
Dot plot displaying the postoperative mechanical tibiofemoral angle (mTFA) for each method separately. Each dot represents one patient. The dashed lines indicate the cutoff for outliers (mTFA > 3° from the neutral axis). Boxplots displaying the median with interquartile ranges of the postoperative mTFA for each method. Asterisks indicate significant differences between indicated groups
PSI produced the highest rate of outliers (mTFA > 3° from the neutral axis) (18.7%) followed by the extramedullary technique (13.3%). Navigation and intramedullary positioning rendered relatively low rates of outliers of merely 4.0% and 6.7%, respectively (Table 1; Fig. 2). Logistic regression could demonstrate that the odd’s ratio for producing outliers was highest for the PSI method. PSI OR = 5.5 (1.5–20.1 95% CI), p < 0.05; extramedullary positioning OR = 3.7 (1.0–14.0 95% CI), p > 0.05; intramedullary positioning OR = 1.7 (0.4–7.4 95% CI), p > 0.05; navigation OR = 0.04, p < 0.05. Outliers are depicted for each method separately in Fig. 2.
Correlation analysis could demonstrate that the preoperative MPTA significantly correlated with the preoperative mTFA in all groups, indicating that there was an association between the tibial alignment and the mechanical axis of the entire lower limb (extramedullary R = −0.72, p < 0.05; intramedullary R = −0.69, p < 0.05; PSI R = −0.75, p < 0.05; navigation R = −0.67, p < 0.05) (Fig. 3a). In analyzing the association between the MPTA and mTFA postoperatively we could observe that both parameters significantly correlated in all groups but the navigation technique (extramedullary R = −0.55, p < 0.05; intramedullary R = −0.56, p < 0.05; PSI R = −0.77, p < 0.05; navigation R = −0.16, p > 0.05) (Fig. 3b). The decreasing correlation between the postoperative MPTA and mTFA in the navigation group reflect our above mentioned observations of the most accurate reconstruction of the MPTA with the navigation technique. These results underline the importance of precise tibial alignment.
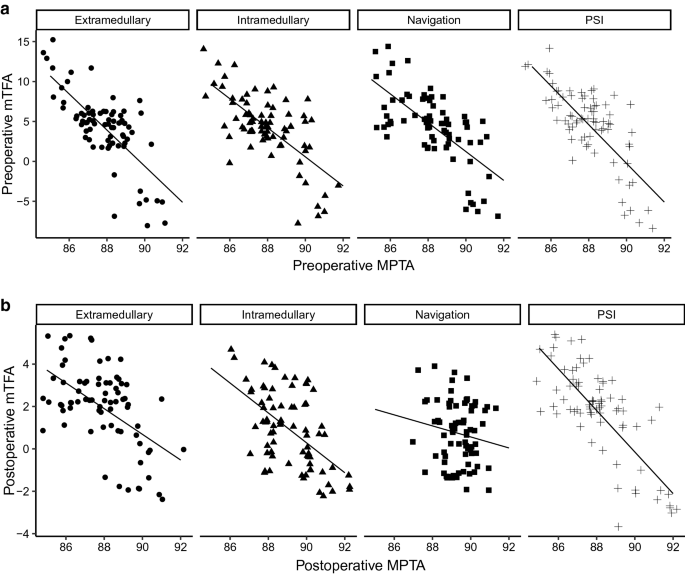
Correlation analysis between the medial proximal tibial angle (MPTA) and the mechanical tibio-femoral axis (mTFA) both (a) preoperatively and (b) postoperatively with subsets for each technique separately. a Pre-operative: extramedullary R = − 0.72, p < 0.05; intramedullary R = − 0.69, p < 0.05; PSI R = − 0.75, p < 0.05; navigation R = − 0.67, p < 0.05. b Postoperative: extramedullary R = − 0.55, p < 0.05; intramedullary R = −0.56, p < 0.05; PSI R = − 0.77, p < 0.05; navigation R = − 0.16, p > 0.05. Pearson’s correlation testing
Baseline characteristics did not differ between groups and are depicted in Table 1.
Discussion
Despite being the most frequently used method for tibial instrumentation in primary TKA worldwide, a significant amount of outliers with the tibial component has been evaluated in our study for the extramedullary technique. The accuracy of the tibial cut is particularly important when performing a tibia-first technique. In the current study, the method of tibial instrumentation significantly influenced the accuracy of MPTA and mTFA. The innovative PSI technique failed to demonstrate superior accuracy with a high rate of outliers for MPTA and mTFA.
Different factors have been identified to impede the accuracy of extramedullary orientation like obesity or drapings covering bony structures. Operative techniques have been reported to improve the accuracy in tibial extramedullary instrumentation [6]. Several methods to facilitate orientation in assistance with anatomical landmarks have been reported. A high precision of 98% for alignment has been described after identifying the center of the talus [24]. Another study advised palpating the anterior tibial crest which is within 3° of the tibial mechanical axis [13]. Furthermore, the distance between the extramedullary rod and the bone should be kept as short as possible to avoid errors in the tibial cut [25].
Less outliers regarding MPTA and MA were observed with the intramedullary technique, a method with a long historical tradition. Similar to our analysis, a study including 103 TKAs without severe bone deformities detected less outliers and a more accurate coronal alignment with the intramedullary compared to the extramedullary technique [26]. Intramedullary instrumentation was shown to be safe and accurate in patients with no or minor deformities. Patients with previous surgery of the affected knee and significant deformities have been excluded in our study.
The results of our study demonstrated a significantly higher accuracy in tibial positioning of the intramedullary compared to the extramedullary technique. There is no evidence in the literature favoring one of these two conventional methods over the other [6, 27]. In fact, outlier rates have been reported as high as 37% and 33% for the extra- and intramedullary technique, respectively [6]. In comparison, our results demonstrated outlier rates of merely 10% and 5% for these two techniques. Rahm et al. reported 31.5% outliers in the extramedullary group, 34.6% in the navigational group and 24.4% in the PSI group [28]. The preoperative mTFA of the referenced studies was markedly higher (14–20°) than the preoperative mTFA in our study (4° across all groups, Table 1) [8, 28, 29]. The low rate of outliers in our study could be conditioned by the differences in the baseline characteristics, and by exclusion of excessive preoperative deformities with a low variation of mTFA in our study. In comparison, other studies which demonstrated high rates of outliers did not report the preoperative mTFA [6, 30]. The comparability is, therefore, restricted. Furthermore, in several studies, different surgeons had performed the operations [28]. In this study, one single senior surgeon performed all operations, improving the consistency of the results [31].
Within the last years, two innovative concepts for alignment of TKA have been established which both attempt to overcome the limitations of the conventional techniques. Navigation underwent an enormous progress as it started about 30 years ago as computer-assisted surgery and developed into imageless navigation [15]. The navigation system used in our study was based on optical landmarks. Results after navigation are discussed controversely. Some authors have shown that navigation was superior for restoring alignment compared to conventional methods in literature [15, 32]. Others could not demonstrate significant differences concerning the postoperative alignment of the components nor the mechanical axis and outliers [33]. A recently published multicenter randomized control trial was the first to also show better functional outcome 2 years after navigated TKA compared to conventional instrumentation [34]. Previous generation navigation systems could not demonstrate superior long time outcome before [35]. Acquisition of the technique, surgery time and financial aspects are further important factors that have to be considered in navigated TKA.
Patient-Specific-Instrumentation has been thought to overcome the unsatisfied patient after TKA due to consideration of the individual anatomy. Promising results for PSI have been initially described in the literature. Within the following years, PSI failed to prove its superiority regarding alignment and clinical outcome compared to conventional methods [36,37,38,39,40]. The results of our study were in line with these observations, similar results concerning the percentage of mTFA outliers had been reported for PSI before [41]. Interestingly, an improvement in the accuracy of the femoral component in PSI has been reported in a meta analysis [16]. Coincident, the risk for tibial malalignment was found to be increased, which is in accordance with the findings of our study, although we did not measure the femoral positioning [16, 42]. Yamamura et al. reported that in PSI, CT-based 3D-measurements demonstrated vast differences between the preoperative planning of the implants and the actual position of the implants after the operation, particularly for the tibial component [43]. But other authors described an improved tibial component rotation using PSI [44]. Different factors can potentially influence tibial component position in PSI and render different study results, such as the preoperative planning and imaging modalities, manufacturing process and material characteristics of patient-specific cutting guides as well as their intraoperative positioning. In PSI, financial aspects and decreased operation times have to be considered, too.
Our study has several limitations. The follow-up was restricted to three postoperative months. But as previously reported, no further change in mTFA alignment after TKA could be observed after three months [22]. Nevertheless, clinical relevant findings may emerge in the long run. The current study was limited to radiological analysis and did not evaluate clinical parameters. The clinical relevance is given by the analysis of outliers. Furthermore, we only analyzed the frontal tibial positioning and did not measure the sagittal tibial and femoral alignment. Because MPTA did not significantly change in the extramedullary and PSI group despite observing significant changes in both groups concerning mTFA, femoral component alignment may have an important impact on whole leg alignment. On the other hand, femoral positioning is highly dependent on tibial alignment in the tibia-first technique, which was used in this study. Nevertheless, a future study with the same setup should analyze the accuracy of the femoral alignment and its impact on whole-leg alignment in all four techniques. Moreover, two different TKA systems were used in this study. However, when performing the study, there was no single TKA system for all four techniques available. Therefore, to minimize a possible systematic error, two TKA systems of the same producer were employed.
Conclusions
In this study, four different techniques of tibial resection in TKA performed by one single senior surgeon were directly compared to each other prospectively for the first time. Accuracy of tibial component position was dependent on the technique of tibial instrumentation. Overall alignment in TKA was significantly influenced by the tibial component positioning. Optimal alignment can only be achieved with the highest precision techniques. As innovative techniques fail to outperform conventional methods, surgeons need to verify and reevaluate their preferred method of tibial instrumentation consistently during TKA.
References
Kim Y-H, Park J-W, Kim J-S, Park S-D (2014) The relationship between the survival of total knee arthroplasty and postoperative coronal, sagittal and rotational alignment of knee prosthesis. Int Orthop 38:379–385
Slevin O, Hirschmann A, Schiapparelli FF, Amsler F, Huegli RW, Hirschmann MT (2018) Neutral alignment leads to higher knee society scores after total knee arthroplasty in preoperatively non-varus patients: a prospective clinical study using 3D-CT. Knee Surg Sport Traumatol Arthrosc 26:1602–1609
Huang NFR, Dowsey MM, Ee E, Stoney JD, Babazadeh S, Choong PF (2012) Coronal alignment correlates with outcome after total knee arthroplasty: five-year follow-up of a randomized controlled trial. J Arthroplast 27:1737–1741
Li Z, Esposito CI, Koch CN, Lee Y, Padgett DE, Wright TM (2017) Polyethylene damage increases with varus implant alignment in posterior-stabilized and constrained condylar knee arthroplasty. Clin Orthop Relat Res 475:2981–2991
Srivastava A, Lee GY, Steklov N, Colwell CW, Ezzet KA, D’Lima DD (2012) Effect of tibial component varus on wear in total knee arthroplasty. Knee 19:560–563
Zeng HB, Ying XZ, Chen GJ, Yang XQ, Lin DD, Li ZJ, Liu HX (2015) Extramedullary versus intramedullary tibial alignment technique in total knee arthroplasty: a meta-analysis of randomized controlled trials. Clinics 70:714–719
Caillouette JT, Anzel SH (1990) Fat embolism syndrome following the intramedullary alignment guide in total knee arthroplasty. Clin Orthop Relat Res. 251:198–199
Maestro A, Harwin SF, Sandoval MG, Vaquero DH, Murcia A (1998) Influence of intramedullary versus extramedullary alignment guides on final total knee arthroplasty component position: a radiographic analysis. J Arthroplast 13:552–558
Todesca A, Garro L, Penna M, Bejui-Hugues J (2017) Conventional versus computer-navigated TKA: a prospective randomized study. Knee Surg Sport Traumatol Arthrosc 25:1778–1783
Anderl W, Pauzenberger L, Kölblinger R, Kiesselbach G, Brandl G, Laky B, Kriegleder B, Heuberer P, Schwameis E (2016) Patient-specific instrumentation improved mechanical alignment, while early clinical outcome was comparable to conventional instrumentation in TKA. Knee Surg Sport Traumatol Arthrosc 24:102–111
Woon JTK, Zeng ISL, Calliess T, Windhagen H, Ettinger M, Waterson HB, Toms AD, Young SW (2018) Outcome of kinematic alignment using patient-specific instrumentation versus mechanical alignment in TKA: a meta-analysis and subgroup analysis of randomised trials. Arch Orthop Trauma Surg 138:1293–1303
Hommel H, Perka C (2015) Gap-balancing technique combined with patient-specific instrumentation in TKA. Arch Orthop Trauma Surg 135:1603–1608
Tsukeoka T, Lee TH, Tsuneizumi Y, Suzuki M (2014) The tibial crest as a practical useful landmark in total knee arthroplasty. Knee 21:283–289
Weiser L, Ruppel AA, Nüchtern JV, Sellenschloh K, Zeichen J, Püschel K, Morlock MM, Lehmann W (2015) Extra- vs. intramedullary treatment of pertrochanteric fractures: a biomechanical in vitro study comparing dynamic hip screw and intramedullary nail. Arch Orthop Trauma Surg 135:1101–1106
Cheng T, Zhao S, Peng X, Zhang X (2012) Does computer-assisted surgery improve postoperative leg alignment and implant positioning following total knee arthroplasty? a meta-analysis of randomized controlled trials? Knee Surg Sport Traumatol Arthrosc 20:1307–1322
Thienpont E, Schwab P-E, Fennema P (2017) Efficacy of patient-specific instruments in total knee arthroplasty. J Bone Jt Surg 99:521–530
Paley D, Herzenberg JE, Tetsworth K, McKie J, Bhave A (1994) Deformity planning for frontal and sagittal plane corrective osteotomies. Orthop Clin N Am 25:425–465
Gbejuade HO, White P, Hassaballa M, Porteous AJ, Robinson JR, Murray JR (2014) Do long leg supine CT scanograms correlate with weight-bearing full-length radiographs to measure lower limb coronal alignment? Knee 21:549–552
Kannan A, Hawdon G, McMahon S (2012) Effect of flexion and rotation on measures of coronal alignment after TKA. J Knee Surg 25:407–410
Radtke K, Becher C, Noll Y, Ostermeier S (2010) Effect of limb rotation on radiographic alignment in total knee arthroplasties. Arch Orthop Trauma Surg 130:451–457
Schoenmakers DAL, Feczko PZ, Boonen B, Schotanus MGM, Kort NP, Emans PJ (2017) Measurement of lower limb alignment: there are within-person differences between weight-bearing and non-weight-bearing measurement modalities. Knee Surg Sport Traumatol Arthrosc 25:3569–3575
Zahn RK, Fussi J, von Roth P, Perka CF, Hommel H (2016) Postoperative increased loading leads to an alteration in the radiological mechanical axis after total knee arthroplasty. J Arthroplast 31:1803–1807
Chang CB, Choi J-Y, Koh IJ, Seo ES, Seong SC, Kim TK (2010) What should be considered in using standard knee radiographs to estimate mechanical alignment of the knee? Osteoarthr Cartil 18:530–538
Sobti A, Maniar S, Chaudhari S, Shetty V (2015) Reliable and reproducible technique to mark center of ankle in total knee arthroplasty. J Clin Orthop Trauma 6:144–146
Tsukeoka T, Tsuneizumi Y, Lee TH (2013) The effect of rotational fixation error of the tibial cutting guide and the distance between the guide and the bone on the tibial osteotomy in total knee arthroplasty. J Arthroplast 28:1094–1098
Cashman JP, Carty FL, Synnott K, Kenny PJ (2011) Intramedullary versus extramedullary alignment of the tibial component in the Triathlon knee. J Orthop Surg Res 6:44
Feeley I, Hegarty A, Hickey A, Glynn A (2016) Impact of use of intramedullary and extramedullary guides on tibial component geometry in total knee replacements: a systematic review and meta-analysis. J Knee Surg 29:487–496
Rahm S, Camenzind RS, Hingsammer A, Lenz C, Bauer DE, Farshad M, Fucentese SF (2017) Postoperative alignment of TKA in patients with severe preoperative varus or valgus deformity: is there a difference between surgical techniques? BMC Musculoskelet Disord 18(1):272
Jung W-H, Seo J-G, Kim DH, Balabadra S, Mandot U, Kumar D (2020) Optimal rotational positioning of tibial component in total knee arthroplasty: determined by linker surgical technique using a high definition CT. Arch Orthop Trauma Surg 140(3):401–408
Blakeney WG, Khan RJK, Wall SJ (2011) Computer-assisted techniques versus conventional guides for component alignment in total knee arthroplasty: a randomized controlled trial. J Bone Jt Surg—Ser A 93:1377–1384
Zhu M, Lindsay E, Keenan A, Monk P, Munro J (2019) The use of accelerometer-based navigation for coronal TKA alignment: a prospective, single surgeon comparative study. Arch Orthop Trauma Surg. https://doi.org/10.1007/s00402-019-03295-4
Huang T-W, Peng K-T, Huang K-C, Lee MS, Hsu RW-W (2014) Differences in component and limb alignment between computer-assisted and conventional surgery total knee arthroplasty. Knee Surg Sport Traumatol Arthrosc. 22:2954–2961
Loh B, Chen JY, Yew AKS, Pang HN, Tay DKJ, Chia SL, Lo NN, Yeo SJ (2017) The accuracy of a hand-held navigation system in total knee arthroplasty. Arch Orthop Trauma Surg 137:381–386
Petursson G, Fenstad AM, Gøthesen Ø, Dyrhovden GS, Hallan G, Röhrl SM, Aamodt A, Furnes O (2018) Computer-assisted compared with conventional total knee replacement. J Bone Jt Surg 100:1265–1274
Kim Y-H, Park J-W, Kim J-S (2018) 2017 Chitranjan S Ranawat Award. Clin Orthop Relat Res 476:6–15
Kosse NM, Heesterbeek PJC, Schimmel JJP, van Hellemondt GG, Wymenga AB, Defoort KC (2018) Stability and alignment do not improve by using patient-specific instrumentation in total knee arthroplasty: a randomized controlled trial. Knee Surg Sports Traumatol Arthrosc 26:1792–1799
Maus U, Marques CJ, Scheunemann D, Lampe F, Lazovic D, Hommel H, Vogel D, Haunschild M, Pfitzner T (2018) No improvement in reducing outliers in coronal axis alignment with patient-specific instrumentation. Knee Surg Sport Traumatol Arthrosc 26:2788–2796
Lustig S, Scholes CJ, Oussedik SI, Kinzel V, Coolican MRJ, Parker DA (2013) Unsatisfactory accuracy as determined by computer navigation of VISIONAIRE patient-specific instrumentation for total knee arthroplasty. J Arthroplast 28:469–473
Sassoon A, Nam D, Nunley R, Barrack R (2015) Systematic review of patient-specific instrumentation in total knee arthroplasty: new but not improved. Clin Orthop Relat Res 473:151–158
Cavaignac E, Pailhé R, Laumond G, Murgier J, Reina N, Laffosse JM, Bérard E, Chiron P (2015) Evaluation of the accuracy of patient-specific cutting blocks for total knee arthroplasty: a meta-analysis. Int Orthop 39:1541–1552
Anwar R, Kini SG, Sait S, Bruce WJM (2016) Early clinical and radiological results of total knee arthroplasty using patient-specific guides in obese patients. Arch Orthop Trauma Surg 136:265–270
Huijbregts HJTAM, Khan RJK, Sorensen E, Fick DP, Haebich S (2016) Patient-specific instrumentation does not improve radiographic alignment or clinical outcomes after total knee arthroplasty. Acta Orthop 87:386–394
Yamamura K, Minoda Y, Mizokawa S, Ohta Y, Sugama R, Nakamura S, Ueyama H, Nakamura H (2017) Novel alignment measurement technique for total knee arthroplasty using patient specific instrumentation. Arch Orthop Trauma Surg 137:401–407
Heyse TJ, Tibesku CO (2015) Improved tibial component rotation in TKA using patient-specific instrumentation. Arch Orthop Trauma Surg 135:697–701
Acknowledgements
Open Access funding provided by Projekt DEAL.
Author information
Authors and Affiliations
Corresponding author
Ethics declarations
Conflict of interest
All authors declare that they have no conflict of interest.
Additional information
Publisher's Note
Springer Nature remains neutral with regard to jurisdictional claims in published maps and institutional affiliations.
Rights and permissions
Open Access This article is licensed under a Creative Commons Attribution 4.0 International License, which permits use, sharing, adaptation, distribution and reproduction in any medium or format, as long as you give appropriate credit to the original author(s) and the source, provide a link to the Creative Commons licence, and indicate if changes were made. The images or other third party material in this article are included in the article's Creative Commons licence, unless indicated otherwise in a credit line to the material. If material is not included in the article's Creative Commons licence and your intended use is not permitted by statutory regulation or exceeds the permitted use, you will need to obtain permission directly from the copyright holder. To view a copy of this licence, visit http://creativecommons.org/licenses/by/4.0/.
About this article

Cite this article
Zahn, R.K., Graef, F., Conrad, J.L. et al. Accuracy of tibial positioning in the frontal plane: a prospective study comparing conventional and innovative techniques in total knee arthroplasty. Arch Orthop Trauma Surg 140, 793–800 (2020). https://doi.org/10.1007/s00402-020-03389-4
Received:
Published:
Issue Date:
DOI: https://doi.org/10.1007/s00402-020-03389-4