
Abstract
The total column water vapor (TCWV) over the Tibetan Plateau (TP) is one important indicator of the Asian water tower, and the changes in the TCWV are vital to the climate and ecosystem in downstream regions. However, the observational data is insufficient to understand the changes in the TCWV due to the high elevation of the TP. Satellite and reanalysis data can be used as substitutes, but their quality needs to be evaluated. In this study, based on a homogenized radiosonde data set, a comprehensive evaluation of the TCWV over the TP derived from two satellite data sets (AIRS-only and AIRS/AMSU) and seven existing reanalysis data sets (MERRA, MERRA2, NCEP1, NCEP2, CFSR, ERA-I, JRA55) is performed in the context of the climatology, annual cycle and interannual variability. Both satellite data sets reasonably reproduce the characteristics of the TCWV over the TP. All reanalysis data sets perform well in reproducing the annual mean climatology of the TCWV over the TP (R = 0.99), except for NCEP1 (R = 0.96) and NCEP2 (R = 0.92). ERA-I is more reliable in capturing the spatial pattern of the annual cycle (R = 0.94), while NCEP1 shows the lowest skill (R = 0.72). JRA55 performs best in capturing the features of the interannual coherent variation (EOF1, R = 0.97). The skill-weighted ensemble mean of the reanalysis data performs better than the unweighted ensemble mean and most of the single reanalysis data sets. The evaluation provides essential information on both the strengths and weaknesses of the major satellite and reanalysis data sets in measuring the total column water vapor over the TP.
1 Introduction
Water vapor plays a key role in Earth’s energy and water cycles through its complex interaction with the clouds and precipitation (Chahine 1992; Oki and Kanae 2006). It is also crucial to climate change, as water vapor is one of the most important greenhouse gases (Lacis et al. 2010). Given the importance of atmospheric water vapor, an international project aimed at the evaluation of the current water vapor data products has been launched, which is called the Global Energy and Water Cycle Exchanges project (GEWEX) water vapor assessment (G-VAP) (Schröder et al. 2016, 2018). There are many acronyms for atmospheric water vapor, such as TCWV (total column water vapor), PWAT (precipitable water vapor), TPW (total precipitable water vapor), IPW (integrated precipitable water vapor) and IWV (integrated water vapor). Consistent with G-VAP, the acronym of TCWV is used in this work. The availability of reliable TCWV data is crucial for understanding the water cycle.
The Tibetan Plateau (referred to as TP hereinafter) is known as the Asian water tower, as it has the most glaciers in the world except for the polar regions (Xu et al. 2008, 2014; Yao et al. 2012). Water vapor as well as its cycle process over the TP is vital to the climate and ecosystem in downstream regions (Yao et al. 2012). Although the water vapor over the TP is important, our knowledge of its changes is limited due to the lack of observational data. Because of the complex terrain, it is a challenge to establish and maintain in situ observations in the TP. Both satellite and reanalysis data are hoped to be useful substitutes, but their quality need to be assessed.
The quality of the satellite data and reanalysis data in the TP has been evaluated in previous studies, but the results are difficult to compare with each other due to the different data used and different time periods and domains considered, as well as the different data processing methods and statistical metrics applied (Wang and Zeng 2012; You et al. 2015; Zhang et al. 2018). These previous studies focused on several data sets, including TRMM and GPM as satellite data, as well as MERRA, NCEP1, NCEP2, CFSR, ERA-40, ERA-Interim, and GLDAS as reanalysis data. In recent years, new versions of satellite data including AIRS version 6 have been released, and more reanalysis data sets including JRA55 and MERRA2 have been updated (Tian et al. 2013b, 2019; Kobayashi et al. 2015; Gelaro et al. 2017). The TCWV derived from 4 satellite data sets including AIRS version 6 and 4 reanalysis data sets including JRA55 has been assessed, but the temporal and spatial coverage of the study was limited, only including the summer season and the southern plateau along the Himalayas (Wang et al. 2017). It is thus urgently needed to provide a comprehensive evaluation of the existing satellite products and reanalysis data sets for the representation of the TCWV over the whole plateau, based on the same observational metrics.
In this paper, we aim to evaluate the quality of two satellite data sets and seven updated reanalysis data sets based on one homogenized radiosonde data set. The scientific questions we considered are: (1) In comparison to the radiosonde data, how reliable are the two satellite data sets (AIRS-only and AIRS/AMSU) in capturing the TCWV features over the TP? (2) When compared to the observational data and satellite product sets, which reanalysis data set performs better in reproducing the annual mean climatology, annual cycle and interannual variability of the TCWV over the TP? (3) Can we construct a skill-weighted ensemble mean of the reanalysis data that outperforms the unweighted ensemble mean and most of the single reanalysis data sets, taking all time scales into account?
The remainder of the paper is organized as follows: the data and method used are introduced in Sects. 2, 3 presents the assessment of the satellite and reanalysis data, as well as the skill-weighted ensemble mean of the reanalysis data, and the major results are summarized in Sect. 4.
2 Data and method description
2.1 Data description
-
1.
Radiosonde data
In our analysis, the NOAA homogenized radiosonde data “HomoRaw” is used to assess the quality of both the satellite products and reanalysis data (Dai et al. 2011). The data was processed to produce a more accurate and reliable humidity data set for global water budget and climate change research. The homogenization method introduced in Dai et al. (2011) was applied mainly on the NOAA/NCDC IGRA (Integrated Global Radiosonde Archive) (Durre et al. 2006), containing the CARDS (Comprehensive Aerological Reference Dataset) data and a special radiosonde data set from China (Dai et al. 2011). The data set is available from January 1945, and we used the period of January 2003 to December 2012 in this study. The TP radiosonde stations were defined as stations within the Plateau (26°N–40°N, 70°E–105°E) with an altitude above 2650 m. Eight stations were finally chosen, which are located in the central and eastern parts of the TP (Fig. 1). As in situ observations of the tropospheric total column water vapor, the radiosonde data set will be used as a reference for the quality assessment of the satellite and reanalysis data sets in the following analysis.
Fig. 1 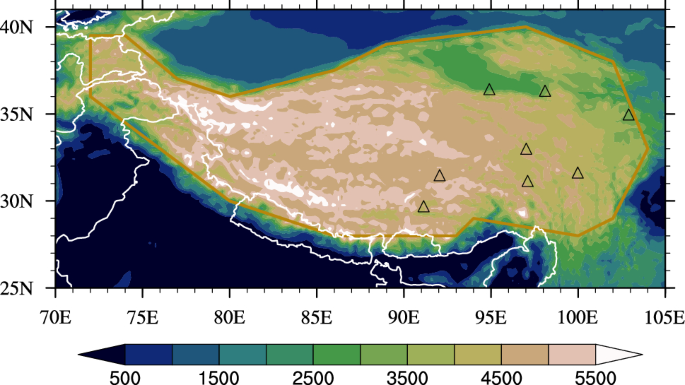
Terrain height of the Tibetan Plateau (color shading, units: m) and locations of radiosonde stations (black triangles). The darkgoldenrod lines represent the edges of the TP
-
2.
Satellite data: AIRS-only and AIRS/AMSU from satellite Aqua
The Atmospheric Infrared Sounder (AIRS) and the Advanced Microwave Sounding Unit (AMSU) are instruments aboard the Aqua satellite, provided by NASA as a part of the Earth Observation System (EOS) (Aumann et al. 2003; Lambrigtsen 2003; Chahine et al. 2006). As a Sun-synchronous polar orbiting satellite, Aqua crosses the Equator from the Southern Hemisphere (SH) to the Northern Hemisphere (NH) at local time 13:30, representing daytime observations, and crosses the equator from NH to SH at local time 01:30, representing nighttime observations (Aumann et al. 2003; Lambrigtsen 2003). The daily ascending and descending observations are used to get the monthly ascending and descending data, which are then arithmetically averaged to produce the AIRS monthly data products (Tian et al. 2019). The diurnal cycle of the TCWV over the TP peaks in the late afternoon to evening, which is consistent with the diurnal cycle of precipitation. The minimum of the TCWV over the eastern TP occurs at about local time 10:00, and the maximum occurs at 18:00 (Ma et al. 2016). Although the diurnal cycle cannot be fully characterized by twice-daily sampling, the Aqua observation is reliable on a monthly scale. The AIRS and AMSU instruments are each cross-track scanning nadir sounders that are coaligned and have a swath approximately 1650 km wide (Tian et al. 2013a). Due to the 45-km granularity of AMSU and 13.5-km granularity of AIRS, the AIRS/AMSU Level 2 data product is generated with a horizontal resolution of 45 km, including a single AMSU spectrum and nine AIRS spectra. The AIRS-only Level 2 data product is generated with a higher horizontal resolution of 13.5 km. The AIRS-only and AIRS/AMSU data sets are both available from 1 September 2002, but only AIRS-only is updated continually, while AIRS/AMSU ended in 24 September 2016. We use the AIRS version 6 Level 3 (gridded) monthly TPW data products from both AIRS-only and AIRS/AMSU which have a spatial resolution of 1° × 1° for the time period of January 2003 to December 2015 (Tian et al. 2013b; Susskind et al. 2014).
There are some studies that have estimated the quality and error sources of a previous version of AIRS/AMSU (Ver. 5) in terms of the global or regional temperature and humidity (Wu 2009; Tian et al. 2010, 2013a; Diao et al. 2013; Wang et al. 2013; Hearty et al. 2014). AIRS/AMSU (Ver. 5) also has the ability to reproduce the total column water vapor distribution and profile over the TP (Zhang et al. 2012, 2013). Compared to the previous version, version 6 has significant improvements in terms of a greater stability, yield, and quality (Susskind et al. 2003, 2011, 2012, 2014). AIRS version 6 is improved compared with version 5 in terms of the temperature profiles and surface-based inversions over Antarctica (Boylan et al. 2015). The AIRS-only product (Ver. 6) can reproduce the mean TCWV on the global scale (Roman et al. 2016). Through a comparison between radiosonde and satellite data sets, our work is a supplement to the assessment of the quality of the AIRS-only and AIRS/AMSU version 6 products in terms of the regional total column water vapor. These two satellite data sets will also be used as a reference for the assessment of reanalysis data.
-
3.
Reanalysis data: MERRA, MERRA2, NCEP1, NCEP2, CFSR, ERA-I and JRA55
Reanalysis data is widely used in climatology research. It constrains model fields towards observations using a consistent assimilation system. Due to the unaltered model and assimilation system used, reanalysis data can reduce the spurious signals caused by changes in the model or analysis method. At the same time, it shows advantages in many other aspects, such as the time range, spatial coverage and variable types. The details of the seven reanalysis data sets we used are provided in Table 1. The variable TCWV can be obtained from the model output directly. Except for NCEP1 and JRA55, most reanalysis data sets are available from 1979, when the satellite came into service. We used monthly reanalysis data sets during the period of January 2003 to December 2015, the same as for the satellite data sets. Before the assessment, all reanalysis data sets were interpolated into the same grid as the satellite data by using the bilinear interpolation technique. Note that all reanalysis data sets have assimilated AIRS or AMSU radiances during their producing processes, except for the early NCEP1 and NCEP2. The different abilities of the reanalysis data are caused by the different models, assimilation systems or observations.
Table 1 Reanalysis data sets used

2.2 Skill-weighting method
To get a more reasonable estimate of future climate change, a skill- and independence-weighting method for multimodel assessment is developed (Sanderson et al. 2015a, b, 2017; Wuebbles et al. 2017). In this study, we applied the skill-weighting method introduced in Sanderson et al. (2017) to the reanalysis data sets in order to obtain their skill-weighted ensemble mean, taking different time scales into consideration. The weights are calculated based on a distance matrix \(\delta\). In terms of the time scale v, the area-weighted RMSE is calculated between the reanalysis data sets and observational satellite data set, which represents the distance between the data sets. Then, this distance matrix is normalized by the mean interdata set distance in order to get the distance matrix \(\delta_{v}\) for the time scale v. The final distance matrix \(\delta\) is a linear combination of \(\delta_{v}\),
The unified skill weight for data set i is derived as
where A is a normalization constant to make
3 Results
3.1 Evaluation of satellite and reanalysis data
The Tibetan Plateau is one of the most complex terrain areas and is known as the Roof of the World due to its high elevation, especially within the western and southern plateau. Consistent with the topographic features, there are eight defined TP radiosonde stations in total, located in the central and eastern parts of the TP. In the western plateau, where the elevation is above 5 km, there is no radiosonde station as of now due to the tough environment (Fig. 1). Because of the uneven distribution of radiosonde stations, in the following analysis, we first evaluate the satellite and reanalysis data with the radiosonde data as the reference and then choose one satellite data set to evaluate the reanalysis data in terms of the spatial pattern.
As shown in Fig. 2, the annual mean climatology of the TCWV over the TP is between 2 and 12 kg m−2 and decreases from southeast to northwest, which corresponds to the terrain characteristics. The gradient of the total column water vapor is large at the borders of the TP, which is consistent with previous work (Zhang et al. 2013). The quality of the satellite and reanalysis data sets in terms of the annual mean climatology of the TCWV over the TP will be assessed in the following.

Climatology of the annual mean total column water vapor during the period of 2003 to 2012 in a AIRS-only, b AIRS/AMSU, and c–j reanalysis data sets and their simple unweighted ensemble mean (color shading, units: kg m−2). Note that the scale of the color bar is nonlinear. Dots and related numbers represent biases compared to radiosonde data set; blue dots denote positive biases, and red dots denote negative biases (units: kg m−2). Their root-mean-square biases are printed as Bias on the top-right of each panel. R is the spatial correlation coefficient of each reanalysis data set and AIRS/AMSU. All spatial correlation coefficients are statistically significant at the level of 5%
To evaluate the reliability of the two sets of satellite data in capturing the features of the annual mean climatology of the TCWV over the TP, we interpolate the gridded satellite data into each radiosonde location using bilinear interpolation and then calculated the difference between them (dots in Fig. 2a, b). Compared to the radiosonde data, both satellite data sets overestimate the total column water vapor around the Tsaidam Basin (0.28–0.83 kg m−2) and underestimate it in other regions (− 0.10 to − 3.74 kg m−2). The underestimation (− 2 to − 38%) is stronger than the overestimation (5–14%). The root-mean-square bias of the satellite data is 2.25 kg m−2 compared with the radiosonde data and the difference between the two satellite data sets is negligible (Bias on the top-right of Fig. 2a, b). We chose AIRS/AMSU as the reference to evaluate the reanalysis data sets with respect to the spatial distribution of the annual mean TCWV over the TP.
To evaluate the reanalysis data sets in reproducing the spatial pattern of the annual mean climatology of the TCWV over the TP, we calculated the spatial correlation coefficients R between the reanalysis data and satellite data (Fig. 2c–j). Compared to the satellite data (AIRS/AMSU), all reanalysis data can reproduce the spatial distribution of the total column water vapor over the TP (R = 0.96 in NCEP1 and R = 0.99 in the others), except for NCEP2 (R = 0.92). Compared with the radiosonde data, the root-mean-square biases of the reanalysis data are smaller than those of the satellite data, with the smallest bias in MERRA2 (1.83 kg m−2) and the largest bias in JRA55 (2.23 kg m−2). Different from the spatially uneven biases in the other data sets, NCEP1, ERA-I, JRA55 and the unweighted ensemble show a spatially consistent underestimation, with that of NCEP1 the largest, and with a mean bias of − 1.78 kg m−2.
To evaluate the satellite and reanalysis data in capturing the features of the annual cycle of the total column water vapor over the TP, we calculated the root-mean-square error between the radiosonde data and these substitute data sets (RMSE in Fig. 3). As shown in Fig. 3, the annual cycle of the TCWV over the TP presents a unimodal pattern within the range of 2–16 kg m−2 over the whole year, with its peak in July. Compared to the radiosonde data, the satellite and reanalysis data can reproduce the unimodal shape but with some underestimation (RMSE = 1.34–2.12 kg m−2, Fig. 3), which is consistent with the results derived from the analysis of the annual mean climatology (Fig. 2). Of the two satellite data sets, the underestimation in AIRS-only (RMSE = 2.05 kg m−2) is smaller than that in AIRS/AMSU (RMSE = 2.07 kg m−2). Among the reanalysis data sets, the smallest RMSE is 1.34 kg m−2 for MERRA2, while the largest RMSE is 2.12 kg m−2 for JRA55. Because the biases reach their maxima in the warm season (JJAS), we will further evaluate the reanalysis data on their representation of the ratio of the TCWV in JJAS to that over the whole year (Fig. 4). For this purpose and due to its smaller bias, AIRS-only is chosen to be the reference for the following analysis of spatial distribution.

Annual cycle of the total column water vapor over the TP during the period of 2003–2012. The gray boxes are the results from the radiosonde data, and the lines are the results from the satellite and reanalysis data sets. The dispersion of each box means the interannual variability for the corresponding month. Total bias of satellite and reanalysis data sets compared to radiosonde data is printed as RMSE (units: kg m−2)

Total column water vapor over the TP in terms of the annual cycle. a–i Ratio of total column water vapor in June, July, August and September (referred to as JJAS hereinafter) to the annual total TCWV during the period of 2003 to 2012 in AIRS-only and reanalysis data sets. All spatial correlation coefficients are statistically significant at the level of 5%. Note that the scale of the colorbar is nonlinear
To evaluate the reanalysis data in terms of the spatial distribution of the annual cycle features, we calculated the spatial correlation coefficients and RMSE between the reanalysis data and AIRS-only (Fig. 4). The rate of the TCWV in the JJAS to the annual total is above 54% over the TP, with a band of high value extending from the southwestern to the northeastern plateau. There are two high-value centers located over the southwestern plateau and Qilian Mountains. Compared to AIRS-only, most of the reanalysis data sets can reproduce the spatial distribution of the seasonal concentration of the TCWV over the TP (R = 0.84–0.94, RMSE = 0.02–0.04), except for NCEP1 (R = 0.72, RMSE = 0.07) and NCEP2 (R = 0.78, RMSE = 0.04). NCEP1 overestimates the seasonal concentration and produces a spurious concentration center in the middle-northern plateau (Fig. 4d), while NCEP2 cannot reproduce the southwestern plateau center and Qilian Mountains center (Fig. 4e).
In summary, both the satellite and reanalysis data show their ability of reproducing the annual cycle of the total column water vapor over the TP, except for NCEP1 and NCEP2. AIRS-only performs better than AIRS/AMSU, and ERA-I and MERRA2 outperform the other reanalysis data sets.
In Fig. 3, the dispersion bars of each box indicate the interannual variability of the TCWV in the corresponding month. The largest variability is seen in the boreal summer, so the following analysis of the interannual variability will be based on the boreal summer data (JJA mean).
To clarify the reliability of the satellite and reanalysis data in capturing the interannual variability features of the TCWV over the TP, we calculated the correlation coefficients between the standardized time series derived from the radiosonde data and those derived from the substitute data sets (R in Fig. 5a). As shown in Fig. 5a, both the satellite and reanalysis data are consistent with the radiosonde data in terms of the interannual variability (R = 0.72–0.91). Of the satellite data, AIRS/AMSU has a higher correlation coefficient with the radiosonde data (R = 0.87) than AIRS-only does (R = 0.85). Although NCEP1 and NCPE2 perform poorly in terms of the annual mean and annual cycle (Figs. 2, 3, and 4), they stand out for the interannual variability (R = 0.90, 0.91, respectively), while ERA-I and MERRA2 show the lowest correlation coefficients with the radiosonde data in terms of the interannual variability (R = 0.72, 0.84, respectively). This indicates that each reanalysis data set has its own advantages on particular time scales, and a skill-weighted ensemble mean of the reanalysis data should be considered to get an overall estimate, which is further explored in Sect. 3.2. AIRS/AMSU will be used as a reference for the following spatial distribution related analysis due to its higher correlation with the radiosonde data.

Total column water vapor over the TP in terms of the interannual variability. a Time series of detrended total column water vapor over the TP in the summer during the period of 2003–2012 (units: kg m−2). R represents the correlation coefficient between the radiosonde and satellite or reanalysis data. All correlation coefficients are statistically significant at the level of 5%. b–j Relative interannual variability of the total column water vapor in the summer over the TP during the period of 2003–2012 in AIRS/AMSU and the reanalysis data sets. For each grid, the series has been detrended and the standard deviation has been scaled by the summer mean total column water vapor. All spatial correlation coefficients are statistically significant at the level of 5%
To evaluate the reanalysis data in reproducing the spatial pattern of the interannual variability, the relative interannual variability is calculated, which is defined as the standard deviation of the interannual variability divided by the climatology (Fig. 5b–j). The least squares linear trend of each grid has been removed before the calculation. As shown in Fig. 5b, the relative interannual variability of the total column water vapor over the TP is between 1 and 9%, increasing from the southern plateau to western and northeastern plateau. The maximum of relative interannual variability occurs over the western and northern plateaus. Compared to the satellite data (AIRS/AMSU), the reanalysis data sets overestimate the relative interannual variability due to the underestimation of the climatology (Fig. 5c–j). NCEP1 and NCEP2 lose their advantages in reproducing the spatial pattern of the interannual variability (R = 0.72 and 0.84, respectively), as the satellite data were not assimilated. The ensemble mean shows its advantages of comprehensiveness with respect to the relative interannual variability, with the highest spatial correlation coefficient of 0.93 and lowest RMSE of 0.02. MERRA, MERRA2 and JRA55 also perform well in reproducing the spatial pattern of the relative interannual variability of the summer total column water vapor over the TP (R = 0.92, 0.91, and 0.91, respectively).
In summary, both the satellite data and reanalysis data can reproduce the interannual variability of the summer total column water vapor over the TP. AIRS/AMSU performs better than AIRS-only. In terms of the interannual variability series, NCEP1 or NCEP2 is the best choice, but for the spatial relative interannual variability, the simple unweighted ensemble mean, MERRA, MERRA2 and JRA55 are recommended. Because the difference between AIRS-only and AIRS/AMSU is negligible, we will choose AIRS-only as a reference in the following analysis due to its continual update.
To clarify the interannual spatial coherent variation pattern of the TCWV over the TP, the empirical orthogonal function (EOF) analysis has been applied to the AIRS-only and reanalysis data sets (Figs. 6, 7). As shown in Fig. 6a, the first mode of the EOF analysis is the zonal dipole pattern, divided at approximately 89°E. Compared to the satellite data (Fig. 6c–j), all reanalysis data can reproduce the spatial pattern of the first mode (R = 0.89–0.97), although a moderate bias in the shape of the anomalies is seen in NCEP1 (R = 0.89) and NCEP2 (R = 0.94). For the interannual variability related to the zonal dipole pattern, JRA55 is the best choice (R = 0.97, RMSE = 0.26), followed by MERRA2, the simple unweighted ensemble mean, MERRA, CFSR, ERA-I, NCEP2 and NCEP1. This mode explains 55.46% of the total variance and represents the major coherent pattern of the interannual variability of the summer total column water vapor over the TP. The correlation coefficient between PC1 and the All Indian Rainfall Index (AIRI, Mooley and Parthasarathy 1984; Parthasarathy et al. 1994), which is widely used as an indicator of the strength of the South Asia Monsoon (SAM), is -0.92 and statistically significant at the level of 1%. Hence, the variability of this zonal dipole pattern is related to the variation of the SAM. In years of a strong SAM, the intensified monsoon circulation brings more water vapor from tropical oceans and causes anomalous positive precipitation in India. More water vapor is transported into the southeastern plateau through the Yarlung Zangbo canyon, which leads to an increase in the total column water vapor storage over the southeastern TP.

The first mode of the empirical orthogonal function (EOF) and its principal component (PC) series of detrended summer total column water vapor over the TP during the period of 2003–2015. The PC series is derived from AIRS-only and then projected onto the reanalysis data sets. Dots mean statistical significance at the level of 5%. R is the spatial correlation coefficient between the mode in each reanalysis data set and in AIRS-only. All spatial correlation coefficients are statistically significant at the level of 5%

The same as Fig. 6 but for the second mode. All spatial correlation coefficients are statistically significant at the level of 5%
The second mode of the EOF analysis is shown in Fig. 7. Revealed by the satellite data (Fig. 7a), the second EOF mode is the consistent change in the total column water vapor in the main body of the plateau, especially over the northern plateau, which is opposite the southern edge of the Himalayas. The second mode explains approximately 25.10% of the total variance. In general, compared to the AIRS-only (Fig. 7c–j), the performance of the reanalysis data in reproducing the second mode is lower than that in reproducing the first mode, characterized by the lower spatial correlation coefficients (R = 0.63–0.93). Reanalysis data sets of low quality show a common weakness in reproducing the opposite variability along the southern edge of the Himalayas to the main body of the TP, taking MERRA, NCEP1 and NCEP2 as examples (R = 0.63–0.78). For the second mode of the EOF analysis, the best choice is JRA55 (R = 0.93, RMSE = 0.21), followed by MERRA2, the simple unweighted ensemble mean, ERA-I, CFSR, NCEP2, MERRA and NCEP1.
The maximum uncertainty of the reanalysis data sets in terms of the annual mean climatology, annual cycle and interannual variability during the period of 2003 to 2015 is located along the edges of the TP (not shown). These regions of high uncertainty should be given priority when new observation stations are planned.
3.2 Skill-weighted ensemble mean of reanalysis data
The above analysis shows that the reanalysis data of the best reliability varies with the different time scales considered, which implies that a skill-weighted ensemble mean of all reanalysis data sets should be constructed such that all time scales can be taken into account. To obtain the skill weight of each set of reanalysis data, the distance matrix of each reanalysis data set compared to AIRS-only in terms of the climatology, annual cycle and interannual coherent variation is calculated and shown in Fig. 8a by using the method introduced in Sect. 2.2. In Fig. 8a, blue squares represent a high quality of reanalysis data while red squares represent a low quality. For the climatology of the annual mean (the bottom row in Fig. 8a), MERRA2 shows the best performance, followed by MERRA, CFSR, ERA-I and JRA55. NCEP1 and NCEP2 are inadequate for reproducing the climatology of the annual mean total column water vapor over the TP. For the annual cycle, ERA-I shows the best performance, followed by CFSR, JRA55, MERRA2, MERRA and NCEP2. NCEP1 is inadequate for reproducing the annual cycle of the total column water vapor over the TP. For the interannual coherent variation, JRA55 shows the best performance, followed by ERA-I, NCEP2, MERRA2, NCEP1, MERRA and CFSR. In terms of all time scales mentioned above combined (the top row in Fig. 8a), ERA-I and JRA55 perform better than the other reanalysis data sets, followed by MERRA2, MERRA, CFSR, NCEP2 and NCEP1 (Fig. 8a). These results are used to calculate the final skill weight for each reanalysis data set.

a The distance matrix of the reanalysis data sets compared to AIRS-only for different time scales and their combined average. Each column represents a reanalysis data set, and each row represents a different time scale. b Taylor diagram for the assessment of the reanalysis data sets and their ensemble mean in reproducing the total column water vapor over the TP. AIRS-only is used as a reference. Different colors and markers represent different time scales, including the annual mean climatology, annual cycle (the ratio of JJAS to annual total TCWV), and interannual variability (EOF patterns) during the period of 2003–2015
To obtain the final weighted ensemble mean of the reanalysis data sets, we calculated the unified skill weight for each reanalysis data set using the information mentioned above (Fig. 8a) and the method introduced in Sect. 2.2. As a result, the skill weights for MERRA, MERRA2, NCEP1, NCEP2, CFSR, ERA-I and JRA55 are 0.12, 0.16, 0.06, 0.10, 0.14, 0.22 and 0.21, respectively, in line with their quality depicted in Fig. 8a. These skill weights are used to construct the skill ensemble mean of the reanalysis data.
The skill-weighted ensemble mean of the reanalysis data is then constructed using the weights above. To evaluate its performance compared with the single reanalysis data sets as well as the simple unweighted ensemble mean, a Taylor diagram is applied, as shown in Fig. 8b. The Taylor diagram can summarize different data performance levels in different cases and enable us to concentrate on the main points. The closer a marker is to the REF point, the better the corresponding data set performance (Taylor 2001). As shown in Fig. 8b, the reanalysis data has the ability to reproduce the total column water vapor over the TP in general, as all spatial correlation coefficients are above 0.6. In detail, the reanalysis data is more reliable in the analysis of the annual mean climatology, as all spatial correlation coefficients are above 0.9 and the standard deviations are almost the same as in the observation (AIRS-only), except for NCEP1 and NCEP2. In terms of the annual cycle, the spatial correlation coefficients are all above 0.7, but the standard deviations are larger in the reanalysis than in the observation (REF > 1.00). ERA-I performs best in reproducing the annual cycle of the total column water vapor over the TP. NCEP1 performs worst, as its standard deviation is twice as large as the observation. In terms of the interannual coherent variation, the reanalysis data reproduce the EOF1 pattern well, as all spatial correlation coefficients are above 0.9, except for NCEP1. JRA55 is the best choice for the analysis related to this west–east coherent variation pattern. Compared with EOF1, the spatial correlation coefficients in terms of EOF2 show a larger dispersion between 0.6 and 0.95. JRA55 and MERRA2 are the best choices for an analysis related to this spatially consistent variation pattern, while NCEP1, NCEP2 and MERRA are not recommended.
Clearly, the single reanalysis data set with the best reliability varies for different time scales considered, so the skill-weighted ensemble mean of the reanalysis data is constructed and evaluated. Compared with the simple unweighted ensemble mean, the skill-weighted ensemble mean of the reanalysis data shows a better performance. To be specific, as a result of the skill weighting, the spatial correlation coefficients between the ensemble mean of the reanalysis data and the observation data increase from 0.991, 0.887, 0.965, and 0.919 to 0.993, 0.899, 0.967, and 0.938 for the climatology, annual cycle, EOF1 and EOF2, respectively. The skill-weighted ensemble mean also performs better than most of the single reanalysis data sets, especially for EOF2 (Fig. 8b). Thus, we recommend the application of the skill-weighted ensemble mean of the reanalysis data in future studies on the water cycle over the TP, as it integrates different time scales and performs better than the simple unweighted ensemble mean.
The spatial patterns of the TCWV over the TP in terms of the annual mean climatology, annual cycle and interannual coherent variation calculated with the constructed data are shown in Fig. 9. The decreasing trend of the annual mean TCWV from the southeastern plateau to the northwestern plateau and the two centers of the TCWV seasonal concentration, as well as the two leading modes of interannual variability, can be reproduced in the newly constructed data set (Fig. 9).

The total column water vapor over the Tibetan Plateau in terms of the a annual mean climatology, b annual cycle, and c, d interannual coherent variation patterns calculated with the skill-weighted ensemble mean of the reanalysis data sets during the period of 2003–2015
4 Conclusion
Based on radiosonde observation data, our work provides a comprehensive assessment of two state-of-the-art satellite data sets (version 6 of AIRS-only and AIRS/AMSU) and seven existing reanalysis data sets (MERRA, MERRA2, NCEP1, NCEP2, CFSR, JRA55, ERA-Interim) in capturing the annual mean climatology, annual cycle and interannual variability features of the TCWV over the TP. A skill-weighted ensemble mean of the reanalysis data sets is also constructed and evaluated. The main results are summarized as follows:
The satellite data sets of both version 6 of AIRS-only and AIRS/AMSU have the ability to reproduce the characteristics of the total column water vapor over the TP, and the difference between them is negligible. The AIRS-only version 6 can be used as a substitute for in situ observation in a related analysis of a longer time period due to its high horizontal resolution and continual update.
The quality of the reanalysis data (MERRA, MERRA2, NCEP1, NCEP2, CFSR, ERA-I, JRA55) varies with the time scale considered. In detail, all of them perform well in reproducing the annual mean climatology of the total column water vapor over the TP, except for NCEP1 and NCEP2. ERA-I is more reliable for the analysis of the annual cycle, while NCEP1 is not recommended. In terms of the interannual variability, JRA55, ERA-I, MERRA2 and CFSR are recommended, whereas NCEP1 is not reliable. Generally, the reanalysis data sets of the third generation (ERA-I and JRA55) perform better due to improvements in the model, assimilation system and observations assimilated.
To integrate the different performances of the reanalysis data on different time scales, we constructed a skill-weighted ensemble mean of the reanalysis data, which performs better than the simple unweighted ensemble mean and most of the single reanalysis data sets. The skill weights for MERRA, MERRA2, NCEP1, NCEP2, CFSR, ERA-I and JRA55 are 0.12, 0.16, 0.06, 0.10, 0.14, 0.22 and 0.21, respectively. The application of the skill-weighted ensemble mean of the reanalysis data is recommended in future studies of the water cycle over the TP, as it takes different time scales into account.
There is a striking contrast between the importance of the Tibetan Plateau to the global climate and the lack of abundant in situ observations. Our analysis provides essential information on both the strengths and weaknesses of the existing substitutes for the observational data, including satellite products and reanalysis data. The work can also supplement the G-VAP results from the perspective of the regional Asian water tower.
References
Aumann HH, Chahine MT, Gautier C, Goldberg MD, Susskind J (2003) AIRS/AMSU/HSB on the Aqua mission: design, science objective, data products, and processing systems. IEEE Trans Geosci Remote Sens 41(2):253–264. https://doi.org/10.1109/TGRS.2002.808356
Boylan P, Wang J, Cohn SA, Fetzer E, Maddy ES, Wong S (2015) Validation of AIRS version 6 temperature profiles and surface-based inversions over Antarctica using Concordiasi dropsonde data. J Geophys Res Atmos 120(3):992–1007. https://doi.org/10.1002/2014JD022551
Chahine MT (1992) The hydrological cycle and its influence on climate. Nature 359(6394):373–380. https://doi.org/10.1038/359373a0
Chahine Pagano MT, Aumann TS, Atlas HH, Barnet Robert, Blaisdell Christopher et al (2006) AIRS improving weather forecasting and providing new data on greenhouse gases. Bull Am Meteorol Soc 87(7):238. https://doi.org/10.1175/BAMS-87-7-911
Dai A, Wang J, Thorne PW, Parker DE, Haimberger L, Wang XL (2011) A new approach to homogenize daily radiosonde humidity data. J Clim 24(2):965–991. https://doi.org/10.1175/2010JCLI3816.1
Dee DP et al (2011) The ERA-Interim reanalysis: configuration and performance of the data assimilation system. Q J R Meteorol Soc 137:553–597. https://doi.org/10.1002/qj.828
Diao M, Jumbam L, Sheffield J, Wood EF, Zondlo MA (2013) Validation of AIRS/AMSU-A water vapor and temperature data with in situ aircraft observations from the surface to UT/LS from 87°N–67°S. J Geophys Res Atmos 118(12):6816–6836. https://doi.org/10.1002/jgrd.50483
Durre I, Vose RS, Wuertz DB (2006) Overview of the integrated global radiosonde archive. J Clim 19(1):53–68. https://doi.org/10.1175/JCLI3594.1
Gelaro R, Mccarty W, Suárez Max J, Todling R, Molod A, Takacs L et al (2017) The modern-era retrospective analysis for research and applications, version 2 (MERRA-2). J Clim 30(14):5419–5454. https://doi.org/10.1175/JCLI-D-16-0758.1
Hearty TJ, Savtchenko A, Tian BJ, Fetzer E, Yung YL, Theobald M et al (2014) Estimating sampling biases and measurement uncertainties of AIRS/AMSU-A temperature and water vapor observations using MERRA reanalysis. J Geophys Res Atmos. https://doi.org/10.1002/2013jd021205
Kalnay et al (1996) The NCEP/NCAR 40-Year Reanalysis Project. Bull Am Meteorol Soc 77(3):437–471. https://doi.org/10.1175/1520-0477(1996)077%3c0437:TNYRP%3e2.0.CO;2
Kanamitsu M et al (2002) NCEP-DOE AMIP-II Reanalysis (R-2). Bull Am Meteorol Soc 83(11):1631–1643. https://doi.org/10.1175/bams-83-11-1631
Kobayashi S, Ota Y, Harada Y, Ebita A, Moriya M, Onoda H et al (2015) The JRA-55 reanalysis: general specifications and basic characteristics. J Meteorol Soc Jpn Ser II 93(1):5–48. https://doi.org/10.2151/jmsj.2015-001
Lacis AA, Schmidt GA, Rind D, Ruedy RA (2010) Atmospheric CO2: principal control knob governing Earth’s temperature. Science 330(6002):356–359. https://doi.org/10.1126/science.1190653
Lambrigtsen BH (2003) Calibration of the AIRS microwave instruments. IEEE Trans Geosci Remote Sens 41(2):369–378. https://doi.org/10.1109/TGRS.2002.808247
Ma S, Zhou S, Wang S et al (2016) Diurnal variation characteristics of GPS-retrieved precipitable water vapor over Mid-east Xizang in summer (in Chinese). Plateau Meteorol 35(2):318–328. https://doi.org/10.7522/j.issn.1000-0534.2015.00007
Mooley DA, Parthasarathy B (1984) Fluctuation in all-India summer monsoon rainfall during 1871–1985. Clim Change 6(3):287–301. https://doi.org/10.1007/bf00142477
Oki T, Kanae S (2006) Global hydrological cycles and world water resources. Science 313(5790):1068–1072. https://doi.org/10.1126/science.1128845
Parthasarathy B, Munot AA, Kothawale DR (1994) All-India monthly and seasonal rainfall series: 1871–1993. Theor Appl Climatol 49(4):217–224. https://doi.org/10.1007/bf00867461
Rienecker MM, Suarez MJ, Gelaro R, Todling R, Bacmeister JT, Liu E et al (2011) MERRA: NASA’s modern-era retrospective analysis for research and applications. J Clim 24(14):3624–3648. https://doi.org/10.1016/j.forpol.2005.06.006
Roman J, Knuteson R, August T, Hultberg T, Revercomb H (2016) A global assessment of NASA AIRS v6 and EUMETSAT IASI v6 precipitable water vapor using ground-based GPS SuomiNet stations: IR PWV assessment. J Geophys Res Atmos. https://doi.org/10.1002/2016jd024806
Saha S et al (2010) The NCEP climate forecast system reanalysis. Bull Am Meteorol Soc 91(8):1015–1057. https://doi.org/10.1175/2010BAMS3001.1
Sanderson BM, Knutti R, Caldwell P (2015a) Addressing interdependency in a multimodel ensemble by interpolation of model properties. J Clim 28(13):5150–5170. https://doi.org/10.1175/JCLI-D-14-00361.1
Sanderson BM, Knutti R, Caldwell P (2015b) A representative democracy to reduce interdependency in a multimodel ensemble. J Clim 28(13):5171–5194. https://doi.org/10.1175/jcli-d-14-00362.1
Sanderson BM, Wehner M, Knutti R (2017) Skill and independence weighting for multi-model assessment. Geosf Model Dev 10(6):2379–2395. https://doi.org/10.5194/gmd-10-2379-2017
Schröder M, Lockhoff M, Forsythe JM et al (2016) The GEWEX water vapor assessment: results from intercomparison, trend, and homogeneity analysis of total column water vapor. J Appl Meteorol Climatol. https://doi.org/10.1175/jamc-d-15-0304.1
Schröder M, Lockhoff M, Fell F et al (2018) The GEWEX Water Vapor Assessment archive of water vapour products from satellite observations and reanalyses. Earth Syst Sci Data 10(2):1093–1117. https://doi.org/10.5194/essd-10-1093-2018
Susskind J, Barnet CD, Blaisdell JM (2003) Retrieval of atmospheric and surface parameters from AIRS/AMSU/HSB data in the presence of clouds. IEEE Trans Geosci Remote Sens 41(2):390–409. https://doi.org/10.1109/TGRS.2002.808236
Susskind J, Blaisdell JM, Iredell L, Keita F (2011) Improved temperature sounding and quality control methodology using AIRS/AMSU data: the AIRS science team version 5 retrieval algorithm. IEEE Trans Geosci Remote Sens 49(3):883–907. https://doi.org/10.1109/TGRS.2010.2070508
Susskind J, Blaisdell J, Iredell L (2012) Significant advances in the AIRS science team version-6 retrieval algorithm. SPIE Opt Eng Appl. doi 10(1117/12):929953
Susskind J, Blaisdell JM, Iredell L (2014) Improved methodology for surface and atmospheric soundings, error estimates, and quality control procedures: the atmospheric infrared sounder science team version-6 retrieval algorithm. J Appl Remote Sens 8(1):084994. https://doi.org/10.1117/1.jrs.8.084994
Taylor KE (2001) Summarizing multiple aspects of model performance in a single diagram. J Geophys Res 106(D7):7183. https://doi.org/10.1029/2000jd900719
Tian B, Waliser DE, Fetzer EJ, Yung YL (2010) Vertical moist thermodynamic structure of the Madden–Julian oscillation in atmospheric infrared sounder retrievals: an update and a comparison to ECMWF interim re-analysis. Mon Weather Rev 138(12):4576–4582. https://doi.org/10.1175/2010MWR3486.1
Tian B, Fetzer EJ, Kahn BH, Teixeira J, Manning E, Hearty T (2013a) Evaluating CMIP5 models using AIRS tropospheric air temperature and specific humidity climatology. J Geophys Res Atmos 118(1):114–134. https://doi.org/10.1029/2012jd018607
Tian B, Manning E, Fetzer E, Olsen E, Wong S (2013b) AIRS/AMSU/HSB version 6 level 3 product user guide. NASA JPL technical report. https://disc.sci.gsfc.nasa.gov/AIRS/documentation/v6_docs/v6releasedocs-1/V6_L3_User_Guide.pdf. Accessed 28 Nov 2018
Tian B, Fetzer EJ, Manning EM (2019) The atmospheric infrared sounder Obs4MIPs version 2 data set. Earth Space Sci 6(2):324–333. https://doi.org/10.1029/2018EA000508
Wang AH, Zeng XB (2012) Evaluation of multireanalysis products with in situ observations over the Tibetan Plateau. J Geophys Res Atmos 117(D5):214–221. https://doi.org/10.1029/2011JD016553
Wang J, Hock T, Cohn SA, Martin C, Potts N, Reale T, Sun B, Tilley F (2013) Unprecedented upper air dropsonde observations over Antarctica from the 2010 Concordiasi experiment: validation of satellite-retrieved temperature profiles. Geophys Res Lett 40(6):1231–1236. https://doi.org/10.1002/grl.50246
Wang Y, Yang K, Pan Z, Qin J, Chen D, Lin C et al (2017) Evaluation of precipitable water vapor from four satellite products and four reanalysis datasets against GPS measurements on the southern Tibetan Plateau. J Clim. https://doi.org/10.1175/jcli-d-16-0630.1
Wu L (2009) Comparison of atmospheric infrared sounder temperature and relative humidity profiles with NASA African Monsoon Multidisciplinary Analyses (NAMMA) dropsonde observations. J Geophys Res 114(D19):205. https://doi.org/10.1029/2009JD012083
Wuebbles DJ, Fahey DW, Hibbard KA, Dokken DJ, Stewart BC, Maycock TK (2017) USGCRP. In: Climate science special report: fourth national climate assessment, volume I. U.S. Global Change Research Program, Washington, DC, USA. https://doi.org/10.7930/j0j964j6
Xu X, Lu C, Shi X, Gao S (2008) World water tower: an atmospheric perspective. Geophys Res Lett 35(20):525–530. https://doi.org/10.1029/2008GL035867
Xu X, Zhao TL, Lu C et al (2014) An important mechanism sustaining the atmospheric “water tower” over the Tibetan Plateau. Atmos Chem Phys 14(20):11287–11295. https://doi.org/10.5194/acp-14-11287-2014
Yao T, Thompson LG, Yang W et al (2012) Different glacier status with atmospheric circulations in Tibetan Plateau and surroundings. Nat Clim Change 2(9):663–667. https://doi.org/10.1038/nclimate1580
You Q, Min J, Zhang W et al (2015) Comparison of multiple datasets with gridded precipitation observations over the Tibetan Plateau. Clim Dyn 45(3–4):791–806. https://doi.org/10.1007/s00382-014-2310-6
Zhang Y, Wang D, Zhai P, Gu G (2012) Applicability of AIRS monthly mean atmospheric water vapor profiles over the Tibetan Plateau region. J Atmos Ocean Technol 29(11):1617–1628. https://doi.org/10.1175/JTECH-D-11-00207.1
Zhang Y, Wang D, Zhai P, Gu G, He J (2013) Spatial distributions and seasonal variations of tropospheric water vapor content over the Tibetan Plateau. J Clim 26(15):5637–5654. https://doi.org/10.1175/JCLI-D-12-00574.1
Zhang SJ, Wang D, Qin Z et al (2018) Assessment of the GPM and TRMM precipitation products using the rain gauge network over the Tibetan Plateau. J Meteorol Res 32(2):324–336. https://doi.org/10.1007/s13351-018-7067-0
Acknowledgements
This work is supported by the Strategic Priority Research Program of the Chinese Academy of Sciences under Grant no. XDA20060102, the National Natural Science Foundation of China under Grant no. 41775091, and the International Partnership Program of Chinese Academy of Sciences (134111KYSB20160031). We also acknowledge the support from Jiangsu Collaborative Innovation Center for Climate Change. We thank Dr. Aiguo Dai and Junhong Wang at University of Albany, USA for providing the homogenized radiosonde data. Considerable gratitude is owed to the various satellite and reanalysis working teams. The AIRS-only, AIRS/AMSU, MERRA and MERRA2 data were provided by NASA (https://disc.gsfc.nasa.gov). The ERA-Interim data were provided by the European Centre for Medium-Range Weather Forecasts (ECMWF, http://www.ecmwf.int/). The JRA55 data were provided by the Climate Prediction Division of the Global Environment and Marine Department at the Japan Meteorological Agency (http://jra.kishou.go.jp/). The NCEP1 and NCEP2 data were provided by the NOAA Earth System Research Laboratory (ESRL, http://www.esrl.noaa.gov/). The CFSR data can be obtained from the CISL Research Data Archive at https://rda.ucar.edu/pub/cfsr.html. We also appreciate two anonymous reviewers for their insightful comments and detailed instructions, which greatly improved the quality of the work.
Author information
Authors and Affiliations
Corresponding author
Additional information
Publisher's Note
Springer Nature remains neutral with regard to jurisdictional claims in published maps and institutional affiliations.
Rights and permissions
Open Access This article is distributed under the terms of the Creative Commons Attribution 4.0 International License (http://creativecommons.org/licenses/by/4.0/), which permits unrestricted use, distribution, and reproduction in any medium, provided you give appropriate credit to the original author(s) and the source, provide a link to the Creative Commons license, and indicate if changes were made.
About this article

Cite this article
Zhao, Y., Zhou, T. Asian water tower evinced in total column water vapor: a comparison among multiple satellite and reanalysis data sets. Clim Dyn 54, 231–245 (2020). https://doi.org/10.1007/s00382-019-04999-4
Received:
Accepted:
Published:
Issue Date:
DOI: https://doi.org/10.1007/s00382-019-04999-4