
Abstract
Traditionally, common testing problems are formalized in terms of a precise null hypothesis representing an idealized situation such as absence of a certain “treatment effect”. However, in most applications the real purpose of the analysis is to assess evidence in favor of a practically relevant effect, rather than simply determining its presence/absence. This discrepancy leads to erroneous inferential conclusions, especially in case of moderate or large sample size. In particular, statistical significance, as commonly evaluated on the basis of a precise hypothesis low p value, bears little or no information on practical significance. This paper presents an innovative approach to the problem of testing the practical relevance of effects. This relies upon the proposal of a general method for modifying standard tests by making them suitable to deal with appropriate interval null hypotheses containing all practically irrelevant effect sizes. In addition, when it is difficult to specify exactly which effect sizes are irrelevant we provide the researcher with a benchmark value. Acceptance/rejection can be established purely by deciding on the (ir)relevance of this value. We illustrate our proposal in the context of many important testing setups, and we apply the proposed methods to two case studies in clinical medicine. First, we consider data on the evaluation of systolic blood pressure in a sample of adult participants at risk for nutritional deficit. Second, we focus on a study of the effects of remdesivir on patients hospitalized with COVID-19.
1 Introduction
1.1 Motivation
In applications, many research questions regarding a putative treatment effect are commonly formulated in terms of a null hypothesis such as “the treatment is ineffective”, or “the average difference between two competing treatments is null”. Formally, this implies comparing hypotheses of the type \(H_0^*: \theta = \theta _0\) vs \(H_1^*: \theta \ne \theta _0\), i.e., a setting which is known as precise hypothesis testing (Sellke et al. 2001). One of the major problems of this approach, especially in the new era of electronic records and large databases, is that, with standard statistical procedures, even a very small, practically irrelevant departure from the precise null hypothesis can be detected, due to the large sample size. This problem may also emerge with datasets with a moderate number of observations, and casts serious doubts on the usefulness of precise null hypothesis testing, since, by suitably enlarging the sample size, rejection of the null hypothesis may always be attained. In other words, statistical significance, as traditionally evaluated by a precise low p value, bears little or no information on practical significance. As a simple example of this fact, consider making inference on the mean \(\mu \) of a normal distribution with known variance, under random sampling. In Fig. 1 (left panel) standard confidence intervals for \(\mu \) are plotted, keeping fixed the p value (\(p^*=0.01\)) for the precise null hypothesis \(H_0^*: \mu = \mu _0\) and varying n.
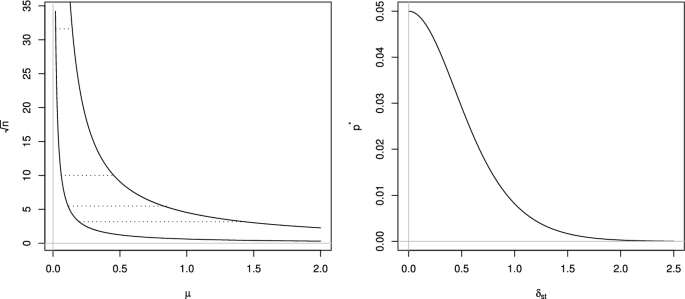
Left panel: 95% level confidence intervals for varying n with \(p^* = 0.01\), \(\mu _0 = 0\), \(\sigma = 1\), and positive sample mean. The two curves correspond to lower and upper bounds, the dashed lines are drawn for \(n=10\), \(n=30\), \(n=100,\) and \(n=1000\). Right panel: \(p^*\) as a function of \(\delta _{st}=\sqrt{n} \delta / \sigma \) having fixed the true (interval hypothesis) p value at 0.05
It is manifest that the same p value may convey completely different information on \(\mu \), ranging from large intervals far from \(\mu _0\) (evidence of substantial effects) to narrow intervals very close to it (negligible effects).
Indeed, under the minimal requirement that the test is consistent, the p value converges to zero as n goes to infinity for any \(\theta \ne \theta _0\), so that low p values only imply strong evidence against absolutely no effect. The discrepancy between statistical and practical significance is well-known in many applied fields as well as in the general statistical one: “finding \(p < 0.05\) often tells the reader only what the investigator already knows, that great effort was put forward to obtain a large enough sample to compensate for the high noise level and/or modest effect size” (Krantz 1999). This is also one of the issues inherent to the use and interpretation of p values, which have been discussed in the American Statistical Association statement (Wasserstein and Lazar 2016) and in the following debate (Wasserstein et al. 2019; Wellek 2017). The fifth principle of this statement says that “a p value, or statistical significance, does not measure the size of an effect or the importance of a result". While some of the problems of p values highlighted by this debate are of an intrinsic nature, many others are due, in our opinion, to widespread uncritical adherence to statistical rituals and misapplications (Gigerenzer 2018). In particular, a main cause of the latter comes from the common inappropriate use of precise null hypotheses testing, more than from intrinsic deficiencies of the p value as discussed above.
In general, it is not easy to find cases where a precise null hypothesis is exactly true; for instance, two different drugs can hardly have an identical effect, even if they are equivalent from a clinical point of view. Thus, very often the real objective of the analysis is to assess whether the effect size is large enough to be of any practical or substantial significance. In these terms, the problem can be re-formulated as:
The interval null hypothesis expressed in (1) includes all practically irrelevant departures from the precise null hypothesis, the use of the latter being in general justified only if it provides an accurate approximation of the real interval hypothesis (see the discussion in Berger and Delampady (1987)). As argued above, this is not often the case in the increasingly common contexts of moderate or large datasets. To illustrate this, consider the following simple but representative example. Given a random sample from a normal distribution with unknown mean \(\mu \) and known variance \(\sigma ^2\), suppose that the true null hypothesis is \(H_0:\left| \mu -\mu _0\right| \le \delta \). The validity of the precise hypothesis approximation can be established by fixing the true (interval hypothesis) p value, say at 0.05, and plotting the precise p value \(p^*\) as n increases. Figure 1 (right panel) shows this plot with \(\delta _{st}= \sqrt{n} \delta /\sigma \) on the x-axis as both p values depend on \(n, \delta , \sigma \) only through \(\delta _{st}\). Remarkably, \(p^*\) can be considered approximately correct (less than 10% error) only if \(\delta _{st}\) is very small (less than 0.1–0.2), roughly 50% error being obtained for \(\delta _{st}\) about 0.5. Indeed, \(p^*\) can be proven to decay exponentially fast as \(\delta _{st}\) diverges, for fixed true p value. For example, for a departure as small as \(\delta /\sigma =0.05\), the approximation is accurate only for \(n\le 25\); for \(\delta /\sigma = 0.2\), typically considered small in many fields (see e.g. Cohen 1988) even when \(n=1\) a 10% error is obtained, \(n=6\) already producing a 50% error.
The above discussion has implications also on the reproducibility crisis (Ioannidis 2005), which is a cornerstone of reliable scientific methodology. Although this crisis certainly stems from many different factors, it seems clear that the uncritical adoption of the precise null hypothesis formulation sharpens the problem, as it allows to declare significant an experimental result even when the real effect is negligible leading to an excessive number of false positives.
1.2 Practical significance in contemporary scientific thinking
The distinction between statistical and practical significance dates back to the 1930s (Berkson 1938, 1942; Wald 1939). It has been the object of animated debates on the usefulness of significance testing in several applied fields, such as medicine, behavioral and social sciences, biology, economics, and ecology (Altman 2004; Cohen 1994, 1988; Greenland et al. 2016; Harlow et al. 2013; Krantz 1999; Lecoutre et al. 2001; Nickerson 2000; Sterne and Smith 2001; Thompson 2006; Wasserstein and Lazar 2016; Ziliak and McCloskey 2008; Zhou et al. 2020). It has been argued that statistical significance would be irrelevant for the assessment of practical significance because it is “neither necessary nor sufficient for a finding to be economically important” (Ziliak and McCloskey 2004). In this line, the severity of the erroneous consequences of the standard (precise null hypothesis) application of significance testing is stressed as being “a major impediment to the advance of scientific knowledge” (Fidler et al. 2004; Schmidt and Hunter 2013). As a consequence, a total ban on hypothesis testing has been advocated by some authors (Trafimow and Marks 2015), and only effect sizes would be reckoned as meaningful. In our opinion, a relevant number of these objections stem from the adoption of p values coming from precise null hypotheses more than from the concept of p value per se.
Other scholars suggest that the presence of a relevant effect can be claimed only when a sufficiently low precise null hypothesis p value \(p^*\) is obtained together with a sufficiently large estimated effect size (Janosky 2008; Kirk 2007). Alternatively, calibration rules of thumb for the p value have been posited to account for the influence of sample size. For instance, Zellner (1971) reports a widespread adjustment of the significance level, “from say 0.05 to 0.03 and to lower values as the sample size grows”. A radical modification of the p value has been proposed by Good (1984) who recommends a sort of empirical standardization of the p value with respect to a standard sample (of size 100), by replacing it with the minimum between the p value itself multiplied by \(\sqrt{n}/10\), and 0.5. These proposals have an intuitive appeal, but they do not seem to provide a general and sound framework.
More recently, a group of researchers (Benjamin et al. 2018; Johnson 2013) suggested lowering the threshold for statistical significance from 0.05 to 0.005 (see also Ioannidis 2018; Lakens et al. 2018). This suggestion is aimed at improving the reproducibility of scientific research, and it is justified on the basis of the Bayes factor and the false discovery rate implied by various p value thresholds. However, these quantities are derived in specific types of testing contexts, and they heavily rely on the assumption of a precise null hypothesis, implicitly considered as an adequate approximation of the correct interval hypothesis. Therefore, the new suggested threshold for statistical significance is not entitled in general to address relevance of effect sizes. Any given such a threshold, however low, may carry completely diverse implications in terms of effect sizes, depending on the context (see also Betensky 2019). Indeed, Benjamin et al. (2018) acknowledge the importance of a deeper focus on effect sizes, but fail to reach a consensus on how to address the problem.
The idea of re-formulating the precise hypothesis testing problem in terms of interval hypotheses has been originally proposed by Hodges and Lehmann (1954): “we reject as soon as there is statistically significant evidence that the departure from \(H_0\) [precise null] is practically significant” (p. 262).
Wellek, in his book on tests for equivalence (Wellek 2010), devotes chapter 11 to propose a methodology for interval null hypotheses. This methodology is based on the observation that the interval testing problem can be formally viewed as the dual problem to the equivalence testing setup. In particular, conditions are provided under which tests for practical relevance can be constructed starting from tests for equivalence. Although surely interesting, such an approach turns out to be applicable only in a limited number of settings. We shall discuss in detail Wellek’s proposal and its relation with our approach at the end of Sect. 2.5.
Betensky (2019) recognizes the importance of adopting interval null hypotheses as well. However, her proposal is developed in the context of one-sided testing with known threshold \(\delta \), relative to the normal mean (with known variance) testing setup. Two-sided interval null hypotheses (1) have been explicitly considered by Blume et al. (2018, 2019), who introduce a completely new type of p value. This is based on the length of the intersection of a confidence interval for the parameter of interest with the null hypothesis, where the threshold \(\delta \) is assumed known. While interesting, this proposal has a different aim, namely to also assess whether the null hypothesis is supported by data and whether data are conclusive or not. When interpreted from a classical testing perspective (i.e., as a measure of evidence against the null hypothesis) Blume et al.’s proposal is often rather conservative. This is a consequence of the fact that the rejection of the null is obtained only when the considered intersection is empty (see discussion in Sect. 3.2).
1.3 Aims
While issues concerning precise null hypotheses are widely acknowledged in the literature, and advocacy of interval or more ad hoc formulated hypotheses is also present, to the best of our knowledge the problem of determining a general and widely applicable approach to interval null hypotheses testing is still open. This may stem from two main obstacles. The first has a statistical nature, and it is represented by the challenge of deriving interpretable and simple tests for this type of hypotheses (especially in the presence of nuisance parameters). From a practical point of view, the second difficulty consists in specifying exactly the critical threshold \(\delta \).
The main purpose of this paper is to address these two issues. Concerning the first one, only tests for precise null hypotheses (“precise null tests” here onwards) are currently available and implemented in widespread statistical packages. In this respect, we propose a fairly general (frequentist) approach founded upon the modification of precise null tests, which covers many common situations, including null hypotheses concerning several parameters, and accommodates for the presence of nuisance parameters. The general idea underlying our approach goes as follows. Let us write the rejection region of the precise null test as \(\{T\ge k\}\) for a given statistic T. Typically, under the interval null hypothesis, the size of the precise null test may be excessively large, even equal to one, for any fixed threshold k. Indeed, often the distribution of T does not depend on the nuisance parameter only under the precise null hypothesis, and T may become very large or even diverge under the interval null hypothesis (as it happens even in the simple normal mean testing problem with unknown variance, see Example 2 in Sect. 4). In this case an \(\alpha \) level test can be derived by letting the threshold k depend on the nuisance parameter, which needs then to be estimated, thus obtaining a data-dependent threshold. In particular, we propose two different types of thresholds, one based on a point estimate and another on an interval estimate of the nuisance parameter. Besides these estimates, their implementation only requires standard available test statistics or p values. In the literature, several methods to deal with nuisance parameters have been proposed, such as higher-order approximations of likelihood-based statistics leading to asymptotic similarity (Severini 2000) or Bayesian techniques that remove the nuisance parameter by integrating it with respect to a suitable (prior or posterior) distribution (Bayarri and Berger 2000). However, these procedures are often quite intricate to implement and interpret.
As for the choice of \(\delta \), in our opinion this is essentially a context-dependent decision requiring problem-specific expert knowledge, regardless of the statistical method used in the analysis. In some settings, reference values are available (e.g. see Cohen 1988; Rahlfs and Zimmermann 2019; Wellek 2010, chapter 1), but no general automatic rules are applicable. Indeed, an exact quantification of \(\delta \) may be often challenging.
To effectively address this crucial issue we develop a procedure aimed at minimizing the information on \(\delta \) that the expert has to possess to reach a conclusion with a certain level of evidence. More precisely, we provide a benchmark value for the effect which the expert is simply asked to decide whether it is practically significant or not.
The rest of the paper is organized as follows. In Sect. 2 a general testing framework is introduced. In addition, two new ad hoc designed tests are proposed (Sects. 2.3 and 2.4) together with their properties. In Sect. 3 a benchmark addressing the problem of choosing the critical threshold \(\delta \) is devised, and the relationship between our approach and confidence interval-based proposals is discussed. Section 4 is devoted to the application of our methodology to some important testing cases, including the general normal linear model and asymptotic normal tests. Two real data case studies in clinical medicine are investigated in Sect. 5, while some conclusions are given in Sect. 6. Finally, proofs of all propositions and theorems can be found in the Appendix, and the results of a simulation study as well as the R code to implement the proposed procedures in the normal case are reported in the Supporting Information (SI).
2 Tests for practical significance of effects
2.1 A general framework
Many common testing problems can be formalized in the following general setting. Let \({\varvec{X}}\) be a random vector from a distribution indexed by \({\varvec{\theta }} = ({\varvec{\eta }}, {\varvec{\psi }})\) \(({\varvec{\theta }} \in \Theta = \Omega \times \Psi )\), where \({\varvec{\eta }}\) is the parameter of interest, and \({\varvec{\psi }}\) is the nuisance parameter. Consider the general problem of testing the precise hypothesis specified by \(h \le dim(\Omega )\) arbitrary equality constraints on \({\varvec{\eta }}\), i.e., \(H_0^*: \{ {\varvec{\theta }}: g_1({\varvec{\eta }}) = 0,\ldots , g_h({\varvec{\eta }}) = 0 \}\) versus the alternative \(H_1^* = {\overline{H}}_0^*\). Let T be the test statistic to be used to assess \(H^*_0\), with large values of T providing evidence against the null hypothesis.
Suppose that the following conditions hold:
-
1.
The (possibly asymptotic) distribution of T depends on \({\varvec{\theta }}\) only through \((\lambda ({\varvec{\eta }}),{\varvec{\psi }})\), where \(\lambda \equiv \lambda ({\varvec{\eta }}): \Omega \rightarrow [0,\;\infty )\) is a measure of divergence from \(H_0^*\). For each fixed \({\varvec{\psi }} \in \Psi \), the distribution function of T, denoted by \(G_{\lambda , {\varvec{\psi }}}(t)\), is stochastically increasing with respect to \(\lambda \).
-
2.
The precise null hypothesis \(H_0^*\) is equivalent to \(\lambda ({\varvec{\eta }}) = 0\).
-
3.
For each fixed \(\lambda \) and \({\varvec{\psi }}\), \(G_{\lambda ,{\varvec{\psi }}}(t)\) is increasing and continuous in t, and, for fixed t and \({\varvec{\psi }}\), it is decreasing (from condition 1) and continuous with respect to \(\lambda \), with limit zero as \(\lambda \) goes to infinity.
While the third point represents a technical condition aimed at proving the regularity of solutions, items 1–2 ensure that the hypothesis of practical non-significance can be properly formulated as \(H_0: \{ {\varvec{\theta }}: \lambda ({\varvec{\eta }}) \le \delta \}, {(\delta \ge 0)}\), provided \(\lambda ({\varvec{\eta }})\) can be interpreted as a suitable measure of departure from the precise null \(H_0^*\). Hereafter we will only consider continuous distributions, although the method could be easily extended (either exactly or asymptotically) to the case of discrete distributions. Many common testing setups (e.g., ANOVA, contingency tables, goodness of fit and regression) together with the corresponding test distributions, such as normal, Student’s t, Chi-square, and Fisher’s F fit the above conditions, with \(\lambda \) being proportional to the distributions’ non-centrality parameter. Typically, in this framework, the sample size enters the non-centrality parameters through an increasing function (going to \(\infty \) as \(n \rightarrow \infty \)), which multiplies the parameter \(\lambda ({\varvec{\eta }})\). This implies that, for any fixed \({\varvec{\eta }}\) such that \(\lambda ({\varvec{\eta }}) > 0\), as n increases, the distribution of T diverges and the precise null hypothesis p value \(p^*\) converges in distribution to 0.
In the following subsections, we propose and comment on three suitable tests dealing with this framework considering \(\delta \) as a known quantity.
2.2 The standard interval test (SIT)
When the distribution of the precise null test statistic T does not depend on the nuisance parameter (including the case where the nuisance parameter \({\varvec{\psi }}\) is not present), conditions 1–3 expressed in the previous section guarantee that the form of the precise null test is also suitable for the interval null \(H_0: \lambda ({\varvec{\eta }}) \le \delta \). Hereafter we will refer to this test as the Standard Interval Test (SIT), namely the precise null test for the interval modification. Such a test is in agreement with the standard theory of one-sided hypotheses, but conditions 1–3 are weaker than usual conditions on monotone likelihood ratio (Lehmann and Romano 2006). Specifically, let \(p_{\lambda }(k) = P_\lambda (T \ge k) = 1-G_\lambda (k)\). As the distribution of T is stochastically increasing with respect to \(\lambda \), the size of the test \(\{ T \ge k\}\) under the interval null hypothesis is given by
In light of the conditions imposed on \(G_{\lambda }(t)\), it is always possible to determine a size \(\alpha \) rejection region \(\{ T \ge k_{\alpha }(\delta )\}\) by deriving the threshold \(k_{\alpha }(\delta )\) as solution of \(p_{\delta }(k) = \alpha \).
Suppose now that the distribution of T depends on the nuisance parameter \({\varvec{\psi }}\). This is often the case, because, typically, T has a distribution (approximately) independent of \({\varvec{\psi }}\) only under the precise null hypothesis. Define \(p_{\lambda ,{\varvec{\psi }}}(k) = P_{\lambda , {\varvec{\psi }}} (T \ge k)\). Then the SIT \(\{ T \ge k\}\) for \(H_0\) has size
which, however, may not assume all size values in [0, 1] since, in general, it is not strictly monotone and continuous, as shown even in the simple normal mean testing problem (see Example 2 in Sect. 4). Indeed, the function \({\hat{p}}_{\delta }(k)\) only possesses the following regularity properties:
Proposition 1
Under the conditions 1–3, the function \({\hat{p}}_\delta (k)\) is non-increasing in k and right continuous.
To derive the conditions for the existence of the SIT with reasonable size values, it is convenient to express the SIT as an intersection–union test. Let us write the null hypothesis as union of the \({\varvec{\psi }}\) known hypotheses: \(H_0 = \bigcup _{{\varvec{\psi }}} H_{0{\varvec{\psi }}}\), where \(H_{0{\varvec{\psi }}} = \{{\varvec{\eta }}: \lambda ({\varvec{\eta }}) \le \delta \} \times \{ {\varvec{\psi }}\} \). Let \(R_{{\varvec{\psi }},\alpha } = \{ T \ge k_{\alpha }(\delta ,{\varvec{\psi }})\}\) be a size \(\alpha \) rejection region for \(H_{0{\varvec{\psi }}}\), i.e. such that \(p_{\delta ,{\varvec{\psi }}}(k_{\alpha }(\delta ,{\varvec{\psi }})) = \alpha \). An intersection–union test has rejection region \(R_{IUT} = \bigcap _{{\varvec{\psi }}\in \Psi }R_{{\varvec{\psi }},\alpha }\). Equivalence of SIT and intersection–union test is given in the following proposition.
Proposition 2
A size \(\alpha \) SIT exists iff \(R_{IUT} = \{ T \ge sup_{{\varvec{\psi }} \in \Psi } k_{\alpha }(\delta ,{\varvec{\psi }})\} = \{ {\hat{p}}_\delta (T) \le \alpha \}\) has size \(\alpha \). In this case, \(\sup _{{\varvec{\psi }}\in \Psi } k_{\alpha } (\delta , {\varvec{\psi }}) = \min \{ k: {\hat{p}}_\delta (k) = \alpha \}\).
Existence of size \(\alpha \) intersection–union test (and therefore SIT) is guaranteed under the following conditions:
Proposition 3
(i) If \(\sup _{{\varvec{\psi }}\in \Psi } k_{\alpha }(\delta ,{\varvec{\psi }}) = k_{\alpha }(\delta , {\varvec{\psi }}_\alpha ) \) for some \({\varvec{\psi }}_\alpha \) and \(\alpha \), then \(R_{IUT}\) has size \(\alpha \). (ii) If for some \({\varvec{\psi }}'\in \Psi \), \(\sup _{{\varvec{\psi }} \in \Psi } p_{\delta ,{\varvec{\psi }}}(k) = p_{\delta ,{\varvec{\psi }}'}(k)\) \(\forall k\), then \(R_{IUT}\) has size \(\alpha \), for any \(\alpha \). Moreover, (ii) is verified iff (i) is true for any \(\alpha \), with \({\varvec{\psi }}_\alpha \) not depending on \(\alpha \).
Besides giving conditions on the existence of the SIT, the intersection–union test formulation also shows that the SIT may not have a satisfactory behavior even when it exists. In fact, the distribution of the SIT under the interval null hypothesis is often highly dependent on \({\varvec{\psi }}\), causing large fluctuations in the threshold \(k_{\alpha }(\delta ,{\varvec{\psi }})\). It follows that, if \(\sup _{{\varvec{\psi }}\in \Psi } k_{\alpha } (\delta , {\varvec{\psi }})\) is attained at very unlikely values of \({\varvec{\psi }}\), then the threshold implied by the SIT may be excessively large, leading to a very conservative test.
In the following, we introduce two new classes of tests that modify the SIT by allowing the threshold to take into account only values of \({\varvec{\psi }}\) that are reasonable in the light of data.
2.3 The plug-in test (PIT)
A first obvious choice is to directly plug-in a point estimate of \({\varvec{\psi }}\) in the threshold:
Definition 1
Let \(\hat{{\varvec{\psi }}}\) be a point estimate of \({\varvec{\psi }}\). Then the plug-in test (PIT) rejection region is \(\{ T \ge k_{\alpha }(\delta ,\hat{{\varvec{\psi }}})\}\).
This leads to an extremely simplified method, which has the advantage of being easy to implement and interpret. However, in general, it is difficult to derive the exact size of this test, although, under suitable regularity conditions, it can be expected to be asymptotically equal to \(\alpha \). Heuristically, this happens because, as the sample size increases, \(P_{\lambda ,{\varvec{\psi }}}(T \ge k_{\alpha }(\delta ,\hat{{\varvec{\psi }}}))\) will typically have the same limit as \(P_{\lambda ,{\varvec{\psi }}}(T \ge k_{\alpha }(\delta ,{{\varvec{\psi }}}))\), which is smaller or equal to \(\alpha \) for any \(\lambda \le \delta \). Thus, if the above convergence holds, the PIT is asymptotically similar, i.e. it has asymptotic size \(\alpha \) on the boundary \(\lambda = \delta \), for any given \({\varvec{\psi }}\) (Robins et al. 2000).
2.4 The confidence interval test (CIT)
A more refined class of tests with data-dependent threshold stems from the need to account for the uncertainty in estimating \({\varvec{\psi }}\). This can be accomplished by letting \({\varvec{\psi }}\) vary within a confidence interval, thus leading to a confidence interval test (CIT).
Definition 2
Let \(\Psi _{CI}\) be a \(1-\gamma \) level confidence interval for \({\varvec{\psi }}\). Then the CIT rejection region is \(\{ T \ge {\tilde{k}}_{\alpha }(\delta )\}\), where \({\tilde{k}}_{\alpha }(\delta ) = \sup _{{\varvec{\psi }}\in \Psi _{CI}} k_{\alpha }(\delta , {\varvec{\psi }})\).
The CIT provides reasonable solutions also when the SIT is not suitable (e.g., when its size can take only the values 0 or 1), and it avoids the possibility of infinite thresholds under very mild conditions of continuity of \(k_{\alpha }(\delta ,{\varvec{\psi }})\) in \({\varvec{\psi }}\) and of compactness of the confidence interval.
Asymptotically, the behavior of the CIT is similar to that of the PIT, since, typically, the confidence interval \(\Psi _{CI}\) shrinks to \(\hat{{\varvec{\psi }}}\). The task of deriving the exact size of the CIT is challenging even in simple contexts. Nevertheless, a completely general upper bound, holding far beyond the present framework, can be obtained from the following result.
Theorem 1
Let \({\varvec{X}}\) be a random vector of observations from a distribution indexed by \({\varvec{\theta }} = ({\varvec{\eta }}, {\varvec{\psi }})\), and let \(\Theta _0\) be an arbitrary null hypothesis. Define \(\Theta _{0{\varvec{\psi }}} = \Theta _0^{{\varvec{\psi }}} \times \{{\varvec{\psi }}\}\), where \(\Theta _0^{{\varvec{\psi }}} = \{ {\varvec{\eta }}: ({\varvec{\eta }}, {\varvec{\psi }}) \in \Theta _0\}\), so that \(\Theta _0 = \bigcup _{{\varvec{\psi }}} \Theta _{0{\varvec{\psi }}}\). For any given known \({\varvec{\psi }}\) and \(\alpha \in (0,1)\), let \(R_{{\varvec{\psi }},\alpha }\) be an arbitrary \(\alpha \) level rejection region for \(\Theta _{0{\varvec{\psi }}}\), i.e. \(\sup _{{\varvec{\theta }}\in \Theta _{0{\varvec{\psi }}}} P_{{\varvec{\theta }}}(R_{{\varvec{\psi }},\alpha }) \le \alpha \). Furthermore, let \(\Psi _{CI}\) be a \(1-\gamma \) level confidence interval for \({\varvec{\psi }}\) under the null hypothesis; that is, \(P_{{\varvec{\theta }}}(\Psi _{CI} \supseteq {\varvec{\psi }}) \ge 1-\gamma \), \(\forall {\varvec{\theta }} \in \Theta _0\). Then, the test with rejection region \(R = \bigcap _{{\varvec{\psi }}\in \Psi _{CI}} R_{{\varvec{\psi }},\alpha }\) has level \(\alpha + \gamma \), i.e. \(\sup _{{\varvec{\theta }}\in \Theta _0} P_{{\varvec{\theta }}}(R) \le \alpha + \gamma \).
We remark that no assumptions are made on the null hypothesis, on the \({\varvec{\psi }}\) known \(R_{{\varvec{\psi }},\alpha }\) tests, or on the confidence interval, including dependence of its distribution on \({\varvec{\eta }}\) and stochastic relation with the test.
Theorem 1 applies to the CIT by choosing \(\Theta _0=\{\lambda ({\varvec{\eta }}) \le \delta \}\) and \(R_{{\varvec{\psi }},\alpha }=\{ T \ge k_{\alpha }(\delta ,{{\varvec{\psi }}})\}\). It follows that an \(\alpha \) level CIT can be obtained by rejecting if \(\{ T \ge {\tilde{k}}_{\alpha -\gamma }(\delta )=\sup _{{\varvec{\psi }}\in \Psi _{CI}} k_{\alpha -\gamma }(\delta , {\varvec{\psi }})\}, (\gamma < \alpha )\). Small values of \(\gamma \), as compared with the relevant \(\alpha \) values, are recommended to improve the approximation of the attained size of the CIT. Thanks to the generality of Theorem 1, ad hoc criteria to construct the confidence interval for \({\varvec{\psi }}\) can be adopted to improve the test performance. In particular, by choosing \(\Psi _{CI}\) such as to minimize \({\tilde{k}}_{\alpha -\gamma }(\delta )\), it is possible to obtain a larger rejection region which will increase the power of the test without changing its level. For example, whenever \(k_{\alpha - \gamma }(\delta ,{\varvec{\psi }})\) is monotone in \({\varvec{\psi }}\), this can be attained through a one-sided confidence interval.
Finally, when a size \(\alpha \) SIT exists, a lower bound for the size of the CIT can be obtained:
Proposition 4
Suppose a size \(\alpha \) SIT exists, i.e. \(\sup _{\lambda \le \delta ,{\varvec{\psi }}\in \Psi }p_{\lambda ,{\varvec{\psi }}}(k) = \alpha \) for some \(\alpha \) where \(p_{\lambda ,{\varvec{\psi }}}(k) = P_{\lambda ,{\varvec{\psi }}}(T \ge k)\), and let \(\Psi _{CI}\) be an arbitrary confidence interval for \({\varvec{\psi }}\). Then, the rejection region \(\{T \ge \sup _{{\varvec{\psi }} \in \Psi _{CI}} k_{\alpha } (\delta ,{\varvec{\psi }})\}\) has size not smaller than \(\alpha \).
Proposition 4 ensures that the size of the CIT with rejection region \(\{ T \ge {\tilde{k}}_{\alpha -\gamma }(\delta )\}\) belongs to the interval \([\alpha -\gamma ,\alpha ], \gamma < \alpha \), thus being known to most practical purposes.
A procedure similar to the CIT was put forth by Berger and Boos (1994) but in the context of precise null hypotheses. The extension to interval null hypotheses is substantial because the complexity of handling nuisance parameters is usually much higher in this case. Moreover, the intersection–union test formulation adopted here enables a clearer comparison between SIT and CIT properties, leading to a tight lower bound for the size of the latter.
2.5 Remarks
The actual implementation of the SIT, PIT, and CIT is relatively straightforward, and it is best obtained by deriving, for any given \(H_0:\lambda \le \delta \), the corresponding p value, i.e. the minimum significance level leading to rejection. For the CIT, this value is given by \(\sup _{{\varvec{\psi }}\in \Psi _{CI}}p_{\delta ,{\varvec{\psi }} }(t)+\gamma \) as \(\left\{ T\ge {{\tilde{k}}}_{\alpha -\gamma }(\delta ) \right\} = \left\{ \sup _{{\varvec{\psi }}\in \Psi _{CI}}p_{\delta ,{\varvec{\psi }} }(t) + \gamma \le \alpha \right\} \), where we recall that \(p_{\delta ,{\varvec{\psi }} }(t)=P_{\delta , {\varvec{\psi }}} (T \ge t)\). Analogously, for the PIT we obtain \(p_{\delta ,{\varvec{\hat{\psi }}}}(t)\), and for the SIT, when applicable, \(p_{\delta }(t)\) or \({\hat{p}}_\delta (t)\) if \({\varvec{\psi }}\) is present (see formulas (2) and (3)). Such values essentially coincide with the tail probability of the test statistic T, \(P_{\delta ,{\varvec{{\dot{\psi }}}} }(T\ge t)\), computed under a suitable value \({\varvec{{\dot{\psi }}}}\) of the nuisance parameter \({\varvec{\psi }}\). This probability can be often computed either numerically or by simulations.
The SIT and the PIT can be viewed as (extreme) cases within the CIT class, corresponding to \(\gamma =0\) and \(\gamma =1\), respectively. As a general rule, the CIT is more conservative than the PIT, because the confidence interval \(\Psi _{CI}\) usually includes \(\hat{{\varvec{\psi }}}\), and the PIT is also more liberal than the SIT.
It can be expected that the power of the CIT may be sensitive to the choice of \(\gamma \). The impact of \(\gamma \) can be best seen by writing the rejection region of the CIT as mentioned above, i.e., \(\left\{ \sup _{{\varvec{\psi }}\in \Psi _{CI}}p_{\delta ,{\varvec{\psi }} }(t) + \gamma \le \alpha \right\} \). As \(\sup _{{\varvec{\psi }}\in \Psi _{CI}}p_{\delta ,{\varvec{\psi }} }(t)\) is decreasing in \(\gamma \), the overall effect of a change in \(\gamma \) on the sum \(\{\sup _{{\varvec{\psi }}\in \Psi _{CI}}p_{\delta ,{\varvec{\psi }} }(t) + \gamma \}\) is unpredictable and likely to be context-dependent. Therefore, we think that it is not possible to provide general guidelines to fix \(\gamma \). However, one can expect that when a short confidence interval is available for \({\varvec{\psi }}\), higher values of \(\gamma \) can be resorted to as \(\sup _{{\varvec{\psi }}\in \Psi _{CI}}p_{\delta ,{\varvec{\psi }} }(t)\) is less affected by \(\gamma \). In any case, we recommend to base the choice of \(\gamma \) on a sensitivity analysis performed via simulation. We carried out this sensitivity analysis in the normal mean testing problem (see Example 2 in Sect. 4 and Sect. 3 of the SI).
Moreover, both the PIT and the CIT can incorporate external information on \({\varvec{\psi }}\) (possibly available from other studies). Specifically, the bounds for the size of the CIT still apply, because no assumptions are made on the confidence interval to be used for \({\varvec{\psi }}\).
We can now compare our approach with the one proposed by Wellek (2010). In chapter 11 of his book on testing equivalence, the author considers the problem of testing the practical relevance of effects. He starts by noticing that the latter problem can be formally viewed as dual to equivalence testing, i.e., the two problems are essentially the same once the roles of the null and the alternative hypotheses are interchanged. It follows that a general procedure to construct tests for practical relevance can be derived by a simple transformation of unbiased tests of level \((1 -\alpha )\) for the equivalence problem. When the distributions of the relevant test statistics T depend (exactly or asymptotically) on one parameter only, Wellek shows that (uniformly most powerful) unbiased tests are obtained if the distribution of T is strictly totally positive of order 3. The latter is a concept of dominance stronger than likelihood ratio monotonicity, and therefore than our definition of stochastic dominance (see condition 1 of Sect. 2.1). In this case, solutions provided by Wellek’s procedure coincide with the solutions suggested by our approach, but our method applies to more general contexts. When the distribution of the test statistics T also depends on nuisance parameters, the author essentially proposes to eliminate these parameters by conditioning on sufficient statistics. This is a convenient procedure in general but it is of limited utility in the equivalence context since a solution is guaranteed when the distribution of T belongs to an exponential family and a test is performed on a natural parameter. For example, the procedure cannot be applied in the simple normal mean testing problem with unknown variance (see Example 2 of Sect. 4).
In essence, our approach is based on the strict conceptual similarity between interval null hypotheses and traditional (two-sided) precise hypotheses testing, whereas the dual relation between interval null hypotheses and equivalence testing appears to be a more formal one. A further substantial difference with Wellek’s approach is the way we deal with nuisance parameters, which are eliminated by point or interval estimation instead of conditioning.
3 Specification of the threshold \(\mathbf \delta \)
3.1 A benchmark for the effect size
As remarked in Sect. 1.3, the identification of the threshold \(\delta \), which determines the practical relevance/irrelevance of effect sizes, is context-dependent and has to be based on subject-specific experts’ evaluation. In some cases reference values for \(\delta \) are available (e.g., see Cohen 1988; Rahlfs and Zimmermann 2019). In this respect, notice that, although referring to testing setups different from ours (namely non-inferiority trials and equivalence testing), considerations developed by the EMA (European Medicines Agency 2005) and by Wellek (2010) on the choice of the threshold may be useful in our setup as well.
However, in general, it may be difficult to exactly specify \(\delta \), only partial information being available. Typically, some high values of effect sizes can be definitely identified as relevant, some other low values as irrelevant, while there is uncertainty about the classification of some in-between values. This means that the value of \(\delta \) is only known to belong to some interval. It is therefore important to verify when a statistically sound decision can be taken in these cases of partial information. This led us to look for the minimum information on \(\delta \) needed to conclude (SIT, PIT, or CIT acceptance or rejection) at a given level \(\alpha \), which is equivalent to determining the values of \(\delta \) for which the test would accept/reject in the light of data. This information is given by the benchmark \(\delta '_\alpha \), defined as the largest departure \(\delta \) to be rejected at level \(\alpha \). Thus, the required minimal information simply consists in assessing whether all the plausible values of \(\delta \) elicited by the experts are smaller or larger than the benchmark \(\delta '_\alpha \). Specifically, statistical evidence of practical significance (at level \(\alpha \)) can be claimed by the expert iff the plausible values of \(\delta \) lie above \(\delta '_\alpha \), or equivalently if it can be argued that \(\delta '_\alpha \) is a substantial effect. Absence of evidence can be drawn if \(\delta '_\alpha \) is considered an irrelevant effect. Otherwise, i.e., if \(\delta '_\alpha \) cannot be classified as either relevant or irrelevant, no decision can be made at level \(\alpha \) based on the expert’s knowledge.
Interestingly, the benchmark \(\delta '_\alpha \) admits a further important inferential interpretation as a lower bound for the effect \(\lambda \). Therefore, \(\delta '_\alpha \) can be viewed as an estimated minimum effect, that is the researcher can be confident at \(1-\alpha \) level that the real effect \(\lambda \) of the treatment is larger than \(\delta '_\alpha \). Formally, by extending the definition of \(\delta ^\prime _\alpha \) setting it equal to zero when \(p^*>\alpha \), the following proposition holds.
Proposition 5
In the no nuisance parameter case, the inversion of the tests \(\{T\ge k\}\) for \(H_0(\delta ):\lambda \le \delta \) gives rise to the \(1-\alpha \) confidence interval \([\,\delta ^\prime _\alpha ,+\infty )\) for \(\lambda \).
Proposition 5 can be extended to the nuisance parameter case under mild regularity conditions ensuring the existence of \(\delta ^\prime _\alpha \). In particular, in both the PIT and the CIT case, the dependence of the threshold on suitable estimates of \({\varvec{\psi }}\) does not affect the inversion procedure that is performed for given data.
From a computational perspective, \(\delta ^\prime _\alpha \) is most easily derived by viewing the \(\textit{p}\) values for the interval null hypothesis as a function of \(\delta \). This function, which we call significance curve, can be shown to be increasing and continuous in \(\delta \) under mild assumptions. It follows that \(\delta '_\alpha \) is the \(\delta \) value making the curve equal to \(\alpha \). The significance curve can also be interpreted as a sort of power function of the SIT \(P_{\delta ,{\varvec{\psi }}}(T\ge t)\) with threshold equal to t, computed under a suitable value of \({\varvec{\psi }}\), if it is present.
The significance curve, by providing the degree of evidence against all possible specifications of the interval null hypothesis, contains complete inferential information on the effect \(\lambda \). In particular, as a consequence of Proposition 5, any \(\alpha \) level lower or upper confidence interval bound for \(\lambda \) can be calculated, and, consequently, any two-sided confidence interval as well.
Figure 2 shows the significance curve relative to the SIT in the normal mean case with known variance as a function of \(\delta _{st}=\sqrt{n}\delta /\sigma \).
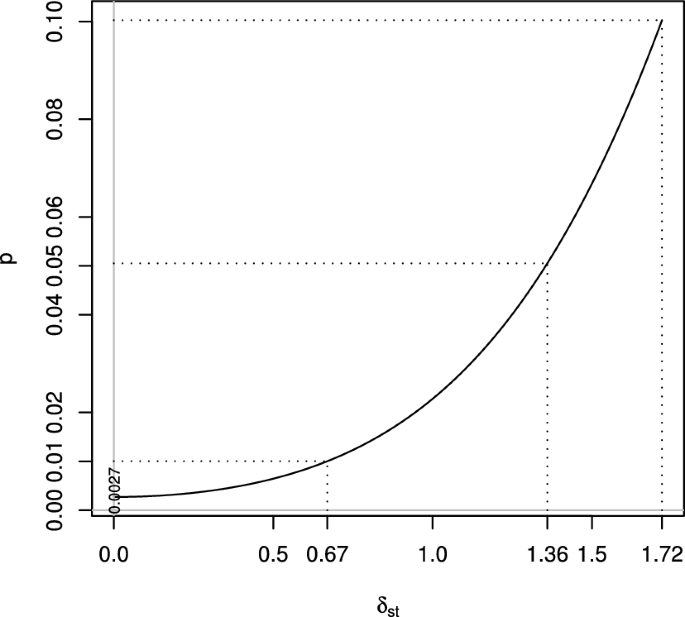
SIT significance curve with \(t=3\) (\(p^*=0.0027\)) as a function of \(\delta _{st}=\sqrt{n}\delta /\sigma \)
Here, for instance, \(\delta '_\alpha =1.36\sigma /\sqrt{n}\) when \(\alpha =0.05\). In particular, we can notice that when n increases, a precise p value of \(p^*=0.0027\) (obtained by setting \(\delta =0\)) is not evidence of practical significance for any given \(\delta \). The value \(t=3\) was chosen for illustrative purposes being the smallest integer ensuring strong evidence against the precise null hypothesis. Smaller values of t would lead to an even more severe lack of evidence of practical significance.
Section 3 of the SI reports the R code allowing the drawing of the significance curves and the computation of the benchmark \(\delta ^\prime _\alpha \) for the normal mean testing problem with known (SIT) and unknown (PIT and CIT) variance.
Proposals related to that of significance curve already appeared in the statistical literature (Birnbaum 1961; Barndorff-Nielsen and Cox 1994; Fraser 1991), although in different contexts. It is also worth mentioning the strictly related notion of confidence distributions (Schweder and Hjort 2002; Xie and Singh 2013).
3.2 Relationship with confidence-interval based approaches
It may be argued that practical significance can be detected simply on the basis of confidence intervals, by showing that a \((1-\alpha )\) –usually two-sided– confidence interval for the parameter of interest \({\varvec{\eta }}\) only contains practically significant values, i.e., there is no intersection between the null hypothesis and the confidence interval. For instance, in Examples 1 and 2 of Sect. 4 (normal mean testing problem), once a two-sided 0.95 confidence interval for \(\eta =\mu \) is built, practical significance may be claimed whenever it contains only values outside \(H_0: \lambda (\mu ) = |\mu - \mu _0| \le \delta \).
Though intuitively reasonable, this procedure does not provide in general a correct quantification of the Type I error probability, even when \(\delta \) is known exactly. Indeed, it is typically conservative. Suppose that an arbitrary \((1-\alpha )\) confidence set \(C(\textbf{X})\) for a parameter \({\varvec{\theta }}\) is used to test an arbitrary null hypothesis \(H_0\) on \({\varvec{\theta }}\). If one rejects when \(\{H_0\cap C(\textbf{X})=\emptyset \}\), then the Type I error probability is \(P_{{\varvec{\theta }}}\{H_0\cap C(\textbf{X})=\emptyset \}\le P_{{\varvec{\theta }}} \{{{\varvec{\theta }}}\notin C(\textbf{X})\}=\alpha \) for any \({{\varvec{\theta }}}\in H_0\). For an arbitrary confidence set the equality only holds when \(H_0\) is precise (corresponding to the commonly used relationship between tests and confidence intervals). For example, consider the normal mean testing case for the interval hypothesis \(H_0: |\mu - \mu _0| \le \delta \) (known variance). The Type I error probability of this procedure (implemented via standard two-sided interval for \(\mu \)) can be shown to be at most \(\alpha /2+\Phi (-z_{1-\alpha /2}-2 \sqrt{n} \delta /\sigma )\), \(\Phi \) denoting the standard normal distribution function. This is very close to \(\alpha /2\) in most practical cases with moderate or large n.
In general, to obtain a procedure with an exact size \(\alpha \) via a confidence interval-based approach to testing, specifically designed types of confidence intervals must be used. In our setting, assuming that a one-sided null hypothesis on the departure \(\lambda \) is appropriate (i.e., \(H_0(\delta ):\lambda ({\varvec{\eta }})\le \delta \)), the only suitable corresponding confidence interval is a one-sided interval \([q(\textbf{X}),\infty )\), \(q(\textbf{X})\) being thus a lower bound for \(\lambda ({\varvec{\eta }})\).
As shown in Proposition 5, the critical benchmark \(\delta ^\prime _\alpha \) corresponds exactly to this lower bound obtained from our proposed tests.
Typically, the one-sided interval for \(\lambda \) does not coincide with commonly used intervals for the parameter of interest \({\varvec{\eta }}\). For example, in the normal case, one-sided intervals for \(\lambda (\mu )=\vert \mu -\mu _0\vert \) imply intervals of the form \((-\infty ,\mu _0-q(\textbf{X})]\cup [\mu _0+q(\textbf{X}),\infty )\) for \(\mu \).
4 Illustrative examples
Example 1
normal distribution with known variance. Let X be a vector of i.i.d. observations from a normal distribution with unknown mean \(\mu \) and known variance \(\sigma ^2\), and suppose a researcher wishes to test the hypothesis that \(\mu \) is not substantially different from \(\mu _0\). The standard practice is to test the precise null hypothesis: \(H_0^*: \mu =\mu _0\) vs \(H_1^*: \mu \ne \mu _0\) by rejecting \(H_0^*\) for high values of \(T = \sqrt{n} |{\bar{X}}-\mu _0| / \sigma \) and to report the p value \(p^* = P_{\mu _0}(T \ge t) = 2(1-\Phi (t))\). Here \({\bar{X}}\) is the sample mean and t the observed value of T.
Consider now the corresponding interval hypothesis \(H_0: |\mu - \mu _0| \le \delta \). This case is easily seen to fulfill the general framework of Sect. 2.1. In particular, T is stochastically increasing in \(\lambda (\mu )=\left| \mu -\mu _0\right| \). Thus, given the absence of nuisance parameters, the SIT exists, and the threshold \(k_\alpha (\delta )\) can be obtained by numerically solving the equation \(p_{\delta }(k) =2-\left[ \Phi (k-\delta _{st})+\Phi (k+\delta _{st})\right] =\alpha \) with \(\delta _{st}=\sqrt{n} \delta /\sigma \). The benchmark \(\delta '_{\alpha }\) can be computed by equating the significance curve to \(\alpha \) (i.e., solving \(p_{\delta }(t)=\alpha \) with respect to \(\delta \), see Fig. 2).
Example 2
normal distribution with unknown variance. Let us consider the normal distribution testing of Example 1, but with unknown variance \(\sigma ^2\) (nuisance parameter). For the precise hypothesis \(H^*_0: \mu = \mu _0\), the precise null test is the usual t-test with rejection region \(R^* = \{ T \ge t_{n-1;\alpha ^*/2}\}\), where \(T = \sqrt{n}|{\bar{X}} - \mu _0| / S\), \(S^2\) is the sample (unbiased) variance, and \(t_{\nu ;\beta }\) is the \(\beta \) quantile of a Student’s t-distribution, with \(\nu \) degrees of freedom (df). The distribution of T is continuous and stochastically increasing in \(\sqrt{n} \left| \mu -\mu _0\right| / \sigma \), diverging when the latter goes to infinity. Thus, conditions 1–3 of Sect. 2.1 are satisfied if one chooses \(\lambda (\mu )= \left| \mu -\mu _0\right| \). As a consequence, the threshold \(k_{\alpha } (\delta , \sigma ^2)\) and the function \(p_{\delta ,\sigma ^2}(k)\) are continuous and decreasing in \(\sigma ^2\). In this context, the SIT \(\{ T \ge k \}\) cannot be used. The conditions of Proposition 3 are not satisfied because the supremum of \(k_{\alpha } (\delta , \sigma ^2)\) and \(p_{\delta ,\sigma ^2}(k)\) are attained at \(\sigma ^2=0\), which is outside the parameter space. Indeed, as T diverges to infinity when \(\sigma ^2 \rightarrow 0\), the SIT size is equal to 1 for any \(k \ge 0\).
For known \(\sigma ^2\), a size \(\alpha \) threshold \(k_{\alpha }(\delta ,\sigma ^2)\) can be determined numerically by solving the equation:
where \(V_{\nu ,ncp}\) is the noncentral Student’s t-distribution function with \(\nu \) df and noncentrality parameter ncp.
Therefore, the PIT can be simply obtained by replacing \(\sigma ^2\) with a suitable estimate, an obvious choice being \(S^2\), which leads to the rejection region \(\{ T \ge k_{\alpha } (\delta , S^2)\}\). Equivalently (and more easily), such region can be computed as \(p_{\delta ,S^2}(t)\le \alpha \). The quantity \(p_{\delta ,S^2}(t)\), viewed as a function of \(\delta \), is the significance curve and can be used to derive the benchmark \(\delta _{\alpha }'\).
Consider now the CIT. If we take the usual two-tailed \(1-\gamma \) confidence interval for \(\sigma ^2\)
where \(\chi ^2_{\nu ,\beta }\) is the \(\beta \) quantile of a Chi-square distribution with \(\nu \) df, then an \(\alpha \) level CIT will be \(\{ T \ge k_{\alpha -\gamma }(\delta ,{\hat{\sigma }}^2_{inf}) \}\) or equivalently \(\{p_{\delta ,{\hat{\sigma }}^2_{inf}}(t)+\gamma \le \alpha \}\). The corresponding significance curve is given by \(p_{\delta ,\hat{\sigma }_{\inf }^2}(t)+\gamma \). In fact, by choosing a confidence interval that minimizes the threshold \(\sup _{\sigma ^2\in CI} k_\alpha (\delta ,\sigma ^2)\), the performance of the CIT can be improved. Since \(k_\alpha (\delta ,\sigma ^2)\) is decreasing in \(\sigma ^2\), this is obtained via a one-sided confidence interval for \(\sigma ^2\) with lower bound \((n-1)S^2/\chi ^2_{n-1;1-\gamma }\).
Both PIT and CIT can be expected to be slightly conservative in this context. This is because large values of T are associated with large values of \(k_\alpha (\delta ,S^2)\), being \(S^2\) negatively correlated with T and \(k_\alpha (\delta ,S^2)\) decreasing in \(S^2\).
To investigate the behavior of the two tests we performed extensive simulations of their Type I error probability when \(\left| \mu -\mu _0\right| =\delta \), for various values of n (\(\ge 15\)), \(\delta \) and \(\sigma \). Some representative cases are reported in the SI (Sect. 1, Tables S1, S2, and S3) for varying \(\delta /\sigma \) values since it can be easily seen that test distributions, when \(\left| \mu -\mu _0\right| =\delta \), depend on \(\delta \) and \(\sigma \) only through their ratio. We let \(\delta /\sigma \) vary up to 0.8, taking as reference Cohen’s classification of effect sizes as small (0.2), medium (0.5), or high (0.8). We recall that in many important contexts the interest is in small deviations from the precise null hypothesis.
In all simulations the type I error probability of the PIT is lower than \(\alpha \), being increasing in \(\sigma \), confirming its conservativeness in this example. However, the PIT real size, obtained by analytically deriving the limit for \(\sigma \rightarrow \infty \), is equal to the desired nominal level \(\alpha \). Simulations show that values close to \(\alpha \) are already obtained for moderate \(\sigma \) values (\(\delta / \sigma \le 1/4\) for \(n=50\)) with improving performances as n increases. The CIT exhibits similar behavior, but with size \(\alpha -\gamma \) and a (sometimes substantially) lower Type I error probability, as expected. In this example, the PIT seems preferable to the CIT. This is because, although it has size \(\alpha \), its type I error probability is uniformly higher than the CIT probability. Thus, it may be expected to attain higher power. This is confirmed by simulations (see Figs. S1–S4 of SI, Sect. 2).
For this basic and pervasive example (normal distribution with unknown variance) an ad hoc test is present in the literature. This is obtained by combining two one-sided t-tests of size \(\alpha /2\) for the two hypotheses \(H_0':\mu \le \mu _0 + \delta \) versus \(\mu >\mu _0 + \delta \) and \(H_0'':\mu \ge \mu _0 -\delta \) versus \(\mu < \mu _0 - \delta \), respectively. The combined test rejects whenever at least one of the one-sided hypotheses is rejected, and it is equivalent to the likelihood ratio test. Its main drawback is its severe biasedness because its Type I error probability is close to \(\alpha /2\), on the boundary \(\left| \mu -\mu _0\right| = \delta \), when \(\delta /\sigma \) is large (see Hodges and Lehmann (1954)).
Our simulations (Sect. 1 of SI) show that the PIT outperforms the combined test for small values of \(\delta / \sigma \) for any considered n. For example, when \(n=50\) the PIT Type I error probability is larger than the combined test Type I error probability for \(\delta / \sigma \le 0.6\), and this holds true for even larger \(\delta / \sigma \) values as n increases. This leads to a uniformly higher power function of the PIT for such values of \(\delta / \sigma \) (see figures in Sect. 2 of SI), with a remarkable difference when \(\delta / \sigma \) is small.
Finally, we also explored the sensitivity of the CIT to the choice of \(\gamma \). Section 3 of the SI reports the power functions for various values of \(\gamma \), \(\alpha \), \(\delta /\sigma \), and n. It emerges that type I error probability is only slightly affected by \(\gamma \). Moreover, notice that any two \(\gamma \) values can be ranked according to the corresponding power function as these functions uniformly dominate each other. Therefore, for any given \(\delta /\sigma \), one can identify the most suitable choice of \(\gamma \). In particular, high values of \(\delta /\sigma \) lead to choosing higher values of \(\gamma \). This is because high values of \(\delta /\sigma \), implying a more precise inference on \(\sigma \), produce shorter confidence intervals. However, values of \(\gamma \) with good performances for all considered choices of \(\delta /\sigma \) can be identified, in particular, \(\gamma =0.01\) when \(\alpha =0.05\), and \(\gamma =0.001\) when \(\alpha =0.01\).
Example 3
Normal linear model. Consider the general linear model \({\textbf{Y}} = {\textbf{X}}\varvec{\beta } + \varvec{\epsilon }\), where \({\textbf{Y}}\) is the response vector, \({\textbf{X}}\) is a full rank \(n \times p\) design matrix, \(\varvec{\beta }\) is a vector of unknown parameters and \(\varvec{\epsilon }\) is a vector of i.i.d. random errors from a \(N(0,\sigma ^2)\). In this setting most common testing problems can be formalized through the general linear hypothesis \(H_0^*: {\textbf{C}}\varvec{\beta } = {\textbf{c}}\), where \({\textbf{C}}\) is a \(q \times p\) full rank matrix with \(q \le p\), and \({\textbf{c}}\) is a vector of q constants specified by the researcher. This encompasses testing the significance of single (or groups of) regression coefficients, as well as comparison of groups (ANOVA). The usual (most powerful invariant) test for \(H_0^*\) rejects the hypothesis for high values of \(F = SSH(\hat{\varvec{\beta }})/(qS^2)\) with noncentral Fisher’s \(F_{q,n-p,ncp}\) distribution with q and \(n-p\) df and noncentrality parameter \(ncp = SSH(\varvec{\beta })/\sigma ^2\). Here \(\hat{\varvec{\beta }}\) is the maximum likelihood estimate of \(\varvec{\beta }\), \(SSH(\varvec{\beta }) = ({\textbf{C}}\varvec{\beta } - {\textbf{c}})' [{\textbf{C}}({\textbf{X}}'{\textbf{X}})^{-1}{\textbf{C}}']^{-1}({\textbf{C}}\varvec{\beta } - {\textbf{c}})\) and \(S^2 = ({\textbf{Y}}-{\textbf{X}}\hat{\varvec{\beta }})/(n-p)\). F is continuous and stochastically increasing in \(SSH(\varvec{\beta })/\sigma ^2\). Thus, if we choose \(\lambda (\varvec{\beta }) = SSH(\varvec{\beta })/n\) and \(\sigma ^2\) as nuisance parameter \({\varvec{\psi }}\), all the conditions of our framework are met. Note that \(\lambda (\varvec{\beta })\) represents a sensible measure of departure from \(H_0^*:\lambda (\varvec{\beta }) = 0\). This is because standard linear model theory (Rao and Toutenburg 1995) shows that \(n\lambda (\varvec{\beta }) = || \varvec{\mu } - \varvec{\mu }_0|| ^2\) where \(\varvec{\mu } = {\textbf{X}}\varvec{\beta }\) is the mean level of the response variable and \(\varvec{\mu }_0\) is the orthogonal projection of \(\varvec{\mu }\) onto the linear space corresponding to \(H_0^*\). Therefore \(\lambda (\varvec{\beta })\) is the average euclidean distance (over the n components of \(\varvec{\mu })\) between an arbitrary model \(\varvec{\mu }\) and its closest point in \(H_0^*\). For example, in the one-way ANOVA case with variables \(Y_{ij} \sim N(\mu _i,\sigma ^2)\), \((i=1,\ldots ,m; j=1,\ldots ,n)\) we have \(\lambda =\sum _{i=1}^m (\mu _i-{\bar{\mu }})^2/m\), \({\bar{\mu }}\) being the overall mean.
The precise null test F cannot be used to test \(H_0: \lambda (\varvec{\beta }) \le \delta \) because it diverges when \(\sigma \rightarrow 0\), so that \(\{ F \ge k\}\) has size 1 for any given \(k \ge 0\). The PIT is \(\{ F \ge f_{q,n-p,n\delta /S^2;1-\alpha } \}\) where \(f_{q,n-p,ncp;\beta }\) is the \(\beta \) quantile of \(F_{q,n-p,ncp}\). The corresponding significance curve is \(1-F_{q,n-p,n\delta /S^2}(f)\), f being the observed value of F. Since \(F_{q,n-p,ncp}\) is continuous and decreasing in ncp, the most convenient implementation of the CIT is \(\{ F \ge f_{q,n-p,n\delta /{\hat{\sigma }}^2_{inf};1-\alpha +\gamma } \}\) where \({\hat{\sigma }}^2_{inf} = (n-p)S^2 / \chi ^2_{n-p;1-\gamma }\) is the \((1-\gamma )\) level lower bound for \(\sigma ^2\). Consequently, the significance curve is \(1-F_{q,n-p,n\delta /{\hat{\sigma }}^2_{inf}}(f) + \gamma \).
It can be shown (by simulation for various values of n, q, and p) that, when \( \lambda (\varvec{\beta })=\delta \), the Type I error probability is increasing in \(\sigma \). The limit for \(\sigma \rightarrow \infty \) can be easily demonstrated to be \(\alpha \) for the PIT and \(\alpha - \gamma \) for the CIT, which are the exact real sizes of the two tests.
Example 4
Standardized effect size. The departure from the precise null hypothesis is sometimes measured in terms of standardized effects, especially when the scale of the variables being studied does not have an intrinsic meaning. This is typically the case in the behavioral, educational, and social sciences where, often, the measurement scale is somewhat arbitrary, and does not have a clear-cut meaning, differently from common biological or medical applications. For example, consider the case of the comparison of the means \(\mu _1\) and \(\mu _2\) of two normal populations with equal variance \(\sigma ^2\). If the measurement units are arbitrary, it may be convenient to measure the effect by the degree of overlap of the two populations, which is a function of the standardized effect size \(\frac{\mid \mu _1-\mu _2\mid }{\sigma }\) (Cohen 1988; Browne 2010). Similar remarks apply to ANOVA and linear regression testing problems, where a list of standardized effect sizes has been proposed (Kelley 2007), or more generally to the normal linear model setup considered in Example 3. In all of these cases the distribution of the relevant test statistic, typically Student’s t or F, only depends monotonically on the non-centrality parameter (\( SSH(\varvec{\beta })/\sigma ^2\) in the notation of Example 3), which is an increasing function of the standardized effect size. Thus, this problem falls into the no nuisance parameter framework (Sect. 2.2), producing exact size-\(\alpha \) tests and benchmark values \(\delta '_{\alpha }\).
Example 5
Asymptotically normal and Chi-square tests. In complex models, often only the asymptotic distribution of the test statistic is known. A typical case, valid in a great variety of situations is asymptotic normality; this case can be treated within the framework of Example 1. If \(\eta \) is scalar, it can be commonly shown that \(Z_n = \sqrt{n}({\hat{\eta }}_n - \eta _0)/{\hat{\sigma }}_n \rightarrow N(0,1)\), where \({\hat{\eta }}_n\) is a suitable estimate of \(\eta \), and \({\hat{\sigma }}_n\) is a consistent estimate of the asymptotic standard deviation of \(\sqrt{n}({\hat{\eta }}_n - \eta _0)\) (\({\hat{\sigma }}_n/\sqrt{n}\) being the usual standard error). The result proved for the normal model (\(\sigma \) known) can be directly applied, provided \(\sigma \) is replaced by \({\hat{\sigma }}_n\); this leads to the p value \(p_{\delta }(Z_n) = 2 - [\Phi (|Z_n|- \sqrt{n} \delta / {\hat{\sigma }}_n) + \Phi (|Z_n|+ \sqrt{n} \delta / {\hat{\sigma }}_n)]\). This p value has asymptotic uniform distribution with range (0, 1) on the boundary \(\mid \eta -\eta _0\mid = \delta \) for any \({\varvec{\psi }}\), so that the test \(\{ p_{\delta }(Z_n) \le \alpha \}\) is asymptotically similar. Notice that many standard and widespread nonparametric tests display the above asymptotic normality so that our methodology can be applied.
In other practically relevant cases (e.g., various likelihood-based testing procedures) the test for the precise null hypothesis (formulated as a set of equality constraints) has asymptotic central Chi-square distribution under the null hypothesis and non-central Chi-square distribution under (contiguous) alternatives. In this setting the non-centrality parameter can often be interpreted in terms of relevant departure from the precise null hypothesis, so that our methodology may be applied.
5 Two real data case studies
5.1 Low BMI as an index of risk for hyper/hypotension
While having a high body mass index (BMI) is a recognized risk factor for high blood pressure, less is known about the effect of low or very low BMI (which may be a proxy of nutritional or internist problems). We used data from the National Health and Nutrition Examination Survey (NHANES), 2015–2016 (public use data release) to investigate this issue. The original NHANES sample included 9971 individuals as being representative of the US population. From the original sample, we selected the subsample of adult participants aged 40\(+\) and with BMI \(< 18.5\) (size equal to 35). According to the standards of the World Health Organization (WHO 1995) a person with BMI \(< 18.5\) is classified as underweight. In our sample 18.5 represents the 20th percentile of the BMI distribution. Following the most recent guidelines (Whelton et al. 2018), there are different cutoffs to classify systolic blood pressure (SBP) and diastolic blood pressure (DBP). If SBP \(< 120\) mm Hg and DBP \(< 80\) mm Hg, blood pressure is defined as normal. If SBP is in the range 120–129 and DBP \(< 80\), blood pressure is defined as elevated. Hypertension, stage I, is diagnosed with SBP in the range 130–139 and DBP in the range 80–89. Higher values of SBP and of DBP lead to hypertension, stage II. In general, hypotension is defined in case SPB \(< 90\) or DBP \(< 60\) (https://www.mayoclinic.org/diseases-conditions/).
We focused on SBP and we considered a two-sided alternative hypothesis on SBP in individuals with low or very low BMI. In the literature, this association has been very debated and it is unclear whether the relationship between BMI and blood pressure is linear or not (Kaufman et al. 1997). For instance, a recent nested case–control study described an association between low BMI and low blood pressure, and it was hypothesized this combination as a possible risk factor for dementia (Wagner et al. 2018). Another large prospective study, conducted on the UK Clinical Practice Research Database, found an association between low BMI and high blood pressure (Emdin et al. 2015).
We tested the precise null hypothesis \(H_0^*: \theta =120\) vs \(H_1^*:\theta \ne 120\). To compare the null hypothesis and the alternative hypothesis we adopted a two-sided t-test with unknown variance. In the subsample of 35 observations, two SBP values were missing, hence 33 observations were included in the analysis. In this sample, we found an average value of SBP of 131.94 mm Hg (standard error 3.77). The t-test \((t = 3.17, p = 0.0034, 95\%\) confidence interval \(= (124.26, 139.62))\) led to rejection of the precise null hypothesis. Taking a \(\delta \) value of 10, which on the right side of the alternative hypothesis seems a sensible value in light of the hypertension thresholds reported above, we re-formulated the problem in terms of interval null hypotheses as in (1). We then determined the PIT and the CIT as presented in Example 2. The CIT was calculated by setting a \(\gamma \) value for the confidence interval of 0.001. Neither the PIT (p = 0.324) nor the CIT (p = 0.701) led to the rejection of the null hypothesis with this \(\delta \). This example shows that qualitatively different conclusions can be reached by re-evaluating a statistical test after having properly modified the precise null hypothesis by including a range of plausibly irrelevant values (on the basis of clinical considerations or guidelines).
Although in the normal mean problem with unknown variance the PIT is preferable to the CIT (see Example 2 of Sect. 4), in Fig. 3, for illustrative purposes, both the PIT and the CIT significance curves are reported.
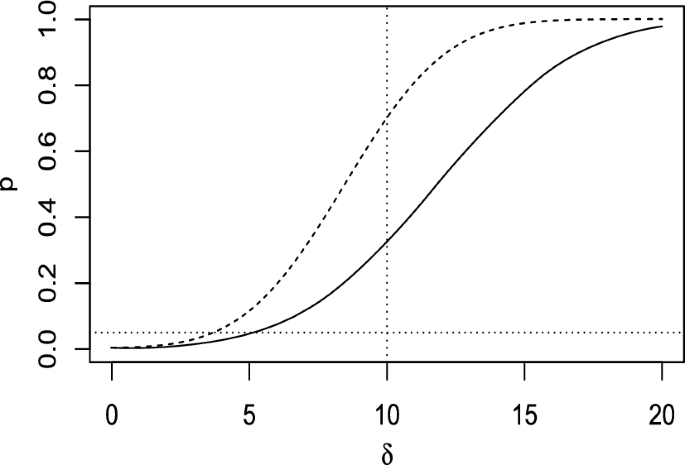
Significance curves of the PIT (solid line) and CIT (dashed line) tests. Dotted horizontal line at p = 0.05 and vertical line at \(\delta \) = 10
As already noted, the PIT is systematically less conservative than the CIT, the difference being negligible for small \(\delta \) values and more substantial for larger \(\delta \) values in the present case. This discrepancy is particularly evident in this example because data variability leads to a large confidence interval for \(\sigma ^2\).
In case of uncertainty about the exact specification of \(\delta \), one may rely on the benchmark value \(\delta _{\alpha }^{'}\), which is 5.19 for the PIT. Thus, according to the PIT one can reject the null hypothesis and claim statistical evidence for practical significance of the effect only if a departure of \(\delta =5.19\) is deemed clinically relevant.
5.2 Remdesivir and COVID-19
Spinner et al. (2020) studied the effect of remdesivir in patients hospitalized with moderate coronavirus disease 2019 (COVID-19). To this purpose, they set up an open-label randomized clinical trial (RCT) of patients admitted to the hospital with confirmed severe acute respiratory syndrome coronavirus 2 (SARS-CoV-2) infection and moderate COVID-19 pneumonia. The RCT was multicenter, with involvement of 105 hospitals in Europe, the US, and Asia. Participants were randomized to receive remdesivir for 10 days (n = 197), for 5 days (\(n = 199\)), or to receive standard care (\(n = 200\)). The primary outcome was clinical status at day 11, as assessed on a 7-point ordinal scale ranging from death (score: 1) to discharged (score: 7). Proportional-odds models (ordinal logistic regression) were used to evaluate potential differences across treatments. Taking standard care as the reference level, results indicated a protective effect of 5-day remdesivir therapy (Odds Ratio (OR) = 1.65(1.09, 2.48), \(p = 0.02\)), while no significance was found when considering the effect of 10-day remdesivir therapy (\(p = 0.18,\) Wilcoxon rank sum test, as the proportional odds assumption was not met for this comparison). In light of these results, the authors conclude for evidence in favor of the use of remdesivir in patients hospitalized with COVID-19, even though they admit that “the difference was of uncertain clinical importance” (p. 1048).
Our proposed methodology can be applied to quantify in an inferentially sound and accurate manner the clinical relevance of these results. In this case the precise null hypothesis is formulated as \(H_0^*: \text { OR } = 1\) vs \(H_1^*: \text { OR } \ne 1\). Due to the intrinsic meaning of ORs, it is not appropriate to measure departures from the null hypothesis in terms of symmetric differences, as implied by the hypothesis \(H_0:\) \( \mid \, \)OR\(-1\mid \, \le \delta \). A more adequate formulation is \(H_0:1/\tau \le \, \)OR\( \, \le \tau \) (\(\tau >1\)) as the quantities \(\tau \) and \(1/\tau \) provide the same level of evidence in favor of either treatment. This formulation, despite being asymmetric, can still be easily dealt with by our methodology. Indeed, as the regression coefficient corresponding to the remdevisir therapy is the logarithm of the OR, the above asymmetric interval hypothesis for the OR is transformed into the standard symmetric hypothesis for the regression coefficient. Being the estimator of the latter asymptotically normal, this case falls into the no nuisance parameter framework (see Example 5). Thus, the benchmark can be easily obtained (see Fig. 4), resulting in \(\tau _{\alpha }^{'}=1.164\) for \(\alpha =0.05\). Decisions about the practical significance of the results can be taken by purely evaluating this value. In particular, statistical evidence (at level \(\alpha =0.05\)) in favor of 5-day remdesivir therapy can be claimed only if an OR of 1.164 (or \(0.86 = 1/1.164\)) can be judged as clinically relevant. Equivalently, from a confidence interval perspective, the researcher can be confident at level \(1-\alpha \) that the odds of one treatment (standard or remdesivir) is at least 16.4% greater than the odds relative to the other treatment.
It is worth noting that a decision based on the standard 95% confidence interval (in this case (1.09, 2.48)) allows to claim clinical efficacy only if an OR as low as 1.09 is considered practically relevant. This is an intrinsically conservative procedure. The use of this value corresponds to a decision taken at \(\alpha \) level 0.027, which is roughly half the declared level. Formally, \(\tau _{\alpha }^{'}=1.09\) for \(\alpha =0.027\) as can be visualized on the significance curve (see Fig. 4).
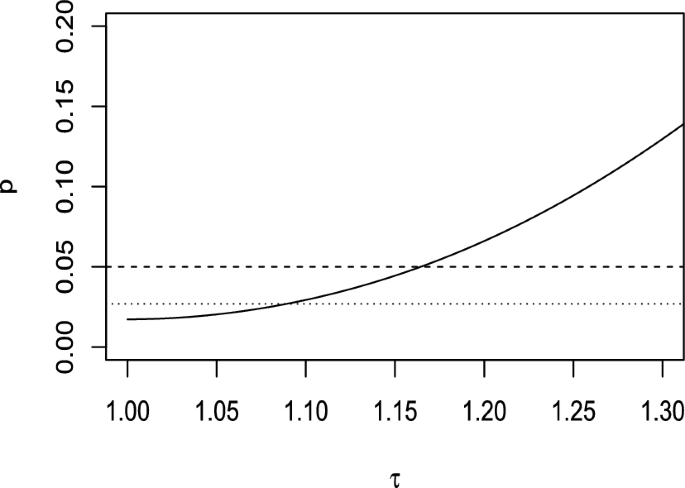
Significance curve for the OR. Horizontal lines at \(p=0.05\) (dashed) and \(p=0.027\) (dotted)
6 Conclusion
In most applied problems it is worth assessing whether a certain effect is relevant or strong enough, i.e., evaluating practical significance, rather than simply establishing its presence/absence. In general, this cannot be provided by the precise null hypothesis p value.
In this paper, we addressed the problem of testing the practical relevance of effects by proposing a unifying and general framework based on interval null hypotheses (possibly involving many parameters of interest), which have been reduced to one-sided hypotheses on a positive scalar parameter \(\lambda (\varvec{\eta })\) representing the measure of the effect in terms of distance from the precise null hypothesis. Such a parameter is strictly related to that indexing the distribution of a test for the precise null hypothesis, which is classically designed to detect the size and the direction of what is generally considered to be the most relevant departure. When nuisance parameters are present we proposed two general modifications of precise null hypothesis tests, i.e., the CIT and the PIT. Their implementation only requires standard available test statistics or p values and nuisance parameters estimates. The size of CIT is generally guaranteed not to exceed the chosen \(\alpha \). On the other hand, PIT is simpler to implement, but its real size needs to be checked analytically or by simulation in each specific case.
A further problem related to interval hypotheses testing concerns the exact quantification of the threshold \(\delta \) adopted to formalize these hypotheses. We provided a suitable benchmark value \(\delta '_{\alpha }\), whose practical relevance can be judged by the scientific community to establish whether findings are valuable. We further clarified that, if deemed preferable, a confidence interval approach can be equivalently resorted to in order to evaluate the practical relevance of effects. However, to guarantee appropriate \(\alpha \) levels, a one-sided confidence interval for the effect size must be used (leading to the lower bound \(\delta '_{\alpha }\)), rather than common two-sided confidence intervals for model parameters. Finally, we remark that our proposed methodology helps in increasing reproducibility of scientific studies, as claims of the significance of observed findings are allowed only when sufficiently relevant effects are likely to be present.
References
Altman M (2004) Special issue on statistical significance. J Socio-Econ 33:651–663
Barndorff-Nielsen O, Cox D (1994) Inference and asymptotics. Chapman & Hall, London
Bayarri M, Berger JO (2000) P values for composite null models. J Am Stat Assoc 95(452):1127–1142
Benjamin DJ, Berger JO, Johannesson M, Nosek BA, Wagenmakers EJ, Berk R, Bollen KA, Brembs B, Brown L, Camerer C, Cesarini D (2018) Redefine statistical significance. Nat Hum Behav 2(6):115–117
Berger RL, Boos DD (1994) P values maximized over a confidence set for the nuisance parameter. J Am Stat Assoc 89(427):1012–1016
Berger JO, Delampady M (1987) Testing precise hypotheses. Stat Sci 317–335
Berkson J (1938) Some difficulties of interpretation encountered in the application of the chi-square test. J Am Stat Assoc 33(203):526–536
Berkson J (1942) Tests of significance considered as evidence. J Am Stat Assoc 37(219):325–335
Betensky R (2019) The p-value requires context, not a threshold. Am Stat 73(sup1):115–117
Birnbaum A (1961) A unified theory of estimation, I. Ann Math Stat 112–135
Blume JD, McGowan LD, Dupont WD, Greevy RA Jr (2018) Second-generation p-values: Improved rigor, reproducibility, & transparency in statistical analyses. PLoS ONE 13(3):e0188299
Blume JD, Greevy RA, Welty VF, Smith JR, Dupont WD (2019) An introduction to second-generation p-values. Am Stat 73(sup1):157–167
Browne RH (2010) The t-test p value and its relationship to the effect size and P(X \(>\) Y). Am Stat 64(1):30–33
Cohen J (1988) Statistical power analysis for the behavioral sciences. Lawrence Elrbaum Associates, Hillsdale
Cohen J (1994) The earth is round (p \(<\).05). Am Psychol 49:997–1003
Emdin CA, Anderson SG, Woodward M, Rahimi K (2015) Usual blood pressure and risk of new-onset diabetes: evidence from 4.1 million adults and a meta-analysis of prospective studies. J Am Coll Cardiol 66(14):1552–1562
European Medicines Agency, E (2005) Guideline on the choice of the non-inferiority margin. EMEA/CPMP/EWP/2158/99
Fidler F, Geoff C, Mark B, Neil T (2004) Statistical reform in medicine, psychology and ecology. J Socio-Econ 33(5):615–630
Fraser D (1991) Statistical inference: likelihood to significance. J Am Stat Assoc 86(414):258–265
Gigerenzer G (2018) Statistical rituals: the replication delusion and how we got there. Adv Methods Pract Psychol Sci 1(2):198–218
Good I (1984) Standardized tail-area probabilities: a possible interpretation. J Stat Comput Simul 19(4):299–300
Greenland S, Senn S, Rothman K, Carlin J, Poole C, Goodman S, Altman D (2016) Statistical tests, p-values confidence intervals and power: a guide to misinterpretations. Eur J Epidemiol 31:337–350
Harlow LL, Mulaik SA, Steiger JH (2013) What if there were no significance tests? LEA Publisher, Mahwah
Hodges J, Lehmann E (1954) Testing the approximate validity of statistical hypotheses. J R Stat Soc Ser B 261–268
Ioannidis J (2005) Why most published research findings are false. PLoS Med 2(8):e124
Ioannidis J (2018) The proposal to lower p value thresholds to .005. J Am Med Assoc 319(14):1429–1430
Janosky J (2008) Statistical testing alone and estimation plus testing: Reporting study outcomes in biomedical journals. Stat Probab Lett 78(15):2327–2331
Johnson V (2013) Revised standards for statistical evidence. Proc Natl Acad Sci 110:19313–19317
Kaufman JS, Asuzu MC, Mufunda J, Forrester T, Wilks R, Luke A, Long AE, Cooper RS (1997) Relationship between blood pressure and body mass index in lean populations. Hypertension 30(6):1511–1516
Kelley K et al (2007) Confidence intervals for standardized effect sizes: theory, application, and implementation. J Stat Softw 20(8):1–24
Kirk RE (2007) Effect magnitude: a different focus. J Stat Plan Inference 137(5):1634–1646
Krantz DH (1999) The null hypothesis testing controversy in psychology. J Am Stat Assoc 94(448):1372–1381
Lakens D, Adolfi FG, Albers CJ, Anvari F (2018) Justify your alpha. Nat Hum Behav 2:168–171
Lecoutre B, Lecoutre M-P, Poitevineau J (2001) Uses, abuses and misuses of significance tests in the scientific community: won’t the bayesian choice be unavoidable? Int Stat Rev 69(3):399–417
Lehmann EL, Romano JP (2006) Testing statistical hypotheses. Springer, New York
Nickerson RS (2000) Null hypothesis significance testing: a review of an old and continuing controversy. Psychol Methods 5(2):241
Rahlfs V, Zimmermann H (2019) Effect size measures and their benchmark values for quantifying benefit or risk of medicinal products. Biom J 61:973–982
Rao CR, Toutenburg H (1995) Linear models: least squares and alternatives. Springer, New York
Robins JM, van der Vaart A, Ventura V (2000) Asymptotic distribution of p values in composite null models. J Am Stat Assoc 95(452):1143–1156
Schmidt F, Hunter J (2013) Eight common but false objections to the discontinuation of significance testing in the analysis of research data. In: Harlow L et al (eds) What if there were no significance tests? LEA Publisher, Mahwah, pp 1–28
Schweder T, Hjort NL (2002) Confidence and likelihood. Scand J Stat 29(2):309–332
Sellke T, Bayarri M, Berger J (2001) Calibration of p-values for testing precise null hypothesis. Am Stat 55:62–71
Severini TA (2000) Likelihood methods in statistics. Oxford University Press, Oxford
Spinner CD, Gottlieb RL, Criner GJ, López JRA, Cattelan AM, Viladomiu AS, Ogbuagu O, Malhotra P, Mullane KM, Castagna A et al (2020) Effect of remdesivir vs standard care on clinical status at 11 days in patients with moderate covid-19: a randomized clinical trial. JAMA 324(11):1048–1057
Sterne J, Smith G (2001) Sifting the evidence—what’s wrong with significance tests? Phys Ther 81(8):1464–1469
Thompson B (2006) Critique of p-values. Int Stat Rev 74(1):1–14
Trafimow D, Marks M (2015) Editorial. Basic Appl Soc Psychol 37:1–2
Wagner M, Helmer C, Tzourio C, Berr C, Proust-Lima C, Samieri C (2018) Evaluation of the concurrent trajectories of cardiometabolic risk factors in the 14 years before dementia. JAMA Psychiatry 75(10):1033–1042
Wald A (1939) Contributions to the theory of statistical estimation and testing hypotheses. Ann Math Stat 10(4):299–326
Wasserstein RL, Lazar NA et al (2016) The ASA’s statement on p-values: context, process, and purpose. Am Stat 70(2):129–133
Wasserstein R, Scirm A, Lazar N (2019) Moving to a world beyond “p\(<\)0.05". Am Stat 73(Suppl 1):1–19
Wellek S (2010) Testing statistical hypotheses of equivalence and noninferiority. Chapman & Hall/CRC, Boca Raton
Wellek S (2017) A critical evaluation of the current “p-value controversy.". Biometr J 59(5):854–872
Whelton P, Carey R, Aronow W, Casey D Jr, Collins K, Himmelfarb DC, DePalma S, Gidding S, Jamerson K, Jones D et al (2018) 2017 ACC/AHA/AAPA/ABC/ACPM/AGS/APHA/ASH/ASPC/NMA/PCNA guideline for the prevention, detection, evaluation, and management of high blood pressure in adults: Executive summary: a report of the American College of Cardiology/American Heart Association task force on clinical practice guidelines (vol 71, pg 2199, 2018). J Am Coll Cardiol 71(19):2273–2275
WHO (1995) Physical status: the use of and interpretation of anthropometry, Report of a WHO Expert Committee. World Health Organization, Geneva
Xie M-G, Singh K (2013) Confidence distribution, the frequentist distribution estimator of a parameter: a review. Int Stat Rev 81(1):3–39
Zellner A (1971) An introduction to Bayesian inference in economics. Wiley, New York
Zhou Z, Zhao J, Bisson L (2020) Estimation of data adaptive minimal clinically important difference with a non convex optimization procedure. Stat Methods Med Res 29(3):879–893
Ziliak ST, McCloskey DN (2004) Size matters: the standard error of regressions in the American Economic Review. J Socio-Econ 33(5):527–546
Ziliak S, McCloskey DN (2008) The cult of statistical significance: how the standard error costs us jobs, justice, and lives. The University of Michigan Press, Ann Arbor
Acknowledgements
One of the illustrative examples presented in this paper relies on the availability on public release of the NHANES data: Centers for Disease Control and Prevention (CDC), National Center for Health Statistics (NCHS). National Health and Nutrition Examination Survey Data. Hyattsville, MD: U.S. Department of Health and Human Services, Centers for Disease Control and Prevention, 2016.
Funding
Open access funding provided by Università degli Studi di Brescia within the CRUI-CARE Agreement.
Author information
Authors and Affiliations
Corresponding author
Additional information
Publisher's Note
Springer Nature remains neutral with regard to jurisdictional claims in published maps and institutional affiliations.
Supplementary Information
Below is the link to the electronic supplementary material.
Appendix
Appendix
Proposition 1
Proof
Let us show that \({\hat{p}}_{\delta }(k)\) is right continuous (monotonicity being obvious). Given \(\tau > 0\), \({\varvec{\psi }}^*\) can be chosen such that \(|{\hat{p}}_\delta (k) - p_{\delta ,{\varvec{\psi }}^*}(k)| < \tau /2\). Then fix \(\epsilon > 0\) such that: \(|p_{\delta ,{\varvec{\psi }}^*}(k) - p_{\delta ,{\varvec{\psi }}^*}(k')| < \tau /2\) for any \(k' \in (k,k+\epsilon )\) by continuity of \(p_{\delta ,{\varvec{\psi }}}\). Therefore \(|{\hat{p}}_{\delta }(k) - {\hat{p}}_{\delta }(k')| \le |{\hat{p}}_{\delta }(k) - p_{\delta ,{\varvec{\psi }}^*}(k')| \le |{\hat{p}}_{\delta }(k) - p_{\delta ,{\varvec{\psi }}^*}(k)| + |p_{\delta ,{\varvec{\psi }}^*}(k)-p_{\delta ,{\varvec{\psi }}^*}(k')| < \tau \), where the first inequality follows from the monotonicity of \({\hat{p}}_\delta (k)\), and because \({\hat{p}}_\delta (k') \ge p_{\delta ,{\varvec{\psi }}^*}(k')\). \(\square \)
Proposition 2
Proof
First notice that the relation \(R_{IUT} = \{ {\hat{p}}_{\delta }(T) \le \alpha \}\) is a consequence of \(\{ T \ge k_{\alpha }(\delta ,{\varvec{\psi }})\} = \{p_{\delta ,{\varvec{\psi }}}(T) \le \alpha \}\) valid for any given \({\varvec{\psi }}\). Suppose now a size \(\alpha \) SIT exists, i.e. \({\hat{p}}_{\delta }(k) = \alpha \) for some k, and let us prove that \(R_{IUT}\) has size \(\alpha \) (the inverse implication being obvious). Let \({\hat{k}}_{\alpha }(\delta ) = \min \{ k: {\hat{p}}_{\delta }(k) = \alpha \}\), whose existence is guaranteed by right continuity of \({\hat{p}}_{\delta }\). Then \(\{ T \ge {\hat{k}}_{\alpha }(\delta )\}\) implies \(\{ {\hat{p}}_{\delta }(T) \le p_{\delta }({\hat{k}}_{\alpha }(\delta )) =\alpha \}\), as \({\hat{p}}_{\delta }\) is non-increasing; moreover, by definition of \({\hat{k}}_{\alpha }(\delta )\), \(\{ {\hat{p}}_{\delta }(T) \le \alpha \}\) implies \(\{ T \ge {\hat{k}}_{\alpha }(\delta )\}\). It follows that \({\hat{k}}_{\alpha }(\delta ) = \sup _{{\varvec{\psi }}\in \Psi } k_{\alpha } (\delta , {\varvec{\psi }})\), thus proving the result. \(\square \)
Proposition 3
Proof
Under condition (i) the size of the intersection–union test is \(\sup _{{\varvec{\psi }}\in \Psi } \;p_{\delta ,{\varvec{\psi }}}(k_{\alpha }(\delta ,{\varvec{\psi }}_{\alpha })) \ge \) \(p_{\delta ,{\varvec{\psi }}_{\alpha }}(k_{\alpha }(\delta ,{\varvec{\psi }}_{\alpha })) = \alpha \). The conclusion then follows as the intersection–union test has always size not greater than \(\alpha \). Condition (ii) implies that there exists (and it is unique) a threshold \(k_{\alpha }(\delta ,{\varvec{\psi }}')\) attaining size \(\alpha \) for any \(\alpha \). Moreover, if (ii) holds, by Proposition 2 this threshold coincides with \(\sup _{{\varvec{\psi }}\in \Psi }(k_{\alpha }(\delta ,{\varvec{\psi }}))\). Vice versa, if (ii) holds and \({\varvec{\psi }}_{\alpha } = {\varvec{\psi }}'\) \(\forall \alpha \), then \(R_{IUT} = \{ \sup _{{\varvec{\psi }}\in \Psi } p_{\delta ,{\varvec{\psi }}} (T) \le \alpha \}\) is equal to \(\{T \ge k_{\alpha }(\delta ,{\varvec{\psi }}')\} = \{ p_{\delta ,{\varvec{\psi }}'}(T) \le \alpha \}\). Since this holds for any \(\alpha \), it must be \(p_{\delta ,{\varvec{\psi }}'}(T) = \sup _{{\varvec{\psi }}\in \Psi } p_{\delta ,{\varvec{\psi }}}(T)\) for any T. \(\square \)
Theorem 1
Proof
Let \({\varvec{\theta '}} = ({\varvec{\eta ',\psi '}}) \in \Theta _0\), then
where the second inequality follows because if \({\varvec{\psi }}' \in \Psi _{CI}\) then \(R_{{\varvec{\psi }}'} \supseteq R\). \(\square \)
Proposition 4
Proof
Proposition 2 implies that \(k \ge \sup _{{\varvec{\psi }}\in \Psi } k_{\alpha }(\delta ,{\varvec{\psi }})\). It follows that
\(\square \)
Proposition 5
Proof
Let \(C(t) = \{ \lambda : t < k_{\alpha }(\lambda )\}\) be the confidence interval obtained by inverting the size \(\alpha \) tests \(A(\delta ) = \{ t: t < k_{\alpha }(\delta )\}\) for the family of hypotheses \(H_0(\delta ) = \{ \lambda \le \delta \}\) vs \(H_1(\delta ) = \{ \lambda > \delta \}\). As \(k_{\alpha }(\delta )\) is strictly increasing in \(\delta \), \(C(t)=[0,+\infty )\) if \(k_{\alpha }(0) > t\), i.e. \(\alpha < p^*\). Otherwise, \(k_{\alpha }(\delta '_{\alpha }) = t\) and therefore \(C(t)=\{ \lambda : \delta '_{\alpha } < \lambda \}\). The random variable \(\delta '_{\alpha }\) is continuous when constrained on the set \(\alpha \ge p^*\), being a strictly increasing function of T. Therefore the strict inequality in the definition of C(t) can be replaced by a weak inequality without changing the level of the confidence interval. \(\square \)
Rights and permissions
Open Access This article is licensed under a Creative Commons Attribution 4.0 International License, which permits use, sharing, adaptation, distribution and reproduction in any medium or format, as long as you give appropriate credit to the original author(s) and the source, provide a link to the Creative Commons licence, and indicate if changes were made. The images or other third party material in this article are included in the article’s Creative Commons licence, unless indicated otherwise in a credit line to the material. If material is not included in the article’s Creative Commons licence and your intended use is not permitted by statutory regulation or exceeds the permitted use, you will need to obtain permission directly from the copyright holder. To view a copy of this licence, visit http://creativecommons.org/licenses/by/4.0/.
About this article

Cite this article
Ongaro, A., Migliorati, S., Ascari, R. et al. Testing practical relevance of treatment effects. Stat Papers 65, 4121–4145 (2024). https://doi.org/10.1007/s00362-024-01549-x
Received:
Revised:
Published:
Issue Date:
DOI: https://doi.org/10.1007/s00362-024-01549-x