
Abstract
Background
HbA1c variability is independent of mean HbA1c, and associated with mortality due to vascular complications. However, the significance of HbA1c variability is unknown at present. In this study, we used flash glucose monitoring (FGM) and evaluated glycemic intraday variations, and then examined the association with HbA1c variability.
Methods
We conducted a retrospective pilot study of 26 patients treated at the Outpatient department for type 2 diabetes mellitus (T2DM), and evaluated the following items associated with blood glucose levels and their changes/variations using FGM. The primary endpoint was factor(s) associated with standard deviation (SD) HbA1c over a 6-month period. To adjust for the effect of varying numbers of HbA1c measurements, we used the adjusted SD of HbA1c.
Results
There were significant correlations between mean HbA1c and each of glucose management indicator, maximum, percent time at glucose > 180 mg/day, mean of daily difference of blood glucose, and high blood glucose index. Adjusted SD HbA1c correlated significantly with percent time at glucose < 70 mg/dL and low blood glucose index. We estimated the regression coefficient of adjusted SD HbA1c using multivariate linear regression analysis, and noted that the presence of hypoglycemia affected Adjusted SD HbA1c (β = 0.130, SE = 0.044, P = 0.008). Hypoglycemia was noted in 17 patients, and adjusted SD HbA1c was significantly higher (p = 0.001) in the hypoglycemic group (0.22 ± 0.12%), compared with the non-hypoglycemic group (0.08 ± 0.05%). The cut-off value of adjusted SD HbA1c was 0.109% in the hypoglycemic group.
Conclusions
The results showed that HbA1c variability is associated with hypoglycemia. For patients with high HbA1c variability, we recommend evaluation for the presence of hypoglycemia and reconsideration of their treatment regimen including their glucose-lowering medications.
Trial registration
The study protocol and opt-out method of informed consent were approved by the ethics committees of the University of Occupational and Environmental Health (Trial registration: H27-186, Registered 25 Dec 2015)
Background
One of the objectives of treatment of diabetes is prevention of future diabetes-related complications through glycemic control. HbA1c is the gold standard index used for monitoring the effectiveness of treatment of diabetes. HbA1c reflects blood glucose level over the previous 3 months, and it is not affected by short periods of blood glucose variations, such as changes following meals and exercise [1, 2]. In this regard, Continuous Glucose Monitoring (CGM) and Flash Glucose Monitoring (FGM) have been recommended for managing more specific glucose levels, and the time in range (TIR) and blood glucose levels of 180 or above and under 70 have become international standards for monitoring the response to diabetes treatment [3]. While CGM is a useful supplementary device, it is difficult to use in all patients during routine clinical practice.
Clinical evidence indicates that keeping HbA1c < 7% is beneficial as it prevents the development of microangiopathy. The Diabetes Control and Complications Trial (DCCT) group has reported that the use of HbA1c as an index of glycemic control slows down the progression of diabetic retinopathy, nephropathy and neuropathy [4]. Furthermore, the effects of intensive glucose-lowering therapy on blood pressure and albumin excretion were still evident at 7 to 8 years after the end of the DCCT study; in the intensive therapy group, the odds ratio was 59% for the prevention of nephropathy and 84% for the prevention of progression to overt albuminuria. In this regard, a previous study of DCCT with 22-year follow-up reported 50% risk reduction in GFR (< 60 mL/min/1.73 m2) in the intensive therapy group, coupled with significant reduction in the GFR decline rate [5, 6]. Furthermore, the United Kingdom Prospective Diabetes Study (UKPDS) showed that for each 1% drop in HbA1c, the risk of microvascular complications reduces by 37% [7]. These trials verified the importance of elevated HbA1c as an indicator of chronic hyperglycemia. Another detailed blood glucose profile study using CGM concluded that HbA1c reflects the mean blood glucose level [8].
The ADVANCE trial [9] examined the effect of glycemic control, using HbA1c as the index parameter, and reported that intensive glucose-lowering therapy was not associated with a significant reduction in macrovascular disorders. Furthermore, the ACCORD trial concluded that intensive therapy was associated with significantly higher all-cause mortality and cardiovascular mortality hazard ratios [10]. These studies suggest that serious hypoglycemia linked to intensive therapy may underlie the increased risk of mortality. In this regard, recent studies have reported that large swings in blood glucose levels are associated with worsening of arteriosclerosis [11] and increased risk of mortality due to cardiovascular events [12]. Apart from blood glucose levels, the correlation between HbA1c variability, in addition to mean HbA1c, and mortality due to diabetic vasculopathies has also been analyzed [13,14,15]. However, to date, the true significance of HbA1c variability remains unknown.
We used the FGM system to examine the relationship between HbA1c variability and detailed glycemic profiles. The primary endpoint was the identification of background parameters and CGM indices that are associated with adjusted SD HbA1c. The latter term represents the variability of HbA1c over a 6-month period. The secondary endpoint was the identification of background parameters and CGM indices that are associated with the mean HbA1c over the 6-month period.
Methods
Subjects
We conducted a retrospective study from September 2018 to January 2019 at the Outpatient Clinic of the University of Occupational Medicine Hospital and University of Occupational Medicine Wakamatsu Hospital. The subjects were 26 patients with type 2 diabetic mellitus (T2DM), who had been on the FGMS® System (FreeStyle Libre Pro System, Abbott Diabetes Care, Inc.) for at least eight days for evaluation of hemodynamics. The following inclusion criteria were applied in this study: (1) age between 30 and 80 years at the time of obtaining consent; (2) T2DM treated and followed-up at the Outpatients Clinic; (3) no changes (addition, switching, or discontinuation) to the glucose-lowering agents or their doses within the 4-week period before the commencement of the FGMS; (4) no changes to the T2DM treatment up to 6 months after the start of FGM. The following exclusion criteria were also applied. (1) Type 1 or secondary diabetes mellitus; (2) severe infection, before- or after surgery, or serious trauma; (3) renal dialysis; (4) severe hepatic dysfunction (AST ≥ 100 IU/L or ALT ≥ 100); (5) moderate or severe heart failure (NYHA/New York Heart Association Classification III or higher stage); (6) pregnant, lactating, or potentially pregnant patients; (7) treated with steroids or other drugs that affect blood glucose levels; and 8) history of macrovascular diseases. The following definitions were used for diabetic microangiopathies. Diabetic neuropathy was diagnosed by the presence of two or more clinical symptoms (bilateral spontaneous pain, hypoesthesia or paresthesia of the legs), absence of ankle tendon reflexes and decreased vibration sensations using a C64 tuning fork. Diabetic retinopathy was defined as mild or severe retinopathy based on the results of funduscopic examination by ophthalmologists. Diabetic nephropathy was defined as albumin-to-creatinine ratio ≥ 30 mg/g creatinine.
The study protocol and opt-out method of informed consent were approved by the ethics committees of the University of Occupational and Environmental Health (Trial registration: H27-186, Registered 25 Dec 2015).
Flash glucose monitoring system
The following parameters were measured using the data recorded by the FGM: average glucose level (AG), standard deviation (SD), coefficient of variation (CV), percent time at glucose level of 70–180 mg/dL (TIR: time in range), percent time at > 180 mg/dL (TAR: time above range), percent time < 70 mg/dL (TBR: time below range), maximum, minimum, glucose management indicator (GMI) [16], mean daily difference of blood glucose (MODD), low blood glucose index (LBGI) and high blood glucose index (HBGI) [17]. Hypoglycemia was defined as a glucose value less than 70 mg/dL as recorded by FGM. FGM was applied once at the start of the study and used for up to 14 days. The FGM data were recorded to avoid bias due to the insertion and removal of the FGM, or lack of stability of the unit. Since the MARD, which represents the accuracy of the sensor in FGM, is higher on the first day [18], and since most patients followed weekly routines in their daily living, we used data obtained from the second to seven days, and excluded those of the first day. We recorded the daily average value, and listed the average value for seven days. The mean percentage of time during which the FGM was active for all 26 cases was 97.4%, and the analysis included no missing values over the 7-day period.
Laboratory tests
HbA1c (%) was measured by HPLC using Tosoh HLC-723 G8 (Tosoh Co., Kyoto, Japan) and recorded as a NGSP (National Glycohemoglobin Standardization Program) value. eGFR (estimated glomerular filtration rate) was calculated as 194 × serum creatinine concentration (mg/dL) − 1.094 × age − 0.287 for men, and 194 × serum creatinine concentration (mg/dL) − 1.094 × age − 0.287 × 0.739 for women [19]. The SD HbA1c represents the SD of 3–7 HbA1c readings over a 6-month period from the time of starting the use of FGM. The SD HbA1c represents the SD of 3–7 HbA1c readings over a 6-month period from the time of starting FGM use. The median number of HbA1c measurements was 4.5. To adjust for the effect of different numbers of HbA1c measurements, we used in this study the adjusted SD of HbA1c, representing the SD of HbA1c divided by [n/(n–1)]0.5, where n is the number of HbA1c measurements [20]. On the other hand, the mean HbA1c reported in this study is the mean of the same measurements.
Statistical analysis
Continuous values are shown as mean values and categorical variables are expressed as count and percentage values. The Shapiro–Wilk test was used to test for normality; for statistical significance of the mean values of two groups, the Student's t-test was used if equal variance was confirmed by the F test, whereas Welch's t-test was used if it followed normal distribution. The Mann–Whitney U test was used if it did not follow a normal distribution, and Spearman's correlation analysis was used for testing the relationship between two variables. Univariate and multivariate linear regression analyses were used to estimate the regression coefficients for adjusted SD HbA1c. Multivariate analysis was performed with adjusted SD HbA1c as the dependent variable, and age, BMI, and presence of hypoglycemia as independent variables. Dummy variables were created for gender and presence of hypoglycemia, and then used in multiple regression analysis. The cutoff value of adjusted SD HbA1c was examined based on the ROC curve. The calculated sample size in the ROC analysis was 30 patients in total, assuming an area under the curve (AUC) of 0.80, power 0.80, with significance level of 5%, and a non-hypoglycemic group versus the hypoglycemic group of 2:1. A p value < 0.05 was considered significant. All analyses were performed using SPSS Statistical Software 25.0 (SPSS Inc., Chicago, IL).
Results
Clinical characteristics of study participants
The clinical characteristics are shown in Table 1. The study participants were 26 patients (14 males, 12 females) aged 68.5 ± 7.8 years (range 51–79 years), with BMI of 24.3 ± 4.1 kg/m2, baseline HbA1c 6.7 ± 0.6% (5.7–7.7%), adjusted SD HbA1c 0.17 ± 0.12% (0.00–0.47%), mean HbA1c 6.8 ± 0.6% (5.7–7.8%), and history of diabetes of 12.6 ± 10.0 years (1.3–30 years). The prevalence of microangiopathy was 19% for neuropathy, 8% for retinopathy, and 23% for nephropathy. The most commonly used antidiabetic drug was DPP-4 inhibitor at 65%, followed by biguanide at 46%. None of the patients developed serious hypoglycemic events throughout the study period.
Factors associated with adjusted SD HbA1c
Table 2 shows the correlation between adjusted SD HbA1c and each of the listed factors. There was significant correlation between adjusted SD HbA1c and TBR (r = 0.501, P = 0.009; Fig. 1a), and between adjusted SD HbA1c and LBGI (r = 0.443, P = 0.023; Fig. 1b). There was no significant difference in adjusted SD HbA1c between with and without each drug (Additional file 1: Table S1).
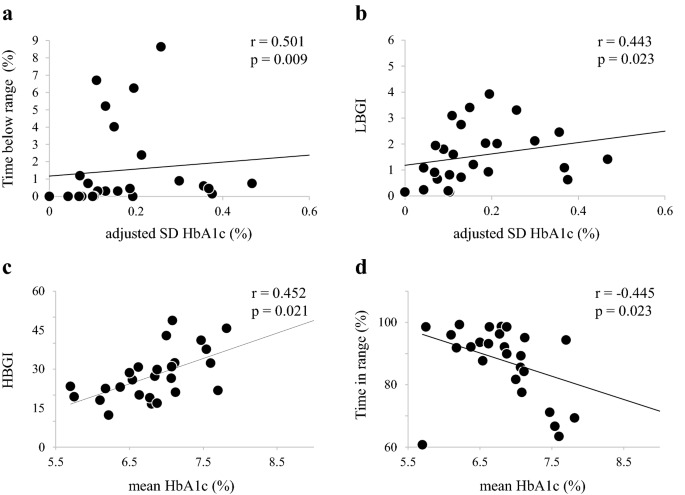
Correlations between adjusted SD HbA1c or mean HbA1c and CGM metrics. Data were obtained from Spearman’s correlation analysis. SD: standard deviation; TBR:Time below range; LBGI: low blood glucose index; HBGI: high blood glucose index; TIR: Time in range
Univariate and multivariate linear regression analyses were used to estimate the regression coefficients for adjusted SD HbA1c (Table 3). Furthermore, multivariate analysis with adjusted SD HbA1c as the dependent variable, and age, BMI, and the presence of hypoglycemia as the independent variables, identified the presence of hypoglycemia as the only significant determinant of adjusted SD HbA1c (β = 0.149, SE = 0.05, P = 0.007).
Factors associated with mean HbA1c
Table 2 shows the correlation between HbA1c and each factor. There were significant correlations between mean HbA1c and each of GMI (r = 0.624, P = 0.001), maximum (r = 0.467, P = 0.016), TAR (r = 0.525, P = 0.006), MODD (r = 0.570, P = 0.002), and HBGI (r = 0.452, P = 0.021; Fig. 1c). On the other hand, there was a negative correlation between mean HbA1c and TIR (r = − 0.445, P = 0.023; Fig. 1d).
Hypoglycemia versus non-hypoglycemia
We examined the difference between adjusted SD HbA1c and mean HbA1c with and without hypoglycemia (Fig. 2a, b). Adjusted SD HbA1c was significantly higher in the hypoglycemic group (p = 0.001) at 0.22 ± 0.12%, compared to the non-hypoglycemic group at 0.08 ± 0.05%. On the other hand, there was no significant difference in mean HbA1c between with or without hypoglycemia.

Comparison of patients with or without hypoglycemia. a, b adjusted SD HbA1c levels and mean HbA1c in patients with or without hypoglycemia. c Comparison of the number of hypoglycemic patients based on adjusted SD HbA1c cutoff value. The statistical difference was determined by the Wilcoxon signed rank test. SD: standard deviation
In order to evaluate the cutoff of adjusted SD HbA1c in the hypoglycemic group, a ROC curve was constructed and the area under the curved surface was calculated. ROC curve analysis showed a cutoff value of SD HbA1c of 0.109% (area under the curve = 0.895, 95% CI 0.673–0.973) in the hypoglycemic group. Comparison of the number of patients with hypoglycemia below or above the adjusted SD HbA1c cutoff value showed significantly higher number of hypoglycemic patients in the adjusted SD HbA1c ≥ 0.109% group (p = 0.001, Fig. 2c).
Discussion
We conducted a pilot study on HbA1c variability and CGM indexes, and showed that adjusted SD HbA1c is associated with the hypoglycemic indexes of TBR and LBGI. Although the association between HbA1c and CGM indexes has been analyzed previously [21, 22], this is the first study that dissected the association between HbA1c variability and CGM indexes.
Variations in blood glucose levels are known to be involved in the progression of diabetes vasculopathies, and several studies reported the association of fasting blood glucose variability and postprandial blood glucose with vascular complications.
HbA1c variability has also attracted attention in recent years, with SD and CV used as scales of HbA1c variability. Bouchi et al. [13] reported that SD HbA1c, which is independent of the common cardiovascular risk factors, is associated with the risk of onset of cardiovascular disease (CVD) in T2DM patients. Hirakawa et al. [14] reported that high SD HbA1c is associated with increased risk of onset of vascular events and increased mortality rate in patients of the ADVANCE trial intensive therapy group. Furthermore, Orsi et al. [15] reported that HbA1c variability in T2DM patients is a strong independent predictor of all-cause mortality in T2DM. Although these reports have shown that HbA1c variability is associated with mortality due to diabetes vasculopathies, the significance of HbA1c variability remains unknown. This study is the first to show that HbA1c variability is associated with CGM-based hypoglycemic indexes. Since hypoglycemia is known to be associated with diabetic vascular complications and related mortality risk, future studies are expected to report on the association of HbA1c variability with risk of cardiovascular mortality.
The objective of glycemic control is to normalize blood glucose level. The United Kingdom Prospective Diabetes Study (UKPDS) [23] obtained data that confirmed the so-called legacy effect associated with intensive glycemic control; therefore, if that state can be maintained, then a long-term prognosis can be expected. On the other hand, intensive glycemic control also increases the risk of hypoglycemia. Particularly severe hypoglycemia must be avoided, as it is associated with poor prognosis. HbA1c is a useful index for evaluating hyperglycemia; however, since HbA1c cannot be used to evaluate hypoglycemia, it is recommended to set a lower limit blood glucose for HbA1c according to the conditions and risk of hypoglycemia [24, 25]. Our study showed that high HbA1c variability increases the risk of hypoglycemia, and provided the cutoff value for adjusted SD HbA1c, above which the risk of hypoglycemia is increased. Our results call for evaluation of hypoglycemia in patients with high SD HbA1c.
As mentioned previously [4, 7], correction of HbA1c is required in order to prevent microangiopathies. In agreement with previous studies, our results showed that the mean HbA1c was associated with the CGM indexes of TIR [26], average glucose [8] and GMI [16]. Although the mean HbA1c was also associated with hyperglycemic indexes, such as maximum, TAR and HBGI, it was not associated with markers of hypoglycemia risk. It is not possible to determine the presence of hypoglycemia by HbA1c values alone; therefore, HbA1c target values should be set individually, taking into consideration the risk of hypoglycemia and support systems.
There were two limitations to this study. The first is we were unable to measure glucose density of ≥ 500 mg/dL in FGM; therefore, as per the decision of the primary physician, patients within the FGM range were recruited for this study. As such, our study did not include patients with poor glycemic control, and thus the results of such patients may be different to those obtained in this study. The second limitation is this was a cross-sectional study conducted at two facilities, and included a relatively small number of patients. Due to the small sample size in this study, it was not possible to adjust for confounding factors, such as renal function and diabetes medication. It was also difficult to include markers of hypoglycemia, such as TBR and LBGI, in the multivariate model. This study is a pilot study and the sample size is small. We plan to conduct a larger, multicenter study in the near future.
Conclusions
We reported for the first time in this study that HbA1c variability is associated with the risk of hypoglycemia (as determined by CGM indexes). It has been reported that HbA1c variability is associated with vascular complications and mortality risk, and hypoglycemia is suggested as a possible contributory factor. For patients with high HbA1c variability, we recommend evaluation of hypoglycemia and adjustment of their treatment regimen, including their glucose-lowering agents.
Availability of data and materials
The datasets used and/or analysed during the current study are available from the corresponding author on reasonable request.
Abbreviations
- CGM:
-
Continuous glucose monitoring
- FGM:
-
Flash glucose monitoring
- TIR:
-
The time in range
- T2DM:
-
Type 2 diabetes mellitus
- AG:
-
Average glucose level
- SD:
-
Standard deviation
- CV:
-
Coefficient of variation
- TAR:
-
Time above range
- TBR:
-
Time below range
- GMI:
-
Glucose management indicator
- MODD:
-
Mean daily difference of blood glucose
- LBGI:
-
Low blood glucose index
- HBGI:
-
High blood glucose index
- eGFR:
-
Estimated glomerular filtration rate
- AUC:
-
Area under the curve
- BMI:
-
Body mass index
- DPP-4 inhibitor:
-
Dipeptidyl peptidase-4 inhibitor
- 95% CI:
-
95% Confidence interval
- CVD:
-
Cardiovascular disease
References
Schnell O, Crocker JB, Weng J. Impact of HbA1c testing at point of care on diabetes management. J Diabetes Sci Technol. 2017;11:611–7.
American Diabetes Association. Glycemic targets: standards of medical care in diabetes-2021. Diabetes Care. 2021;44(Suppl 1):S73–84.
Danne T, Nimri R, Battelino T, Bergenstal RM, Close KL, DeVries JH, et al. International consensus on use of continuous glucose monitoring. Diabetes Care. 2017;40:1631–40.
The Diabetes Control and Complications Trial Research Group. The effect of intensive treatment of diabetes on the development and progression of long-term complications in insulin-dependent diabetes mellitus. N Engl J Med. 1993;329:977–86.
Writing Team for the Diabetes and Complications Trial/Epidemiology of Diabetes Interventions and Complications Research Group Control. Sustained effect of intensive treatment of type 1 diabetes mellitus on development and progression of diabetic nephropathy: the Epidemiology of Diabetes Interventions and Complications (EDIC) study. JAMA. 2003;290:2159–67.
DCCT/EDIC Research Group, Boer IH, Sun W, Cleary PA, Lachin JM, Molitch ME, Steffes MW, Zinman B. Intensive diabetes therapy and glomerular filtration rate in type 1 diabetes. N Engl J Med. 2011;365(25):2366–76.
Stratton IM, Adler AI, Neil HA, Matthews DR, Manley SE, Cull CA, et al. Association of glycaemia with macrovascular and microvascular complications of type 2 diabetes (UKPDS 35): Prospective observational study. BMJ. 2000;321:405–12.
Nathan DM, Kuenen J, Borg R, Zheng H, Schoenfeld D, Heine RJ. A1c-Derived Average Glucose Study Group. Diabetes Care. 2008;31:1473–8.
ADVANCE Collaborative Group, Patel A, MacMahon S, Chalmers J, Neal B, Billot L, et al. Intensive blood glucose control and vascular outcomes in patients with type 2 diabetes. N Engl J Med. 2008;358:2560–72.
Action to Control Cardiovascular Risk in Diabetes Study Group, Gerstein HC, Miller ME, Byington RP, Goff DC Jr, Bigger JT, et al. Effects of intensive glucose lowering in type 2 diabetes. N Engl J Med. 2008;358:2545–59.
Lu J, Ma X, Shen Y, Wu Q, Wang R, Zhang L, Mo Y, Lu W, Zhu W, Bao Y, Vigersky RA, Jia W, Zhou J. Time in range is associated with carotid intima-media thickness in type 2 diabetes. Diabetes Technol Ther. 2020;22:72–8.
Pieber TR, Marso SP, McGuire DK, et al. DEVOTE 3: temporal relationships between severe hypoglycemia, cardiovascular outcomes and mortality. Diabetologia. 2018;61:58–65.
Bouchi R, Babazono T, Mugishima M, Yoshida N, Nyumura I, Toya K, et al. Fluctuations in HbA1c are associated with a higher incidence of cardiovascular disease in Japanese patients with type 2 diabetes. J Diabetes Investig. 2012;3:148–55.
Hirakawa Y, Arima H, Zoungas S, Ninomiya T, Cooper M, Hamet P, et al. Impact of visit-to-visit glycemic variability on the risks of macrovascular and microvascular events and all-cause mortality in type 2 diabetes: The ADVANCE Trial. Diabetes Care. 2014;37:2359–65.
Orsi E, Solini A, Bonora E, Fondelli C, Trevisan R, Vedovato M, et al. Haemoglobin A1c variability is a strong, independent predictor of all-cause mortality in patients with type 2 diabetes. Diabetes Obes Metab. 2018;20:1885–93.
Bergenstal RM, Beck RW, Close KL, Grunberger G, Sacks DB, Kowalski A, et al. Glucose Management Indicator (GMI): A new term for estimating A1C from continuous glucose monitoring. Diabetes Care. 2018;41:2275–80.
Molnar GD, Taylor WF, Ho MM. Day-to-day variation of continuously monitored glycaemia: a further measure of diabetic instability. Diabetologia. 1972;8:342–8.
Ajjan RA, Cummings MH, Jennings P, Leelarathna L, Rayman G, Wilmot EG. Accuracy of flash glucose monitoring and continuous glucose monitoring technologies: implications for clinical practice. Diab Vasc Dis Res. 2018;15(3):175–84.
Matsuo S, Imai E, Horio M, Yasuda Y, Tomita K, Nitta K, Yamagata K, Tomino Y, Yokoyama H, Hishida A, Collaborators developing the Japanese equation for estimated GFR. Revised equations for estimated GFR from serum creatinine in Japan. Am J Kidney Dis. 2009;53(6):982–92.
Jun JE, Jin SM, Im JH, Oh S, Kim MK, Lee MS, Lee MK, Kim JH. The association between glycemic variability and diabetic cardiovascular autonomic neuropathy in patients with type 2 diabetes. Cardiovasc Diabetol. 2015;14:70.
Valenzano M, Cibrario Bertolotti I, Valenzano A, Grassi G. Time in range–A1c hemoglobin relationship in continuous glucose monitoring of type 1 diabetes: a real-world study. BMJ Open Diabetes Res Care. 2021;9(1):e001045.
Yoo JH, Kim JH. Time in range from continuous glucose monitoring: a novel metric for glycemic control. Diabetes Metab J. 2020;44(6):828–39.
Holman RR, Paul SK, Bethel MA, Matthews DR, Neil HA. 10-Year follow-up of intensive glucose control in type 2 diabetes. N Engl J Med. 2008;359:1577–89.
Sinclair AJ, Paolisso G, Castro M, Bourdel-Marchasson I, Gadsby R, Rodriguez Mañas L, European Diabetes Working Party for Older People European Diabetes Working Party for older people 2011 clinical guidelines for type 2 diabetes mellitus. Executive summary. Diabetes Metab. 2011;37:S38.
IDF working Group. IDF global guideline. Managing older people with type 2 diabetes: 11. Glucose control management and targets. p30–36, 2013.
Vigersky RA, McMahon C. The relationship of hemoglobin A1C to time-in-range in patients with diabetes. Diabetes Technol Ther. 2019;21:81–8.
Acknowledgements
Not applicable.
Funding
No funding was received for this study from public, commercial, or non-for-profit entities.
Author information
Authors and Affiliations
Contributions
AT collected the data. KT and AT analyzed the data. AT wrote the manuscript. YO and KT designed the study and reviewed the manuscript. YT reviewed the manuscript. All authors read and approved the final manuscript.
Corresponding author
Ethics declarations
Ethics approval and consent to participate
The study protocol and opt-out method of informed consent were approved by the ethics committee of the University of Occupational and Environmental Health (Trial registration: H27-186, Registered 25 Dec 2015).
Consent for publication
Not applicable.
Competing interests
The authors declare that they have no competing interests.
Additional information
Publisher's Note
Springer Nature remains neutral with regard to jurisdictional claims in published maps and institutional affiliations.
Supplementary Information
Additional file 1: Table S1.
Differences in adjusted SD HbA1c by medication use.
Rights and permissions
Open Access This article is licensed under a Creative Commons Attribution 4.0 International License, which permits use, sharing, adaptation, distribution and reproduction in any medium or format, as long as you give appropriate credit to the original author(s) and the source, provide a link to the Creative Commons licence, and indicate if changes were made. The images or other third party material in this article are included in the article's Creative Commons licence, unless indicated otherwise in a credit line to the material. If material is not included in the article's Creative Commons licence and your intended use is not permitted by statutory regulation or exceeds the permitted use, you will need to obtain permission directly from the copyright holder. To view a copy of this licence, visit http://creativecommons.org/licenses/by/4.0/. The Creative Commons Public Domain Dedication waiver (http://creativecommons.org/publicdomain/zero/1.0/) applies to the data made available in this article, unless otherwise stated in a credit line to the data.
About this article

Cite this article
Tokutsu, A., Okada, Y., Torimoto, K. et al. Relationship between glycemic intraday variations evaluated in continuous glucose monitoring and HbA1c variability in type 2 diabetes: pilot study. Diabetol Metab Syndr 13, 45 (2021). https://doi.org/10.1186/s13098-021-00663-2
Received:
Accepted:
Published:
DOI: https://doi.org/10.1186/s13098-021-00663-2