
Abstract
Background
Fusarium head blight (FHB), primarily caused by Fusarium graminearum, is a major threat to wheat production and food security worldwide. Breeding stably and durably resistant cultivars is the most effective approach for managing and controlling the disease. The success of FHB resistance breeding relies on identification of an effective resistant germplasm. We conducted a genome-wide association study (GWAS) using the high-density wheat 90 K single nucleotide polymorphism (SNP) assays to better understand the genetic basis of FHB resistance in natural population and identify associated molecular markers.
Results
The resistance to FHB fungal spread along the rachis (Type II resistance) was evaluated on 171 wheat cultivars in the 2016–2017 (abbr. as 2017) and 2017–2018 (abbr. as 2018) growing seasons. Using Illumina Infinum iSelect 90 K SNP genotyping data, a genome-wide association study (GWAS) identified 26 loci (88 marker-trait associations), which explained 6.65–14.18% of the phenotypic variances. The associated loci distributed across all chromosomes except 2D, 6A, 6D and 7D, with those on chromosomes 1B, 4A, 5D and 7A being detected in both years. New loci for Type II resistance were found on syntenic genomic regions of chromsome 4AL (QFhb-4AL, 621.85–622.24 Mb) and chromosome 5DL (QFhb-5DL, 546.09–547.27 Mb) which showed high collinearity in gene content and order. SNP markers wsnp_JD_c4438_5568170 and wsnp_CAP11_c209_198467 of 5D, reported previously linked to a soil-borne wheat mosaic virus (SBWMV) resistance gene, were also associated with FHB resistance in this study.
Conclusion
The syntenic FHB resistant loci and associated SNP markers identified in this study are valuable for FHB resistance breeding via marker-assisted selection.
Background
Common wheat (Triticum aestivum L.) is one of the most important cereals in the world and is the raw material for breads, biscuits, noodles and cakes [1]. Fusarium head blight (FHB), caused by Fusarium graminearum, is one of the most destructive fungal diseases in wheat, which spreads considerably due to farming practices and climate changes [2]. FHB does not only reduce grain yield and quality but also leads to infected kernels with excessive deoxynivalenol (DON), resulting in severe harm to human and animal health [3]. China has the largest wheat production and consumption suffering from severe FHB damages, especially in the Middle and Lower Reaches of the Yangtze River with its warm, humid environment. In recent years, FHB has become more serious and expanded in the major wheat production area of the Yellow and Huai River Valleys [4].
The most effective way for wheat producers to manage and control FHB is by breeding resistant cultivars. Great efforts have been made to find FHB resistance genes and understand the genetic mechanism of the resistance [5,6,7,8,9]. The genetic mechanisms for FHB resistance are complex, and the genotype by environment interaction has very strong effects on trait expression [10, 11]. Resistance to F. graminearum in wheat has been classified into five categories: (1) type I for resistance to initial infection by the pathogen, (2) type II for resistance to fungal spread along the rachis, (3) type III for resistance to kernel infection, (4) type IV for resistance to toxin accumulation, and (5) type V for tolerance [12, 13]. Many quantitative trait loci (QTL) have been identified for multiple types of FHB resistance in wheat with different magnitudes of effects [14,15,16,17]. Major and stable QTL often have large effects in multiple environments and are more valuable for practical breeding than minor QTL. However, major and stable QTL are rare for FHB resistance. Fhb1, identified from Chinese wheat Wangshuibai and Sumai 3 and located on chromosome 3BS, is the best characterized FHB resistance locus with major effect and stable resistance. Fhb1 was reported as a pore-forming toxin-like gene (PFT) QTL [18]. However, recent studies revealed an histidine-rich calcium-binding protein (His) was responsible for the Fhb1 resistance [19, 20]. A comprehensive discussion on the two studies has been performed, and the nature of Fhb1 resistance remains unclear [21]. In addition, Fhb1 has shown linkage with poor agronomic traits and single resistance gene has been proven to be a major limitation for FHB resistance breeding as it may not provide sufficient protection under severe FHB epidemics [15, 22, 23]. Pyramiding Fhb1 and other major FHB resistance QTL into elite cultivars using MAS could be crucial for breeding new wheat varieties with better resistance to FHB [4, 24]. Several cultivars such as Yangmai158, Yangmai11 Yangmai12, Yangmai16, and Yangmai23 in the Middle and Lower Yangtze River Valleys with moderate resistance to FHB have been approved to be released and become main cultivars [25]. Most of Yangmai-series cultivars don’t carry the Fhb1 locus [26], indicating that other FHB resistance genes may be present in these cultivars and can be more easily applied to breeding. Therefore, discovering more FHB-resistant germplasms and new FHB-resistant loci is essential for breeding wheat varieties with better FHB resistance.
Genome-wide association studies (GWAS), based on linkage disequilibrium (LD) has been widely used to discover various quantitative traits associated nucleotide polymorphisms in plants. For example, using a panel of 192 bread wheat cultivars from southwest China, 57, 27, 30, and 34 single nucleotide polymorphism (SNP) were identified for associations with plant height (PH), grain protein content (GPC), thousand kernel weight (TKW) and sodium dodecyl sulfate (SDS) content, respectively [27]. One hundred-twenty consistent loci were detected using SNP-GWAS and Haplotype-GWAS, and 78 were potentially new [28]. The recently released reference genome sequence of Chinese Spring [29] provides an elit platform for detecting genes significantly associated with linked markers with known physical positions in the genome and promoting the molecular breeding process [30]. In this study, we report a GWAS analysis of FHB resistance using a set of 171 common wheat cultivars with 90 K SNP genotyping and 2 year’s phenotyping data. The aims of this study were to identify stable loci for FHB resistance using GWAS and better understand the genetic basis of FHB resistance in natural population.
Results
Phenotypic variation
Continuous variation for percentage of symptomatic spikelets (PSS) was observed at the GWAS panel in both 2017 and 2018 growing seasons, from highly resistant (PSS < 25%) to highly susceptible (PSS > 75%)(Fig. 1). The disease symptom was more severe in 2018 growing season (Fig. 2a). Wheat cultivars from different provinces of China exhibited different levels of resistance to FHB(Fig. 2b). Cultivars from Hunan and Jiangsu provinces exhibited consistently highly resistant to FHB in two seasons, whereas cultivars from Shandong province showed the highest susceptibility.

The phenotypic response of the wheat spikelets classified into the four classes based on FHB severity. a resistant, b moderately resistant, c moderately susceptible and d susceptible plants
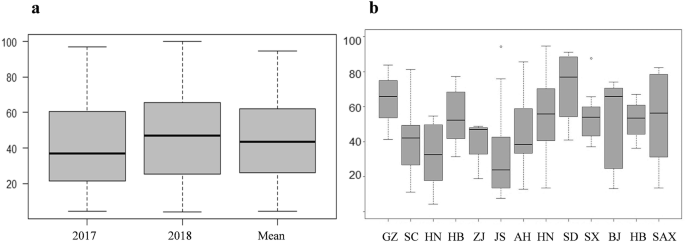
Boxplot of FHB severities. a FHB severities of natural population in 2017, 2018 and the mean of the two seasons, y-coordinate indicates the percentage of symptomatic spikelets. b FHB severities of wheat cultivars from nine major Chinese provinces, x-coordinate indicates the name of provinces, Guizhou(GZ), Sichuan(SC), Hunan(HN), Hubei(HB), Zhejiang(ZJ), Jiangsu(JS), Anhui(AH), Henan(HN), Shandong(SD), Shanxi(SX), Beijing(BJ), Hebei(HB) and Shaanxi(SAX) in turn from left to right; y-coordinate indicates the percentage of symptomatic spikelets
Population structure analysis
To estimate the sub-populations of the 171 wheat cultivars, population structure analysis was performed using 1676 polymorphic SNP markers distributing on 21 wheat chromosomes with r2 values > 0.2. The results indicated that the cultivars could be separated into two sub-populations (K = 2) (Fig. 3a, b). Subgroup 1 consists of 99 cultivars, mainly comprising varieties from Anhui, Jiangsu, Henan, Shaanxi and Hunan; subgroup 2 consists 72 cultivars (Additional file 1: Table S1), most of which were from Henan, Jiangsu, Shandong, Shanxi. Wheat cultivars from Anhui and Hunan were all clustered into subgroup 1.

Population structure of 171 wheat cultivars based on 1676 polymorphic SNP markers with whole-genome coverage. a Number of subpopulations estimated by ∆K at a range of K-values, and (b) Genetic structure produced by Structure V2.3.2. c Estimated LD decay for 171 wheat accessions based on filtered markers from the Wheat 90 K array
Linkage disequilibrium (LD) analysis
The filtered markers from the 90 K SNP genotyping arrays were used to calculated LD decay for the A, B, and D sub-genomes separately as well as the whole genome. 38.9% of all pairs of loci had significant LD (P < 0.001) with an average r2 of 0.281 from 23,556 polymorphic SNPs which distributed at the genome-wide level. The B sub-genome contained the largest number of significant markers (50.0%), followed by A (39.7%) and D (24.0%) sub-genomes. The highest LD decay distance was present in the D sub-genome and the lowest was found in the B sub-genome. The average LD decay distance was ~ 10.5 Mb for the whole genome and 10, 9.5, and 12 Mb for A, B, and D sub-genomes, respectively (Fig. 3c).
Marker-trait associations
Association analysis was conducted using PSS data across 2 years and 23,556 filtered markers. Altogether, 26 loci (88 MTAs, P < 10− 3) with phenotypic variances explained (R2) ranging from 6.64–14.18% were identified across all of the chromosomes except for 2D, 6A, 6D and 7D (Fig. 4a, b). Among these, 41, 32 and 15 significant markers were located on the A, D and B sub-genomes, respectively (Fig. 4c; Additional file 1: Table S2). More FHB MTAs were found on chromosomes 1A, 1D, 1B, 2A, 3B, 4A and 5D.

Manhattan plots from genome-wide association scan for FHB severities among 171 wheat accessions in (a) 2017 and (b) 2018. Dashed horizontal line is the significant threshold level. c Numbers of significant FHB associated markers on different chromosomes
Twenty-eight MTAs located on chromosomes 1B (1), 4A (7), 5D (19) and 7A (1) were consistently identified in both seasons and could be considered as stable QTL (Table 1), SNP GENE-0293_154 located on 1B explained 6.91–7.18% of phenotypic variances (R2). Seven and 19 SNPs located on 4AL and 5DL chromosomes explained phenotypic variances (R2) ranging from 9.36–11.63% and 8.11–14.18%, respectively. The SNP BobWhite_c22875_239 located on 7A could explain 8.12–8.53% of phenotypic variances (R2).
Due to the high level of LD in wheat, the SNP clusters identified on chromosomes 4AL (QFhb-4AL) from 621.85 Mb to 622.24 Mb and 5DL (QFhb-5DL) from 546.09 Mb to 547.27 Mb most likely represented chromosome regions containing significant FHB associated loci, respectively. Haplotype analyses of the associated markers revealed three haplotype groups (Fig. 5a), Haplotype 1 consisted of 149 cultivars with an average PSS of 48.92% over 2 years, in which 24 were resistant, 55 were moderately resistant, and 70 were susceptible. Haplotype 2 consisted of 19 cultivars with an average PSS of 19.94% over 2 years, and 12 of them were resistant and 7 were moderately resistant. Haplotype 3 comprised three resistant cultivars with an average PSS of 11.52%. The results indicated that other resistant genes also existed in the cultivars of Haplotype 1 (Table 2, Additional file 1: Table S3). Interestingly, each haplotype contains wheat cultivars with same associated SNPs on both QFhb-4AL and QFhb-5DL simultaneously (Fig. 5b).

Haplotype analysis results. a Frequency distributions of the mean FHB severities for 171 cultivars with different haplotypes on chromosomes 4A and 5D. Gray, orange and red represent haplotype 1, haplotype 2 and haplotype 3, respectively. The x-axis exhibits 1–4 scores based on FHB severity (resistant, 0 < PSS ≤25%; moderately resistant, 25% < PSS ≤50%; moderately susceptible, 50% < PSS ≤75% and susceptible, 75% < PSS ≤ 100%). The y-axis represents the number of cultivars (also numbered on the bar) showing the FHB severity in different haplotypes. b Haplotype analysis of significant SNPs on chromosomes 4A and 5D. Solid bar plot displays average FHB severity of each haplotype. Gray, orange and red represent haplotype 1, haplotype 2 and haplotype 3, respectively. Left: Haplotypes of the significant SNPs based on 4A among wheat lines; right: Haplotypes of the significant SNPs based on 5D among wheat lines
Discussion
FHB resistance loci identified by GWAS
QTL for Fusarium head blight resistance have been extensively reported using different mapping populations and mapping platforms. From more than 250 documented QTL conferring FHB resistance, only Fhb1-Fhb7 haved been proven to be major effects QTLs. Qfhs.nau-6B (Fhb2), Qfhi.nau-4B (Fhb4), and Qfhi.nau-5A (Fhb5) were fine mapped in the 2.2 cM, 0.14 cM, and 0.09 cM interval [16]. Fhb1 has been cloned recently [18,19,20]. In current study, four loci (28 MTAs) were identified on chromosomes 1B, 4A, 5D and 7A in two seasons. In comparison to the SNP GENE-0293_154 on chromosome 1B identified for type II FHB resistance in this study, a minor QTL for type II resistance was found in a similar physical position from Chinese wheat landrace Huangfangzhu [31]. Two loci located on 4AL and 5DL chromosomes at physical intervals of 0.39 Mb and 1.18 Mb, respectively, were related to type II resistance with variation (R2) of 9.36–11.63% and 8.11–14.18%, respectively. The SNP BobWhite_c4438_162 itself on 5DL could explain 8.89–14.18% variation.
QTL for FHB resistance on chromosome 4AL have been reported from European wheat cultivars. Holzapfel et al. [32] identified two FHB resistance QTL on chromosome 4AL from a French cultivar (Apache) linked with XP7452–646 and a German cultivar (Pirat) linked with XP7553–254.AR. Another QTL, QFhs.fal-4AL, has been mapped on 4AL at a physical position 357.2 Mb from a Swiss winter wheat cultivar (Arina) [33]. FHB QTL identified on 4AL at a physical position from 621.85 Mb to 622.24 Mb in the current study is different from the reported ones and should be new FHB resistance loci. A type II resistance QTL from FHB-resistant wheat cultivar Chokwang (Korea) was mapped on 5DL and linked to the SSR marker Xbarc239 [34, 35] with a physical position of 420.96 Mb. Jia et al. [36] reported a QTL on chromosome 5D linked with Xgwm358 with a physical position of 120.61 Mb. Since no QTL for Type II resistance has ever been reported on chromosome 5DL at the physical interval of 546.09 Mb to 547.27 Mb, QFhb-5DL is likely to be a new FHB resistance locus. SNPs wsnp_JD_c4438_5568170 and wsnp_CAP11_c209_198467 in this QTL region of 5DL were reported to be closely linked to a soil-borne wheat mosaic virus (SBWMV) resistance gene Sbwm1 [37]. The SNPs have been developed into breeder-friendly Kompetitive Allele-Specific Polymerase chain reaction (KASP) markers for effectively distinguish resistant and susceptible alleles of Sbwm1 in a diverse wheat panel in breeding programs. It would be interesting to verify whether these KASP markers can be used in marker-assisted selection of FHB resistance in wheat breeding. Furthermore, BobWhite_c22875_239 was found associated with type II resistance on chromosome 7AL at 661.3 Mb that is about the same proximal region of a reported QTL QFhb.nau-7A from Wangshuibai [38, 39] (Additional file 1: Table S4).
QFhb-4AL and QFhb-5DL are located on syntenic genomic regions
We detected two loci significantly associated with FHB resistance on 4AL and 5DL at a physical intervals of 0.39 Mb and 1.18 Mb, respectively. LD of markers and FHB severity analysis indicated that each haplotype contains wheat cultivars with associated SNP on both QFhb-4AL and QFhb-5DL simultaneously. Gene annotations of the genomic intervals revealed homologous gene pairs between 4AL and 5DL. Highly collinearity in gene order and content were observed for the two FHB resistant QTL regions, even through large fragment insertions/deletions were also presented (Additional file 1: Table S5; Fig. 6).

Gene annotation of SNPs identified on chromosome 4AL (a) and 5DL (b) for FHB resistance. The far left and right image is a visualization of linkage disequilibrium (red is a D’ value of 100%) (I). Names of the markers (II) and physical position (III) were observed in the region of interest. Most significant marker is highlighted in red. The middle image is a physical map of candidate genes on 4AL and 5DL chromosome segments spanning from 621.793 to 622.509 Mb and 546.085 to 547.418 Mb, respectively (IV). The physical position is based on IWGSC 2018. Dotted lines indicate a linear relationship between the significantly associated regions on 4AL and 5DL, respectively
Wheat has experienced structural evolution involving chromosome translocation of 4A, 5A, and 7B. The 4AL/5AL translocation taken place at the diploid level and existed both in T. monococcum and T. aestivum, followed by a 4AL/7BS translocation, a pericentric inversion (4AS;4AL) and a paracentric inversion (4AL;4AL) that occurred in the tetraploid progenitor of hexaploid wheat [40]. Recently, Dvorak et al. [41] reassessed the evolution of wheat chromosomes 4A, 5A and 7B after sequence comparison of wild emmer wheat and Aegilops tauschii. They found that the 596.20–631.84 Mb genomic region of 4A pseudomolecule was derived from ancestral 5AL with nested inversion and is corresponding to the end of the Ae. tauschii arm 5DL. The two FHB associated loci on 4AL (621.81–622.49 Mb) and 5DL (546.45–546.92 Mb) are located on the syntenic block with sequence inversion (Fig. 6), providing further information of this structure rearrangement containing important genes for agronomic trait.
The hypothetical proteins were predicted for the 4AL and 5DL syntenic blocks (Table 3). Two kinase proteins, homologous to PTI1-like tyrosine-protein kinase 1 and Putative receptor protein kinase ZmPK1, proved to be associated with plant disease resistance were annotated in the corresponding genomic regions (Additional file 1: Tables S4 and S5). Protein kinases (PKs) are important for transmembrane signaling that regulates plant development and adaptation to diverse environmental conditions [42]. Several kinase proteins have been reported related to plant innate immunity. For example, the combination of a kinase and a putative START lipid-binding domain is necessary to confer wheat rust resistance of Yr36 [43]. Wheat stripe rust resistance gene Yr15 (WTK1) [44] and barley (Hordeum vulgare L.) stem rust (P. graminis f. sp. tritici) resistance gene Rpg1 [45] contain a structure with tandem kinase domains. A maize wall-associated kinase protein (ZmWAK) was reported to confer quantitative resistance to maize head smut [46] and the PTI1-like kinase (ZmPti1a) was known to play an important role in the signaling pathway that facilitates pollen performance and male fitness [47].
Kinase proteins were also found to be important in F. graminearum. A MAP kinase gene (MGV1) in F. graminearum was required for much more developmental processes linked to sexual reproduction, plant infection, and cell wall integrity [48]. The glycogen synthase kinase gene orthologous to mammalian GSK3 was an significant virulence factor and Fgk3 glycogen synthase kinase was also important for growth, pathogenesis, conidiogenesis, DON production and stress responses in F. graminearum [49]. Taken the potential importance of kinase proteins in FHB resistance synthetic loci identified on 4AL and 5DL, the wheat homologs of PTI1-like tyrosine-protein kinase 1 and putative receptor protein kinase ZmPK1 might be considered as candidates of FHB resistance and need further characterization.
Conclusions
In the present study, we identified 26 FHB resistance loci using the wheat 90 K SNP assay, and four stable loci were detected in both seasons. Two new FHB resistance loci on 4AL and 5DL were found to be located on syntenic genomic regions, indicating that these regions contain important genes valuable for future research and breeding application. The SNP markers significantly associated with the FHB resistance could be used to develop diagnostic markers for marker associated selection of FHB resistance breeding.
Methods
Plant materials
An association panel comprising 171 wheat cultivars was used for SNP genotyping and 2 years FHB resistance phenotyping. Among them, three cultivars were derived from Italy, Mexico and Japan, and the other 168 cultivars were collected from 8 provinces at winter wheat region in Northern China and 9 provinces from Southern China (Additional file 1: Table S1). All wheat accessions are collected under permission from the National Genebank of China, Chinese Academy of Agricultural Sciences and Jiangsu Academy of Agricultural Sciences. The population was planted at Wanfu Experimental Station, Institute of Agricultural Sciences of the Lixiahe, Yangzhou, Jiangsu Province, China (altitude 8 m, latitude 32.24°N, annual rainfall about 1000 mm, growing season from early November to the next May) for 5 years, and flowering date were recorded every year. The 171 wheat cultivars displayed a difference of less than 4.0 days on average in flowering date between the earliest cultivar and the latest cultivar.
Field experiments were designed as randomized complete blocks with two replicates per year. The cultivars in each replication were sown in two rows of 133 × 25 cm with 40 seeds per row. The field trials were in accord with local practices management.
Phenotyping
All cultivars were inoculated in growing seasons 2016–2017 (abbr. as 2017) and 2017–2018 (abbr. as 2018) with four F. graminearum strains (F4, F15, F34, and F0609), friendly provided by Prof. Huaigu Chen from Jiangsu Academy of Agricultural Sciences, Nanjing, China. Ten spikes per row were inoculated at the late-heading stage by injecting 10 μL of macroconidial suspension (1.0 × 10⁵ conidia/ml) into a single floret in the middle of each spike based on the flowering time.
The disease nursery was mist-irrigated for 5 min every 30 min from 7:00 am to 6:00 pm each day to ensure the inoculated spikes fully infected under high humid conditions [50]. The number of infected spikelets and the total number of spikelets of every tagged spike were recorded 25 days after inoculation. The average percentage of symptomatic spikelets (PSS) was calculated as the measure of FHB severity. All tested accessions were classified into four classes based on FHB severity, resistant (0 < PSS ≤25%), moderately resistant (25% < PSS ≤50%), moderately susceptible (50% < PSS ≤75%) and susceptible (75% < PSS ≤ 100%) [51].
Genotyping and SNP calling
Genomic DNA was extracted from fresh leaves of field grown non-infected plants at seedling stage using the CTAB method [52]. The association mapping population was genotyped from the wheat Illumina 90 K iSelect array with 81,587 SNPs (Wang et al. 2014) at the Biotechnology Center, Department of Plant Sciences, University of California, USA, using the Illumina SNP genotyping platform and BeadArray Microbead Chip [53]. To avoid spurious marker-trait associations (MTAs), SNP markers with minor allele frequencies (MAF) < 0.05 and missing data > 10% were excluded from subsequent analyses. The physical positions of SNP markers were obtained from Chinese Spring reference genome sequences at the International Wheat Genome Sequencing Consortium website (IWGSC, http://www.wheatgenome.org/).
Population structure analysis and linkage disequilibrium
Population structure was estimated using Structure 2.3.4 with 1676 polymorphic SNP markers distributing on all 21 wheat chromosomes with r2 < 0.2, based on the Bayesian cluster analysis [54]. Six runs of Structure were performed with a K between 1 and 11, using the admixture model with 100,000 replicates each for burn-in and MCMC. The optimal K-value was determined using the ∆K method [55].Linkage disequilibrium (LD) among markers was computed by the full matrix and sliding window options in Tassel v5.0 with the filtered SNP markers. The pairwise LD between the markers was calculated using squared allele frequency correlations r2, according to Liu et al. [56].
GWAS for FHB resistance
Associations between genotypic and phenotypic data were analyzed using the kinship matrix in a Mixed Linear Model (MLM) by Tassel v5.0 to control background variation and eliminate spurious MTAs. The kinship matrix (K matrix) was considered as a random effect factor and the subpopulation data (Q matrix) was considered as a fixed-effect factor in the MLM analysis [57]. The calculation of K matrix and Q matrix was performed using the software Tassel v5.0 and the program Structure v2.3.4. The R2 showing the variation explained by the SNP were recorded [58]. SNPs with an adjusted -log10 (P-value) ≥3.0 were regarded as significant associated with FHB resistance. Significant SNP markers within one LD on the same chromosome were considered to represent one locus. Haplotype analyses of the significant SNPs were performed with Haploview v.4.2 [59].
Identification of candidate genes
To identify the candidate genes linked to significant SNPs, the physical positions of the markers preceded by the chromosome name were taken to Ensembl (https://urgi.versailles.inra.fr/gb2/gbrowse/wheat_survey_sequence_annotation), and the genes in the same genetic positions were considered. The intervals were then explored for predicted genes and annotations. For genes that are unavailable from the IWGSC annotations, we evaluated orthologous genes (proteins) in related species with reported predicted functions using the comparative genomics tool in Ensembl. When the genes had less than 70% similar ortholog in the annotated genomes of related species in Ensembl, the sequence of the T. aestivum gene was taken to search highly similar sequences using NCBI and basic local alignment search tool (BLAST) (http://blast.ncbi.nlm.nih.gov/Blast.cgi).
Availability of data and materials
The phenotypic data of the current study is available in the Additional file 1: Table S1. The data sets supporting the results of this research could be obtained within the article and its additional files. Any other datasets used and/or analyzed are available upon request.
Abbreviations
- DON:
-
Deoxynivalenol
- FHB:
-
Fusarium head blight
- GPC:
-
Grain protein content
- GWAS:
-
Genome-wide association study
- His:
-
Histidine-rich calcium-binding protein
- LD:
-
Linkage disequilibrium
- MAF:
-
Minor allele frequencies
- MAS:
-
Marker-assisted selection
- MLM:
-
Mixed linear model
- MTA:
-
Marker-trait association
- PFT:
-
Pore-forming toxin-like gene
- PH:
-
Plant height
- PSS:
-
The percentage of symptomatic spikelets
- QTL:
-
Quantitative trait loci
- R 2 :
-
Phenotypic variance explained
- SDS:
-
Sodium dodecyl sulfate
- SNP:
-
Single nucleotide polymorphism
- TKW:
-
Thousand kernel weight
References
Curtis T, Halford NG. Food security: the challenge of increasing wheat yield and the importance of not compromising food safety. Ann Appl Biol. 2014;164(3):354–72.
Nopsa JFH, Baenziger PS, Eskridge KM, Peiris KHS, Dowell FE, Harris SD, Wegulo SN. Differential accumulation of deoxynivalenol in two winter wheat cultivars varying in FHB phenotype response under field conditions. Can J Plant Pathol. 2012;34(3):380–9.
Rutkoski J, Benson J, Jia Y, Brown-Guedira G, Jannink J-L, Sorrells M. Evaluation of genomic prediction methods for Fusarium head blight resistance in wheat. Plant Genome J. 2012;5(2):51–61.
Ren J, Wang Z, Du Z, Che M, Zhang Y, Quan W, Wang Y, Jiang X, Zhang Z. Detection and validation of a novel major QTL for resistance to Fusarium head blight from Triticum aestivum in the terminal region of chromosome 7DL. Theor Appl Genet. 2019;132(1):241–55.
Bai G, Shaner G. Scab of wheat: prospects for control. Plant Dis. 1994;78(8):760–6.
Bai G, Shaner G. Management and resistance in wheat and barley to Fusarium head blight. Annu Rev Phytopathol. 2004;42:135–61.
Buerstmayr H, Ban T, Anderson JA. QTL mapping and marker-assisted selection for Fusarium head blight resistance in wheat: a review. Plant Breed. 2009;128(1):1–26.
Gilbert J, Haber S. Overview of some recent research developments in Fusarium head blight of wheat. Can J Plant Pathol. 2013;35(2):149–74.
Chen Y, Wang J, Yang N, Wen Z, Sun X, Chai Y, Ma Z. Wheat microbiome bacteria can reduce virulence of a plant pathogenic fungus by altering histone acetylation. Nat Commun. 2018;9(1):3429.
Campbell KA, Lipps PE. Allocation of resources: sources of variation in fusarium head blight screening nurseries. Phytopathology. 1998;88(10):1078–86.
Fuentes RG, Mickelson HR, Busch RH, Dill-Macky R, Evans CK, Thompson WG, Wiersma JV, Xie W, Dong Y, Anderson JA. Resource allocation and cultivar stability in breeding for Fusarium head blight resistance in spring wheat. Crop Sci. 2005;45(5):1965–72.
Mesterhazy A, Bartok T, Mirocha CG, Komoroczy R. Nature of wheat resistance to Fusarium head blight and the role of deoxynivalenol for breeding. Plant Breed. 1999;118:97–110.
Mesterhazy A. Types and components of resistance to Fusarium head blight of wheat. Plant Breed. 1995;114(5):377–86.
Petersen S, Lyerly JH, Maloney PV, Brown-Guedira G, Cowger C, Costa JM, Dong Y, Murphy JP. Mapping of Fusarium head blight resistance quantitative trait loci in winter wheat cultivar NC-Neuse. Crop Sci. 2016;56(4):1473–83.
Arruda MP, Brown P, Brown-Guedira G, Krill AM, Thurber C, Merrill KR, Foresman BJ, Kolb FL. Genome-wide association mapping of fusarium head blight resistance in wheat using genotyping-by-sequencing. Plant Genome. 2016;9(1). https://doi.org/10.3835/plantgenome2015.04.0028.
Jia H, Zhou J, Xue S, Li G, Yan H, Ran C, Zhang Y, Shi J, Jia L, Wang X, et al. A journey to understand wheat Fusarium head blight resistance in the Chinese wheat landrace Wangshuibai. Crop J. 2018;6(1):48–59.
Giancaspro A, Giove SL, Zito D, Blanco A, Gadaleta A. Mapping QTLs for Fusarium head blight resistance in an interspecific wheat population. Front Plant Sci. 2016;7:1381.
Rawat N, Pumphrey MO, Liu S, Zhang X, Tiwari VK, Ando K, Trick HN, Bockus WW, Akhunov E, Anderson JA, et al. Wheat Fhb1 encodes a chimeric lectin with agglutinin domains and a pore-forming toxin-like domain conferring resistance to Fusarium head blight. Nat Genet. 2016;48(12):1576–80.
Su Z, Bernardo A, Tian B, Chen H, Wang S, Ma H, Cai S, Liu D, Zhang D, Li T, et al. A deletion mutation in TaHRC confers Fhb1 resistance to Fusarium head blight in wheat. Nat Genet. 2019;51(7):1099–105.
Li G, Zhou J, Jia H, Gao Z, Fan M, Luo Y, Zhao P, Xue S, Li N, Yuan Y, et al. Mutation of a histidine-rich calcium-binding-protein gene in wheat confers resistance to Fusarium head blight. Nat Genet. 2019;51(7):1106–12.
Lagudah ES, Krattinger SG. A new player contributing to durable Fusarium resistance. Nat Genet. 2019;51(7):1070–1.
McDonald BA, Linde C. Pathogen population genetics, evolutionary potential, and durable resistance. Annu Rev Phytopathol. 2002;40:349–79.
Miedaner T, Korzun V. Marker-assisted selection for disease resistance in wheat and barley breeding. Phytopathology. 2012;102(6):560–6.
Hao Y, Rasheed A, Zhu Z, Wulff BBH, He Z. Harnessing wheat Fhb1 for fusarium resistance. Trends Plant Sci. 2019. https://doi.org/10.1016/j.tplants.2019.10.006.
Zhu Z, Hao Y, Mergoum M, Bai G, Humphreys G, Cloutier S, Xia X, He Z. Breeding wheat for resistance to fusarium head blight in the Global North: China, USA, and Canada. Crop J. 2019. https://doi.org/10.1016/j.cj.2019.06.003.
Rasheed A, Wen W, Gao F, Zhai S, Jin H, Liu J, Guo Q, Zhang Y, Dreisigacker S, Xia X, et al. Development and validation of KASP assays for genes underpinning key economic traits in bread wheat. Theor Appl Genet. 2016;129(10):1843–60.
Liu J, Feng B, Xu Z, Fan X, Jiang F, Jin X, Cao J, Wang F, Liu Q, Yang L, et al. A genome-wide association study of wheat yield and quality-related traits in Southwest China. Mol Breed. 2017;38(1):11.
Li F, Wen W, Liu J, Zhang Y, Cao S, He Z, Rasheed A, Jin H, Zhang C, Yan J, et al. Genetic architecture of grain yield in bread wheat based on genome-wide association studies. BMC Plant Biol. 2019;19(1):168.
International Wheat Genome Sequencing C, Investigators IRp, Appels R, Eversole K, Feuillet C, Keller B, Rogers J, Stein N, Investigators Iw-gap, Pozniak CJ, et al. Shifting the limits in wheat research and breeding using a fully annotated reference genome. Science. 2018;361(6403). https://doi.org/10.1126/science.aar7191.
Juliana P, Singh RP, Singh PK, Poland JA, Bergstrom GC, Huerta-Espino J, Bhavani S, Crossa J, Sorrells ME. Genome-wide association mapping for resistance to leaf rust, stripe rust and tan spot in wheat reveals potential candidate genes. Theor Appl Genet. 2018;131(7):1405–22.
Li T, Bai G, Wu S, Gu S. Quantitative trait loci for resistance to Fusarium head blight in the Chinese wheat landrace Huangfangzhu. Euphytica. 2012;185(1):93–102.
Holzapfel J, Voss HH, Miedaner T, Korzun V, Haberle J, Schweizer G, Mohler V, Zimmermann G, Hartl L. Inheritance of resistance to Fusarium head blight in three European winter wheat populations. Theor Appl Genet. 2008;117(7):1119–28.
Paillard S, Schnurbusch T, Tiwari R, Messmer M, Winzeler M, Keller B, Schachermayr G. QTL analysis of resistance to Fusarium head blight in Swiss winter wheat (Triticum aestivum L.). Theor Appl Genet. 2004;109(2):323–32.
Agenbag GM, Pretorius ZA, Boyd LA, Bender CM, MacCormack R, Prins R. High-resolution mapping and new marker development for adult plant stripe rust resistance QTL in the wheat cultivar Kariega. Mol Breed. 2014;34(4):2005–20.
Yang J, Bai G, Shaner GE. Novel quantitative trait loci (QTL) for Fusarium head blight resistance in wheat cultivar Chokwang. Theor Appl Genet. 2005;111(8):1571–9.
Jia G, Chen PD, Qin GJ, Bai GH, Wang X, Wang SL, Zhou B, Zhang SH, Liu DJ. QTLs for Fusarium head blight response in a wheat DH population of Wangshuibai/Alondra’s’. Euphytica. 2005;146(3):183–91.
Liu S, Yang X, Zhang D, Bai G, Chao S, Bockus W. Genome-wide association analysis identified SNPs closely linked to a gene resistant to soil-borne wheat mosaic virus. Theor Appl Genet. 2014;127(5):1039–47.
An D, Zheng Q, Zhou Y, Ma P, Lv Z, Li L, Li B, Luo Q, Xu H, Xu Y. Molecular cytogenetic characterization of a new wheat-rye 4R chromosome translocation line resistant to powdery mildew. Chromosom Res. 2013;21(4):419–32.
Ali F, Muneer M, Xu J, Durrishahwar A, Ur Rahman H, Lu Y, Hassan W, Ullah H, Noor M, Ullah I, et al. Accumulation of desirable alleles for southern leaf blight (SLB) in maize (Zea mays L.) under the epiphytotic of Helminthosporium maydis. Aust J Crop Sci. 2012;6(8):1283–9.
Devos KM, Dubcovsky J, Dvorak J, Chinoy CN, Gale MD. Structural evolution of wheat chromosomes 4A, 5A, and 7B and its impact on recombination. Theor Appl Genet. 1995;91(2):282–8.
Dvorak J, Wang L, Zhu T, Jorgensen CM, Luo MC, Deal KR, Gu YQ, Gill BS, Distelfeld A, Devos KM, et al. Reassessment of the evolution of wheat chromosomes 4A, 5A, and 7B. Theor Appl Genet. 2018;131(11):2451–62.
Liang X, Zhou JM. Receptor-like cytoplasmic kinases: central players in plant receptor kinase-mediated signaling. Annu Rev Plant Biol. 2018;69:267–99.
Fu D, Uauy C, Distelfeld A, Blechl A, Epstein L, Chen X, Sela H, Fahima T, Dubcovsky J. A kinase-START gene confers temperature-dependent resistance to wheat stripe rust. Science. 2009;323(5919):1357–60.
Klymiuk V, Yaniv E, Huang L, Raats D, Fatiukha A, Chen S, Feng L, Frenkel Z, Krugman T, Lidzbarsky G, et al. Cloning of the wheat Yr15 resistance gene sheds light on the plant tandem kinase-pseudokinase family. Nat Commun. 2018;9(1):3735.
Brueggeman R, Rostoks N, Kudrna D, Kilian A, Han F, Chen J, Druka A, Steffenson B, Kleinhofs A. The barley stem rust-resistance gene Rpg1 is a novel disease-resistance gene with homology to receptor kinases. Proc Natl Acad Sci U S A. 2002;99(14):9328–33.
Zuo W, Chao Q, Zhang N, Ye J, Tan G, Li B, Xing Y, Zhang B, Liu H, Fengler KA, et al. A maize wall-associated kinase confers quantitative resistance to head smut. Nat Genet. 2015;47(2):151–7.
Herrmann MM, Pinto S, Kluth J, Wienand U, Lorbiecke R. The PTI1-like kinase ZmPti1a from maize (Zea mays L.) co-localizes with callose at the plasma membrane of pollen and facilitates a competitive advantage to the male gametophyte. BMC Plant Biol. 2006;6:22.
Hou Z, Xue C, Peng Y, Katan T, Kistler HC, Xu JR. A mitogen-activated protein kinase gene (MGV1) in Fusarium graminearum is required for female fertility, heterokaryon formation, and plant infection. Mol Plant-Microbe Interact. 2002;15(11):1119–27.
Qin J, Wang G, Jiang C, Xu JR, Wang C. Fgk3 glycogen synthase kinase is important for development, pathogenesis, and stress responses in Fusarium graminearum. Sci Rep. 2015;5:8504.
Yi X, Cheng J, Jiang Z, Hu W, Bie T, Gao D, Li D, Wu R, Li Y, Chen S, et al. Genetic analysis of Fusarium head blight resistance in CIMMYT bread wheat line C615 using traditional and conditional QTL mapping. Front Plant Sci. 2018;9:573.
Li T, Luo M, Zhang D, Wu D, Li L, Bai G. Effective marker alleles associated with type 2 resistance to Fusarium head blight infection in fields. Breed Sci. 2016;66(3):350–7.
Sharp PJ, Chao S, Desai S, Gale MD. The isolation, characterization and application in the Triticeae of a set of wheat RFLP probes identifying each homoeologous chromosome arm. Theor Appl Genet. 1989;78:342–8.
Cavanagh CR, Chao S, Wang S, Huang BE, Stephen S, Kiani S, Forrest K, Saintenac C, Brown-Guedira GL, Akhunova A, et al. Genome-wide comparative diversity uncovers multiple targets of selection for improvement in hexaploid wheat landraces and cultivars. Proc Natl Acad Sci U S A. 2013;110(20):8057–62.
Pritchard JK, Stephens M, Rosenberg NA, Donnelly P. Association mapping in structured populations. Am J Hum Genet. 2000;67:170–81.
Evanno G, Regnaut S, Goudet J. Detecting the number of clusters of individuals using the software STRUCTURE: a simulation study. Mol Ecol. 2005;14(8):2611–20.
Liu J, He Z, Rasheed A, Wen W, Yan J, Zhang P, Wan Y, Zhang Y, Xie C, Xia X. Genome-wide association mapping of black point reaction in common wheat (Triticum aestivum L.). BMC Plant Biol. 2017;17(1):220.
Yu J, Pressoir G, Briggs WH, Vroh Bi I, Yamasaki M, Doebley JF, McMullen MD, Gaut BS, Nielsen DM, Holland JB, et al. A unified mixed-model method for association mapping that accounts for multiple levels of relatedness. Nat Genet. 2006;38(2):203–8.
Bradbury PJ, Zhang Z, Kroon DE, Casstevens TM, Ramdoss Y, Buckler ES. TASSEL: software for association mapping of complex traits in diverse samples. Bioinformatics. 2007;23(19):2633–5.
Barrett JC, Fry B, Maller J, Daly MJ. Haploview: analysis and visualization of LD and haplotype maps. Bioinformatics. 2005;21(2):263–5.
Acknowledgments
The authors are grateful Dr. Jindong Liu, Agricultural Genomics Institute at Shenzhen, Chinese Academy of Agricultural Sciences for critical review of this manuscript.
Funding
This work was supported by the National Natural Science Foundation of China (31901544), National Key Research and Development Program of China (2017YFD0100801; 2016YFD0101802), the Natural Science Foundation of Jiangsu Province (BK20171279), the China Agricultural Research System (CARS-03-03B). Each of the funding bodies granted the funds based on a research proposal. National Key Research and Development Program of China (2017YFD0100801; 2016YFD0101802) assisted in designing of the study and collection, analysis, and interpretation of data and in writing the manuscript. Other fundings had no influence over the design of the study and collection, analysis, and interpretation of data and in writing the manuscript.
Author information
Authors and Affiliations
Contributions
WJH carried out the experiments and wrote the paper. DRG and HYW participated in the field trials and assisted in revising the paper. JL, CMZ, JCW, ZNJ, YYL and DSL, participated in the field trials. YZ and CBL designed the experiment and assisted in analyzing the data and writing the paper. All authors read the final version of this manuscript and approved it for publication.
Corresponding authors
Ethics declarations
Ethics approval and consent to participate
We declare that these experiments comply with the ethical standards and legislations in China, and all wheat varieties were collected in accordance with national guidelines.
Consent for publication
Not applicable.
Competing interests
The authors declare that they have no competing interests.
Additional information
Publisher’s Note
Springer Nature remains neutral with regard to jurisdictional claims in published maps and institutional affiliations.
Supplementary information
Additional file 1: Table S1
171 wheat accessions used in the genome-wide association study (GWAS) for FHB severities and their origins, Table S2 Marker-trait associations (MTAs) for FHB resistance in 171 wheat accessions identified by the Tassel v5.0, Table S3 Cultivars belonging to different haplotype and their FHB severities, Table S4 Physical positions of reported FHB resistance QTL related to the current study, Table S5 The associated regions with FHB resistance with the same function exists in the corresponding sections of 4A and 5D.
Rights and permissions
Open Access This article is distributed under the terms of the Creative Commons Attribution 4.0 International License (http://creativecommons.org/licenses/by/4.0/), which permits unrestricted use, distribution, and reproduction in any medium, provided you give appropriate credit to the original author(s) and the source, provide a link to the Creative Commons license, and indicate if changes were made. The Creative Commons Public Domain Dedication waiver (http://creativecommons.org/publicdomain/zero/1.0/) applies to the data made available in this article, unless otherwise stated.
About this article

Cite this article
Hu, W., Gao, D., Wu, H. et al. Genome-wide association mapping revealed syntenic loci QFhb-4AL and QFhb-5DL for Fusarium head blight resistance in common wheat (Triticum aestivum L.). BMC Plant Biol 20, 29 (2020). https://doi.org/10.1186/s12870-019-2177-0
Received:
Accepted:
Published:
DOI: https://doi.org/10.1186/s12870-019-2177-0