
Abstract
This study focuses on understanding the factors that influence end-users’ (customers’) acceptance of fintech services in the insurance industry. The study employed a modified Unified Theory of Acceptance and Use of Technology 2 model, incorporating perceived security and personal innovativeness as independent variables, and trust as a moderating variable. A total of 391 responses were analyzed using partial least squares structural equation modeling in SmartPLS software. The study’s findings indicate that factors such as effort expectancy, social influence, facilitating conditions, perceived, and personal innovativeness positively affect users’ behavioral intention (BI) to use fintech services in the insurance industry. Moreover, BI positively influences the actual use (AU) of fintech services. Additionally, trust plays a positive moderating role between BI and AU. The results of this study have practical implications for academicians, researchers, insurance companies, and insurance regulatory bodies. Academicians and researchers can further explore the acceptance of fintech in developing countries based on these findings. Insurance companies and regulatory bodies can take necessary steps and formulate strategies to promote the adoption of fintech services in the insurance industry, considering the identified factors and the role of trust.
Introduction
“Financial Technology” (Fintech) is one of the most recent developments. Practically every industry, particularly the financial sector, utilizes this technology to manage business operations. It primarily focuses on leveraging information technology (IT) to enhance the quality of financial services (Gai et al. 2018). Fintech represents the convergence of financial services and information technology, resulting in a financial service supported by technology (Arner et al. 2015). Schueffel (2016) highlighted fintech’s transformative potential in traditional financial services and the development of new business models, procedures, software, goods, and services. Furthermore, Fintech has had an impact on customer treatment, prompting the financial sector, including banks, insurance companies, and non-banking financial organizations, to adopt various business models and technologies to better serve their clients. The emergence of Fintech has also reshaped the competitive landscape and the financial services ecosystem, altering the dynamics of the financial sector. According to the RBI Report (2018), fintech services have the potential to enhance efficiency, reduce risk, and foster inclusive growth. The highly regulated financial services sector may undergo significant changes to traditional business models as a result of these technological advancements, offering customers a unique and personalized experience (Leong et al. 2017).
The global adoption of fintech among insurance companies in 2023 is characterized by a significant shift toward integrating digital technology with traditional products. This trend is driven by increasing customer expectations for higher levels of service and the desire for digital solutions (McKinsey 2023). According to Ayoconnect (2022, March 3), the integration of fintech into the insurance sector enables companies to provide their clients with a more secure and user-friendly experience. Innovations like the utilization of online portals and mobile applications for the administration of policies and the submission of claims are currently being adopted by numerous insurance providers. Moreover, the adoption of fintech services among the customers has also increased. According to the EY FinTech Adoption Index (2019), 64% of individuals worldwide have adopted fintech services, with China and India leading with an adoption rate of 87%. Furthermore, 96% of consumers worldwide are aware of at least one fintech payment provider, and one out of every two consumers and three out of every four people use an insurance fintech service. Additionally, 14% of consumers are aware of fintech services specifically related to insurance. These statistics highlight the growing acceptance and utilization of fintech services, including those in the insurance sector, among consumers globally.
As a developing economy, Bangladesh’s insurance sector lags among other emerging Asian countries in terms of insurance coverage and contribution to gross domestic product (GDP). According to the Swiss Re Institute Report (2022), the insurance industry in Bangladesh accounts for only 0.4% of the GDP. Additionally, Bangladesh ranks low in the worldwide Findex rating, placing 78th out of 83 nations, as reported by Findexable (2021). Through technological advancements like fintech and Insurtech, the insurance sector is expanding globally (Global Insurance Report 2022). However, the Bangladesh insurance industry only introduced fintech services for their customers. The available fintech services are limited to digital payment platforms and digital insurance. According to Khan and Uddin (2020), one of the critical factors of the non-popularity of insurance among customers is a lack of information on insurance companies, especially electronic services. Customers are unaware what are the available payment channels they can use to pay premiums and purchase insurance policies. As a result, customers tend to use the traditional way of paying premiums through cash counters of the insurance companies and selected bank counters, which results in higher transaction costs for them and higher administrative costs for companies. This process lacks performance and effort expectancy. In addition, there is a lack of technical expertise among employees, poor IT support for customers, and ineffective management insurance industry (Mamun 2016). It creates concern about the facilitating conditions available among the insurance industry customers in using fintech services provided by insurance companies. Moreover, instances of insurance fraud and mismanagement within the industry erode customer trust and contribute to a lack of perceived security (Ali 2020). To address these challenges, marketing fintech services that enable users to transact through mobile and smart devices can play a crucial role. By promoting user-friendly, quick, and secure fintech solutions, insurance companies can attract well-informed and technologically literate customers who prefer managing their insurance contracts digitally. Through adopting fintech services, the insurance business may experience significant growth (Das 2021, March 5).
With the growing acceptance of fintech services across various sectors, the scholarly focus has increasingly turned toward understanding consumer intentions and satisfaction in adopting these services (Andrews et al. 2021; Al-Okaily 2023; Chen et al. 2021). However, there are still significant gaps in this research area. The relationship between fintech and customer adoption remains an evolving field that demands further in-depth study. Earlier research used UTAUT2 as the underpinning theory for fintech adoption studies because the explanatory power of the model is higher than any other technology adoption model (Hassan 2023). However, the results showed inconsistent results for performance expectancy (PE), EE, SI, and FC. While previous research has shed light on the technological aspects driving customer adoption of fintech (Anshari et al. 2021; Gupta et al. 2023) there is a need to incorporate user perspectives and security dimensions. Notably, the role of PS, especially concerning security and personal data and PI is crucial in influencing fintech usage. Moreover, the significance of trust is higher, especially in the context of fintech services like online transactions, due to the lack of personal touch, high degree of uncertainty, and nature of the Internet. There are rare studies that used trust as a moderating variable between BI and AU.
Existing literature shows a lack of research specifically focused on Fintech acceptance, particularly in the realm of its adoption within the Insurance industry. This study contributes to the existing literature by identifying the factors that drive the adoption of Fintech services in Bangladesh’s insurance industry. In addition, this study proposes a modified UTAUT2 model by integrating perceived security, personal innovativeness, and trust. This research stands out in addressing these gaps, especially in the context of the insurance industry. Moreover, this study extends beyond the banking sector to include the insurance industry, offering new insights and practical implications, particularly for the Bangladesh Insurance industry. So, the study answers the following research questions:
RQ1: What are the factors influencing the insurance industry customers to accept fintech services?
RQ2: Does trust moderate the relationship between behavioral intention and actual use of Fintech services in the Bangladesh insurance industry?
The rest of the paper will be organized in the following order. Literature review and hypothesis development in section “Literature review”, research methodology in section "Methodology", findings and analysis in section. "Data analysis and findings", and conclusion in section "Conclusion".
Literature review
Fintech services adoption
Together with big tech’s steadily growing share of the financial services industry, the Fintech phenomenon is changing the structure of financial intermediation (Hasan et al. 2023). Consumers now have access to fintech applications that enable them to handle various financial activities such as payments, savings, borrowing, risk management, and financial advice (Aloulou et al. 2023). In response to this demand, companies are developing more user-friendly and affordable ways for customers to transfer funds, borrow money, and invest using technology (Manyika et al. 2016).
Previous research has primarily focused on examining fintech adoption through the lens of behavioral intention to use the technology (Alwi 2021). While fintech services are widely accepted, there has been limited research on how adoption intentions translate into actual usage. Most studies have either emphasized BI or continuous usage intention. However, some studies have used actual usage of fintech adoption as the dependent variable. For instance, Setiawan et al. (2021) investigated the relationship between user innovativeness and fintech adoption in Indonesia using actual adoption/acceptance of fintech services as the dependent variable. Similarly, Ferdaous and Rahman (2021) used actual use (AU) to identify fintech adoption. By examining the actual usage of fintech adoption, researchers can gain a deeper understanding of the factors that influence the adoption and use of fintech services. This approach provides insights into how consumers are utilizing fintech in real-world scenarios and can inform strategies to promote wider adoption and usage of fintech solutions.
UTAUT2
The UTAUT model was expanded into UTAUT2 by Venkatesh et al. in (2012). Venkatesh et al. (2012) modified the UTAUT2 model considering the consumer usage environment and added a new component to the UTAUT. This model incorporated new relationships, modified some previous ones, and added new constructs. Three new constructs were added to the model. As the determinants of BI, there are seven independent variables: performance expectancy, effort expectancy, facilitating conditions, social influence, hedonic motivation, price, and habit. Finally, BI affects the actual use. This study’s underpinning theory is based on the UTAUT2 model created by Venkatesh et al. (2012). Compared to other well-established models, the model may explain 56–74% of the BI and 40–52% of the actual usage.
UTAUT2 is an experimentally tested comprehensive, casual model that applies to numerous domains and characterizes and forecasts technological acceptance (Dowdy 2020; Khan et al. 2017; Sumak and Sorgo, 2016). It is employed across various industries, from adopting AI in libraries (Andrews et al. 2021) to predicting buy intent in e-commerce platforms (Chen et al. 2021). Except for the parsimony resulting from the complex model, the UTAUT2 is regarded as a resilient theory (Weber 2012). By incorporating cognitive antecedents, Khazaei (2020) used UTAUT2 to analyze the adoption of blockchain by Malaysian SMEs. To determine the criteria for implementing a fintech P2P lending platform in small food enterprises in Indonesia, Najib et al. (2021) included the UTAUT2 model. Additionally, Khatun and Tamanna (2020) used the UTAUT model and factors like perceived dependability, self-efficacy, anxiousness, and added value to analyze the adoption of fintech in financial institutions in Bangladesh. According to Choi (2016), UTAUT2 failed to show the components contributing to enjoyment while including hedonic motivation as a predictor of BI. In addition, “Habit” is not a concept that can be used to analyze newly released technologies (Tamilmani et al. 2018). Nevertheless, despite limitations, the UTAUT2 model has the highest explanatory power among the other theories. This study will utilize a modified UTAUT2 by integrating variables like personal innovativeness, perceived security, and trust.
Performance expectancy (PE)
PE refers to a technology’s capacity to benefit users when accomplishing tasks (Venkatesh et al. 2012). The possibility of a user or client employing a technology rises if they find it useful. PE was used by Venkatesh et al. (2012) as an independent variable determining BI in the UTAUT2 model. According to the literature, PE has a mixed effect on BI, which several researchers have used to measure intention to use technology. Ramos (2017) examined the intention of the millennial generation to adopt fintech. The outcome showed that PE greatly influenced the decision to use fintech services. In Kuwait, the fintech age and PE were found to have a comparable, significant favorable effect on m-wallet adoption intention (Rabaa'i 2023). On the other hand, Yohanes et al. (2020) discovered that PE had little to no effect on the decision to use a fintech application. Additionally, Malaysians’ PE toward their intention to use cryptocurrencies (fintech) were not linked, according to Miraz et al. (2022). The result is inconsistent. However, this study will use PE to examine the adoption of fintech services in the Bangladesh insurance sector as a predictor of the desire to use fintech services. This study puts out the following hypothesis considering the findings of earlier studies on technology adoption in Bangladesh.
H1
Performance expectancy has a positive effect on behavioral intention.
Effort expectancy (EE)
The term “effort expectancy” refers to how easily consumers can use new technologies (Venkatesh et al. 2012). Because consumers will not adopt a new technical service unless they think it to be simple, EE is a critical factor in determining whether it will be adopted. The research demonstrates that EE has a favorable effect on BI. The adoption of financial technology (e-money) in Indonesia was examined by Rahardjo et al. (2020), and the findings showed that EE has a beneficial effect on the intention to use e-money. EE benefited the desire to utilize fintech payment services among freshly employed graduates in Malaysia (Ahmad et al. 2021). Similar findings were made on Indonesian private banking’s intention to implement fintech (Tohang et al. 2021). Nevertheless, Rahim et al. (2022) analyzed Malaysian millennials’ intentions to adopt Islamic fintech and found no relationship between EE and BI. Additionally, the intention to adopt e-government services was unaffected by the EE (Mensah 2019). According to the findings of earlier studies, EE showed inconsistent findings. However, significant research discovered that EE had a favorable effect on the desire to embrace fintech services. The customers of the insurance sector in a developing nation will be the subject of the study. Therefore, there is a chance that EE may positively affect BI. So, the study proposes the following hypothesis:
H2
Effort expectancy has a positive effect on behavioral intention.
Facilitating conditions (FC)
According to Venkatesh et al. (2012), FC give customers the impression that they have the resources and support they need to use technology to carry out a task. FC are defined as consumers’ perceptions of having the necessary support and resources to carry out an activity using technology. According to studies by Venkatesh et al. (2003) and Venkatesh et al. (2012), FC were found to have a positive relationship with technology use intention and actual use. A user or customer needs technical support and assistance to carry out any action. The consumer must get technical support from the service provider when voluntarily adopting a new technology service. Yahaya and Ahmad (2019) assert that FC benefits the use of financial technology for the distribution of zakat. In their analysis of the intention and use of e-money as financial technology, Rahardjo et al. (2020) discovered that FC favorably effects BI and AU toward e-money. The same influence of FC on determining the adoption of fintech in Bangladeshi financial institutions was also discovered by Khatun and Tamanna (2020). Additionally, it was discovered that FC had a beneficial effect on Malaysian microentrepreneurs’ adoption of Shariah-compliant fintech (Azman and Zabri 2022). However, users’ adoption of fintech services is unaffected by FC, according to a study on user satisfaction with fintech market aggregators (Regina et al. 2021). Even Xie et al. (2021) concluded that FC have little bearing on a willingness to adopt fintech in a study on adopting fintech platforms. Based on the previous literature results, this study will utilize FC as a positive predictor of customers’ fintech services acceptance in the insurance industry. Thus, it can be hypothesized that,
H3
Facilitating conditions has a positive effect on behavioral intentions.
H4
Facilitating conditions has a positive effect on actual use.
Social influence (SI)
According to Venkatesh et al. (2012), SI is the consumer’s view that his or her family, friends, and other influential people think he or she should use new technology. The role of SI in the adoption of new technology is significant. The intention to use fintech applications is positively influenced by SI, according to Al Nawayseh (2020). Even Bin-Nashwan (2022) examined the intention to use fintech (e-zakat) by employing SI as a predictive variable. The study found that SI had a significant beneficial impact. A similar outcome was also discovered in Indonesia’s plan to implement Shariah-compliant fintech (Mansyur and Ali 2022). Tohang et al. (2021) analysis of bank users’ intentions to adopt fintech 3.0 revealed that SI does not affect their intentions. Marzuki and Nurdin (2020) found that SI cannot motivate customers and have no influence on intention to adopt Shariah financial technology products. The effect of SI varies, and it is inconsistent. Nevertheless, SI will be utilized as a positive predicting variable of intention to adopt fintech services for insurance industry customers. Therefore, the study proposes the following hypothesis.
H5
Social influence has a positive effect on behavioral intention.
Perceived security (PS)
PS is the subjective possibility that customers’ private and financial information will not be viewed, stored, or altered by unauthorized parties during transit and storage consistent with their confident expectations (Flavian and Guinal’u, 2006). When using new technology, consumers are worried about security. They will not embrace the new technology, even if they find a security hole. According to the literature, PS seems to favorably affect the intention to use. In a study by Lee (2018) to determine consumers’ intentions to adopt fintech services like Bitcoin, it was discovered that PS is a reliable predictor of those intentions. Additionally, the propensity to utilize fintech payment services was positively influenced by PS (Irawan and Affan 2020). Permatasari and Kartawinata's (2021) analyzed the relationship between PS and interest in utilizing the OVO fintech application and revealed a favorable and significant impact of PS on BI. Additionally, Singh and Rajeev’s (2021) study on small retailers’ intentions to adopt fintech revealed that PS significantly affects BI. Similar conclusions were made known in a study on the intention to use fintech services in Indonesia (Taufiq 2021). It is clear from the research that PS is positively correlated with BI. Therefore, a customer’s PS might benefit their decision to utilize fintech services. Consequently, the study suggests the following hypothesis.
H6
Perceived security has a positive effect on behavioral intention.
Personal innovativeness (PI)
The ability to experiment with new technology is PI (Agarwal et al. 1998). The adoption of new technology products and services depends heavily on individual innovation. An individual’s propensity to adopt new technology increases with their level of innovation. The literature indicates that innovativeness is one of the best predictors of adopting new technology. The intention of clients to use fintech services is strongly correlated with PI, according to Tun-Pin et al. (2019). Additionally, according to Wirani et al. (2022), PI had a favorable effect on Indonesians’ acceptance of fintech leading services. Additionally, Khan et al. (2022) concluded that PI positively promotes the intention to use Islamic financial technology. In a study done in Vietnam, PI was employed as a positive predictive variable, and the variable positively impacted the adoption of fintech (Nathan et al. 2022). A similar outcome was found in research based on the uptake of mobile banking services in Poland (Solarz and Adamek 2022). A comprehensive review of prior research on PI suggests that the variable is a substantial positive predictor of adopting new technologies. Therefore, PI influences insurance business clients’ intentions to adopt a developing nation. Consequently, the study proposes the following hypothesis,
H7
Personal innovativeness has a positive effect on behavioral intention.
Behavioral intention (BI)
The phrase “intention to use” refers to a user’s anticipated propensity to use something in a particular situation (IOM 2002). According to Wang et al. (2006), consumers’ intentions to accept and use the new system are influenced by their comprehension of its functions, advantages, features, and other people’s perceptions of it. The likelihood of using technology positively affects its actual utilization. Studies have shown that, in a non-voluntary environment, BI significantly improves AU (Venkatesh et al. 2003). Similar results were seen in a volunteer scenario (Venkatesh et al. 2012; Owusu Kwateng et al. 2019). This study puts out the following hypothesis based on the literature.
H8
Behavioral intention has a positive effect on actual use.
The moderating role of trust (T)
According to Castel Franchi and Falcone (2000), an individual’s judgment of another person or organization should be consistent, honest, strong, and able. According to Gefen (2004), trust is confidence in the honesty, knowledge, and generosity of a person or an organization. It is the most important component in maintaining long-term connections between individuals and organizations (Humphries and Wilding 2004). A lack of confidence in the security of the system prevents consumers from adopting new technologies (Al-Sajjan and Dennis 2010). Ali et al. (2021) identified trust as a crucially important positive signal in their analysis of the factors influencing Islamic fintech adoption intentions. Additionally, Hassan et al. (2022a, b) found a positive correlation between T and the intention to use mobile fintech services. A similar result was reached in a study on the health insurance system by Arkorful et al. (2021). However, an independent variable (antecedent) on the dependent variable is a possible scenario for testing a moderator (Memon et al. 2019). Additionally, moderators might be selected according to theoretical underpinnings backed by significant literature findings (Frazier et al. 2004). According to Dawson (2014), moderation is the adaptation of the connection between independent and dependent variables to the magnitude of a moderator variable. T has been used as a moderating variable in a variety of behavioral contexts, including significant environmental behavior by Moon et al. (2017) and company adoption of electronic commerce by Alsaad et al. (2017). It will therefore be intriguing to discover whether T modifies the relationship between BI and AU of fintech services in the insurance industry. This study puts out the following hypothesis based on the literature.
H9
Trust moderates the relationship between behavioral intention and actual use.
Based on the literature review section, rare research on fintech acceptance in Bangladesh has been done. No study specifically examined the fintech acceptance in Bangladesh’s insurance industry. This study will introduce a research model to identify the factors influencing the acceptance of fintech services to fill the knowledge gaps mentioned in the earlier section. This model will allow academicians and practitioners to comprehend the factors influencing customers’ behavior, intention, and symbolic usage of fintech services in the insurance industry. The proposed research framework is given in Fig. 1.
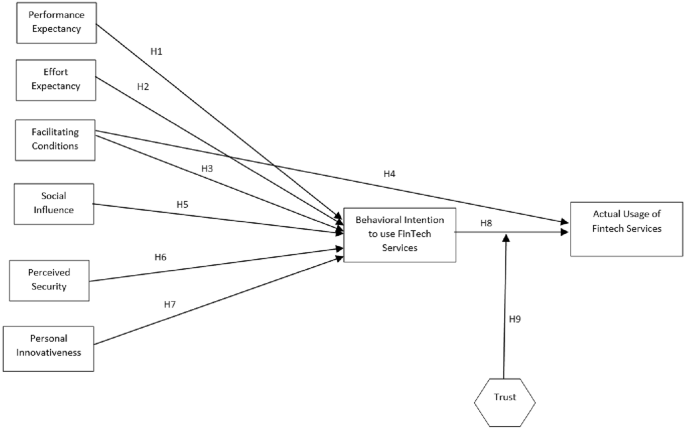
Proposed research framework
Methodology
Research design and approach
The study aimed to determine what motivates insurance industry consumers to accept fintech services. As a result, the study’s purpose is explanatory. The past literature on technology adoption makes it clear that the authors conducted explanatory research to pinpoint the effects of various variables on technology adoption (Cao and Nio 2019). Quantitative technique, empirical epistemology, and positivist ontology are followed in the study. This study is cross-sectional in nature. Due to the quantitative nature of the research and the need to find correlations between various variables, this study employed a deductive research approach.
Data collection procedure and data sampling
A survey questionnaire was employed as the primary data collection method. Two research assistants (RAs) who work as insurance companies’ guides were appointed to facilitate the data collection process. The data collection was done from October 2022 to December 2022. This study only included the insurance companies that are currently offering fintech services like digital payment platforms and digital insurance to their customers. The data were collected from the customers of the top ten insurance companies in Bangladesh. These ten insurance companies were chosen because their market share consists of 85%. RAs visited the customer care centers of these insurance companies located in Dhaka, Sylhet, and Chattogram region. Before collecting data from the customer care points formal approval from the insurance companies was taken from the companies’ authority to survey their premises. Research assistants provided a hard copy of the survey questionnaire to the customers who consented to participate in this study. A signed consent form was received from each respondent. The research assistants personally administer the survey questionnaire. If customers face problems understanding the questions, the research assistants clarify the questions to the respondents. Before collecting the survey responses from the customers’ research assistants ensured that all the questions were correctly answered. After confirmation, research assistants collected the filled-up questionnaire from the customer and input the data into an online Google Form.
The study employed judgmental (purposive) non-probability sampling since it selects individuals best positioned to provide the needed information (Sekeran & Bougie, 2016). To simplify the sample size decision, Sekaran and Bougie (2009) proposed a table that ensures a good decision model. As per table, the minimum sample size for the ≥ 10,00,000 population is 384. So, this study followed the table developed by Sekaran and Bougie (2009) and used a minimum sample size of 384 for analysis as the number of consumers who hold insurance policies is unknown. However, 391 responses were received from insurance industry customers.
Data analysis procedure
The study utilized structural equation modeling to analyze the results. A seven-point Likert scale was used to measure the results of earlier fintech adoption studies (Hassan et al. 2022a, b). Structural equation modeling comprised of measurement model assessment and structural model assessment. The study used SMARTPLS 3.2.9 software to run the data collected through a survey questionnaire. The measurement items for PE, EE, and FC are adapted from Rahim et al. (2022), SI is adapted from Al-Nawaseh (2020), and Chan et al. (2022), PS measurement items are adapted from Lim et al. (2018), PI items are adapted from Hu et al. (2019) and Setiawan et al. (2021), T items are adapted from Al-Nawaseh (2020) and Hu et al. (2019), BI is adapted from Hu et al. (2019), and AU is adapted from Gupta and Arora (2020). The measurement indicators are available in the Appendix section of the study,
Data analysis and findings
Respondents profile
The study’s respondents are Bangladeshi insurance companies’ current clients. The respondents’ demographic information is taken from the Google Form and saved in an Excel file to assess the demographic profile. Table 1 provides the study’s respondent profile.
Table 1 indicates that around 94.10 percent of insurance company clients (respondents) know the fintech services facility that insurance companies provide to manage insurance policy maintenance. 61.40% of the responders were men, and 38.60% were women. About 69.80% of the respondents fall into the 26–45 age range, followed by the 46–55 age range (15.40%) and the 18–25 age range (11.80%). Additionally, married respondents make up most of the respondents (64.20%), followed by single respondents (27.90%) regarding marital status. Most respondents (74.40%) hold a job and are employed, while only 9.50% are unemployed and 8.90% are self-employed. Furthermore, over 80% of responders have earned a degree, and over 35% have post-graduate degrees. About 58.30% of the respondents’ income level is less than Tk. 50,000 followed by income level between Tk.50,000 and Tk. 99,999 (35.3%).
Common method bias
The research employed dual approaches to mitigate potential common method bias during the validation process using partial least squares structural equation modeling (PLS-SEM). According to Podsakoff et al. (2003), the study implemented a test to assess if the variance in all variables measured in the path analysis could be attributed to a single factor, utilizing principal component analysis. This was executed through Harman’s single-factor test, analyzing 33 variables. The results indicated that a single factor explained 41.146% of the variance, remaining below the 50% threshold. Moreover, the research also checked for multicollinearity among latent variables as suggested by Kock (2015). The findings demonstrated that the variance inflation factor (VIF) values were within acceptable limits, ranging from a low of 1.930 to a high of 3.082, well under the critical threshold of 3.3.
Measurement model assessment
The measurement model aids in determining how the constructs and indicator variables interact. Before moving on to the structural model analysis in the PLS-SEM, the measurement model must first be tested (Purwanto and Sudargini 2021). Internal consistency reliability, factor loadings, convergent validity, and discriminant validity are examined as part of the measurement model assessment to see whether the data gathered from the respondents have satisfied the minimal threshold values established by the researchers to evaluate the path model. The PLS algorithm was utilized to analyze the data in SmartPLS 3.2.9 to evaluate the measurement model. The PLS algorithm procedure’s factor loadings, reliability, convergent validity, discriminant validity, multicollinearity, and model fit findings are covered in the subsections below.
Internal consistency reliability
Cronbach’s alpha and composite reliability are used to evaluate a model’s internal consistency reliability. Hair et al. (2019) state that 0.70 and higher is the minimal cutoff value. The values of Cronbach’s alpha and composite reliability are displayed in Table 2. The findings demonstrate that the indicators are internally consistent, the values have satisfied the minimum standards, and no indicator items need to be removed.
Outer loadings and convergent validity
According to Hair et al. (2019), the minimum score of the factors should be 0.708 and above. Table 3 shows the factor loadings of the indicator items. The results showed that all the items met the minimum score. So, no need to exclude any indicator from the analysis.
Convergent validity is assessed to verify the degree to which the construct converges to describe the variation in its elements (Hair et al. 2019). The convergent validity is checked using average variance extended (AVE). The value for AVE should be more than 0.5 to ensure the convergent validity of each indicator variable. Table 4 shows the values of AVE of each indicator variable. All the values exceed the required score.
Discriminant validity
An unobservable variable’s discriminant validity describes how different it is from other latent variables. This means that a latent variable’s uniqueness is distinct from the other constructs in the model. The Fornell–Larcker criterion and cross-loadings are used to assess discriminant validity. However, the Fornell–Larcker and cross-loadings do not provide reliable estimates of the absence of discriminant validity, so the HTMT (Heterotrait–Monotrait) is employed as the foundation of a statistical discriminant validity test. The Heterotrait–Monotrait (HTMT) ratio of correlations was proposed by Henseler et al. (2015) as an alternative method to assess discriminant validity. A high HTMT number indicates that discriminant validity is challenging. The threshold value is 0.90 in structural models with conceptually related structures but 0.85 in those with conceptually different constructs (Henseler et al. 2015). Table 5 shows that all the values have met the minimum score, demonstrating that the constructs are unrelated.
Multicollinearity
When there is a strong correlation between two independent variables, it is known as collinearity (Sarstedt and Mooi, 2019). To evaluate the collinearity between the indicators of the latent variables, the variance inflation factor (VIF) is used. VIF readings should be less than 5 and ideally less than 3, according to Hair et al. (2019). All of the constructs’ VIF values are displayed in Table 6. Since none of the construct values are more than 3, there are no collinearity problems.
Structural model assessment
Once it has been determined that the measurement model assessment is adequate for assessing the PLS-SEM results, the structural model is evaluated. Criteria for standard assessment that ought to be taken into account encompass for structural model assessment are the coefficient of determination (R2), the Q2 measure of cross-validated redundancy based on blindfolding, and the statistical significance and relevance of path coefficients.. The outcomes of the assessment instruments will be covered in the following subsections.
Coefficient of determination (R.2 )
The coefficient of determination, or R2 value, of a structural model, reflects the proportion of the variation in the endogenous constructs that all corresponding exogenous constructs can explain (Hair et al. 2017). The result of the R2 value is given in Table 7.
Table 7 indicates that the R2 value of BI is 0.646, which means PE, EE, FC, SI, PS, and PI explain 64.6% variability of BI. However, 33.4% of the variance of BI cannot be explained with currently studied model factors. In addition, BI and FC can explain only 27.1% of AU. Moreover, after the moderating effect of trust, the R2 value of AU increased to 28.9%. Predictive methods employ cross-validated redundancy, which involves omitting portions of data matrices, estimating model parameters, and predicting the excluded data using these estimations. According to Hair et al. (2017), this methodology allows for an evaluation of the precision of the indicators within the models. For structural models, the cross-validated redundancy Q2 must be greater than 0 and be predictive (Chin 2010). Table 7 shows that the Q2 values are more than 0.
Path coefficient assessment of direct relationships
The proposed association between two constructs is the direct effect, which most likely corresponds to the typical scenario for hypothesis testing in a PLS-SEM application (Streukens & Leroi-Werelds 2016). The study’s hypotheses were tested using the PLS-SEM method, which produced reports containing the path coefficients for each independent variable. To produce the direct path coefficient results, a bootstrapping approach was used. Instead of using parametric assumptions to measure the precision of the estimates, the non-parametric resampling technique known as “bootstrapping” examines a statistic’s variability by examining the variability of the sample data (Streukens & Leroi-Werelds 2016). As a result, the bootstrapping method was used in this study to obtain the path coefficient values. The bootstrapping process was carried out using 5000 samples, as suggested by other researchers (Hair et al. 2019). Path coefficients, t-values, and p-values for each path relationship are used to assess the proposed direct effect hypotheses. The validity of each hypothesis is then assessed using a significance test based on the significance of the path coefficients. The outcomes of direct path coefficients are displayed in Table 8.
Table 8 demonstrates the results of the direct path coefficients. The table contains the direct effects’ mean, standard deviation, T statistics, and P-values. A p-value calculates the likelihood of getting the observed outcomes, presuming that the null hypothesis is correct. The statistical significance of the difference that was found increases with decreasing p-value. Statistical significance is commonly defined as a p-value of 0.05 or less (Beers 2022, December 11). As per Table 8, H2, H3, H5, H6, H7, and H8 are accepted because the p-value is less than 0.05. However, H1 and H3 are rejected because the p-value exceeds 0.05.
Moderation path coefficient assessment
A moderator variable modifies the relationship between an independent or predictor variable and a dependent or criterion variable by changing the correlation’s direction and/or strength (King 2013). It may be qualitative or quantitative. To prove a variable is a moderating variable in research, there must be a significant statistical interaction between the predictor and the moderator (i.e., p.05). In SmartPLS 3.2.9, three methods exist for carrying out a moderating assessment. They are orthogonalization, two-stage, and product indicator. According to Henseler and Chin (2010), the two-stage technique is better for determining if the moderator significantly affects the relationship. Due to its superior statistical power, the two-stage procedure generally applies regardless of how the independent and/or moderating factors are measured (Ramayah et al. 2018). Therefore, the study performed the moderation analysis using a two-stage approach. The research put forth T as a moderating factor between BI and AU. The moderating effects of Trust’s route coefficient are shown in Table 9 and Fig. 2.

Moderation result from SmartPLS
According to hypothesis 9, the association between BI and AU of those services is moderated by trust (T). Moderating effect path coefficient data are shown in Table 9, with a T-statistic value of 2.108 and a p-value of 0.036. The favorable effect of trust on the link between BI and AU is statistically significant because the p-value is smaller than 0.05. As a result, hypothesis 9 is valid. When the moderator trust was added, the R2 value of AU went from 27.1 to 28.9%. After determining the significance of the moderation effect, a second assessment is typically carried out to further understand the moderating impact. Preacher et al. (2007) claim that it is standard procedure to dissect or “probe” this conditional influence when a significant interaction is found to understand the relationship’s structure. Using the Excel document created by Dawson (2014), Fig. 3 demonstrates the straightforward slope analysis of the moderating impact.
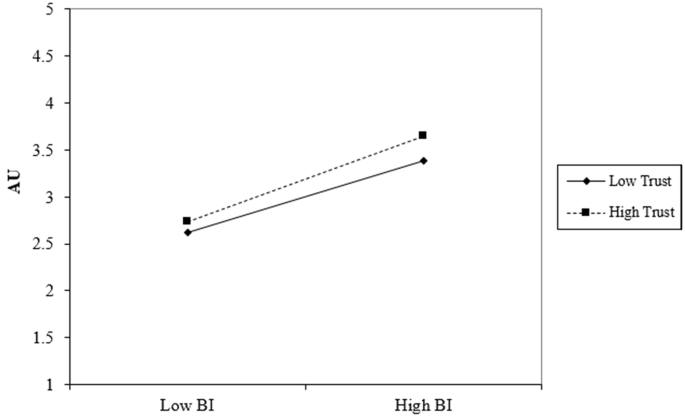
Interaction effect of trust between BI and AU
The interaction impact of T between BI and AU is seen in Fig. 3. The chart shows that high trust strengthens the positive link between BI and AU. The bond between BI and AU deteriorates if the impact of T is low. The association between BI and AU will be larger if insurance industry clients have a high level of trust in fintech services, which means more customers will utilize fintech services for insurance-related transactions and maintenance.
Discussion
The study aimed to identify the factors impacting the acceptance of fintech services by Bangladeshi insurance industry clients. The study used the PLS-SEM technique to confirm the connections of PE, EE, FC, SI, PS, and PI on BI, BI, and FC on AU. Additionally, the moderating impact of trust between BI and AU was examined.
The hypothesis findings in Table 8 indicate that BI to utilize fintech services is highly influenced by EE (β = 0.133; t-value = 2.069; p-value = 0.039). Similar results can be found in previous studies on adopting fintech (mobile banking, m-banking, m-commerce) where EE positively impacted BI (Ahmad et al. 2021; Ivanova & Kim 2022). One reason may be the user-friendliness of the fintech platforms. When adults find technology easy to use, they tend to intend to use it.
In addition, Fig. 2 exhibits FC (β = 0.195; t-value = 3.608; p-value = 0.000) showed a significant positive impact on BI. This result is also found in earlier studies (Chawla & Joshi 2019; Khan et al. 2017). The reason is that insurance customers show interest in facilities like 24-h call center service, offline usage of the fintech platform, payment notification through SMS and email, and customer service support for any error transactions provided by insurance companies. In addition, most of the respondents are well educated, so they are ready to verify the available resources before adopting fintech services.
Table 8 shows that SI (β = 0.100; t-value = 2.263; p-value = 0.024) also showed a significant positive impact on BI. Earlier studies also found the same result (Al Nawayseh 2020; Bin-Nashwan 2022). The main reason is that the society in Bangladesh is hierarchical in nature. The family members are respected based on their positions and age. One’s position in the hierarchy greatly influences one’s education, experience, and seniority. The head of the people or those with a good position in society or job life are expected to make important decisions. In making any decisions, people sought to ask their family members for guidance. Their opinions highly motivate people to use products or services.
Moreover, results from Table 8 indicate that PS (β = 0.301; t-value = 5.044; p-value = 0.000) also showed a significant positive impact on BI. Earlier studies found similar results (Ibrahim et al. 2022; Jusoh and Jing 2019). One of the primary reasons that customers are concerned about security is the risk that may appear while performing any transaction on electronic or fintech platforms. In addition, PI (β = 0.192; t-value = 4.094; p-value = 0.039) showed a significant positive impact on BI. Earlier studies found similar results (Khan et al. 2022; Makki et al. 2016). One of the reasons behind this result is that most of the study’s respondents are between 20 and 40, so they are more exposed to new technologies in their daily activities. So, they are more interested in intending to accept fintech services for insurance-related transactions. Additionally, there is a significant increase in the use of the Internet and smartphones.
According to Table 8, BI (β = 0.415; t-value = 6.616; p-value = 0.000) significantly positively impacted AU. When a customer intends to adopt fintech services with a persuaded mindset and a positive attitude, these favorable mental states (moods) may induce fidelity and actual behaviors. Similar results were found in prior studies where BI positively impacted AU (Arias-Oliva et al. 2019; Farzin et al. 2021).
Table 9 and Fig. 3 indicate that T (β = 0.052; t-value = 2.108; p-value = 0.036) moderates the relationship between BI and AU. Because customers feel that fintech services are trustworthy because every transaction is stored on the fintech platform and can be recalled when necessary. So, T in the fintech services strengthens the relationship positively between the customers’ intention to use and actual usage of fintech services. Results, however, demonstrated that performance expectancy did not affect BI while FC did not influence AU.
Conclusion
The fourth industrial revolution’s digital era has enabled people access to various opportunities. Fintech platforms are being used by financial organizations like banks, insurance companies, asset management businesses, and investment companies to improve system efficiency for business and their clients. Globally, insurance companies have adapted Insurtech and fintech platforms for their operations. But in a developing nation like Bangladesh, where the country came in at 78th in the fintech adoption index, the use of fintech in insurance firms is still in its infancy. The study aimed to determine the acceptance of fintech services by Bangladeshi customers of life and general insurance companies. The study utilized a modified UTAUT2 model by integrating variables performance expectancy, effort expectancy, social influence and facilitating conditions from UTAUT2, perceived security from the TAM model, personal innovativeness from DOI, and trust from EVF. Data were collected using Google Forms administered by the research assistants from the insurance industry customers. Finally, a sample of 391 was analyzed using the structural equation modeling in SMART PLS 3.2.9 software. The result findings revealed that EE, FC, SI, PS, and PI have a significant positive effect on insurance companies’ customers’ BI. According to the results, perceived security has the highest effect on BI, followed by PI, FC, EE, and SI. BI showed a significant positive influence on AU. In addition, T showed a positive moderating role between BI and AU. However, the result showed that PE does not affect BI, and FC has little effect on AU. The study’s findings will support decisions made by the insurance regulators, such as requiring fintech platforms for customers from insurers and relaxing the current restriction on life insurance sales through insurance agencies only to allow life insurance companies to sell directly to customers. With these techniques, insurance companies can handle consumer insurance policy purchases, premium payments, and claim payouts more efficiently.
Theoretical contribution
The study contributed to the fintech acceptance literature using the modified UTAUT2 model. The study model has included new dimensions like PI and PS and eliminated three variables from the UTAUT2 original model for the analysis. These dimensions were missing in the original theory. One of the most significant theoretical contributions of the study is the use of trust as a moderating variable between BI and AU. In addition, this study found that trust plays a positive moderating effect between BI and AU. The findings of the study provide new insight into fintech services adoption in the context of the Bangladesh insurance industry. These findings also contributed to the literature on Bangladeshi end-users’ fintech adoption behavior. The findings will be helpful for academicians and researchers for further investigating the fintech adoption behavior among developing countries.
Practical implications
The study’s findings will assist the insurance company management in increasing the use of fintech services for insurance-related activities. From the findings, management of insurance companies can take necessary steps to increase the usage of fintech services for existing and potential customers. By using fintech services, customers can save time and money. Most importantly, the transaction and commission costs will be lower if customers use fintech services. It will eventually reduce the business’s operating and administrative expenses.
The study’s findings will also help the regulators of the Bangladesh insurance industry. Mistrust in insurance companies, especially for the agents’ unethical activities, is common in the Bangladesh insurance industry. It is a critical factor that hinders the growth of the insurance industry. This study’s findings will help the insurance regulator (IDRA) to put new rules regulating the sales channel of insurance companies into effect. IDRA should ensure and govern that all the insurance companies have a dedicated fintech channel for insurance-related activities, which is trustworthy. As a result, customers can acquire and manage their insurance policies through applications or websites of insurance.
Limitations and future research directions
Every study has its limitations. In this study, the survey responses were exclusively gathered from customers of the top 10 life insurance and general insurance companies from Dhaka, Chattogram, and Sylhet regions. This constraint may affect the ability to apply the findings more broadly across various regions in Bangladesh. To enhance the scope and robustness of future research, it would be beneficial to include participants from other areas. Improving gender balance in survey participation can also contribute to more comprehensive results. Furthermore, while this study focused on trust as a moderating factor between BI and actual usage, subsequent studies could consider incorporating perceived risk as another potential moderator.
References
Agarwal, R., and J. Prasad. 1998. A conceptual and operational definition of personal innovativeness in the domain of information technology. Information Systems Research 9 (2): 204–215. https://doi.org/10.1287/isre.9.2.204.
Ahmad, S., S. Tajul Urus, and S.N.F. Syed Mustapha Nazri. 2021. Technology acceptance of financial technology (fintech) for payment services among employed fresh graduates. Asia-Pacific Management Accounting Journal 16 (2): 27–58.
Al Nawayseh, M.K. 2020. Fintech in COVID-19 and beyond: What factors are affecting customers’ choice of fintech applications? Journal of Open Innovation: Technology, Market, and Complexity 6 (4): 153. https://doi.org/10.3390/joitmc6040153.
Ali, M. 2020. Challenges, prospects and role of insurance on economic growth in Bangladesh. IIUM Journal of Case Studies in Management 11 (1): 20–27.
Ali, M., S.A. Raza, B. Khamis, C.H. Puah, and H. Amin. 2021. How perceived risk, benefit, and trust determine user Fintech adoption: A new dimension for Islamic finance. Foresight 23 (4): 403–420. https://doi.org/10.1108/FS-09-2020-0095.
Al-Okaily, M. 2023. The influence of e-satisfaction on users' e-loyalty toward e-wallet payment apps: a mediated-moderated model. International Journal of Emerging Markets, (in press).
Aloulou, M., R. Grati, A.A. Al-Qudah, and M. Al-Okaily. 2023. Does FinTech adoption increase the diffusion rate of digital financial inclusion? A Study of the Banking Industry Sector. Journal of Financial Reporting and Accounting (in Press). https://doi.org/10.1108/JFRA-05-2023-0224.
Alsaad, A., R. Mohamad, and N.A. Ismail. 2017. The moderating role of trust in business-to-business electronic commerce (B2B EC) adoption. Computers in Human Behavior 68: 157–169. https://doi.org/10.1016/j.chb.2016.11.040.
Al-Sajjan, B., and C. Dennis. 2010. Internet banking acceptance model: Cross-market examination. Journal of Business Research 63 (9/10): 957–963.
Alwi, S. 2021. Fintech as financial inclusion: Factors affecting BI to accept mobile e-wallet during Covid-19 outbreak. Turkish Journal of Computer and Mathematics Education 12 (7): 2130–2141. https://doi.org/10.17762/turcomat.v12i7.3356.
Andrews, J.E., H. Ward, and J. Yoon. 2021. UTAUT as a model for understanding intention to adopt AI and related technologies among librarians. The Journal of Academic Librarianship 47 (6): 102437. https://doi.org/10.1016/j.acalib.2021.102437.
Anshari, M., M.A. Arine, N. Nurhidayah, H. Aziyah, and M.H.A. Salleh. 2021. Factors influencing individual in adopting eWallet. Journal of Financial Services Marketing 26: 10–23.
Arias-Oliva, M., J. Pelegrín-Borondo, and G. Matías-Clavero. 2019. Variables influencing cryptocurrency use: A technology acceptance model in Spain. Frontiers in Psychology 10: 475.
Arkorful, V.E., B.K. Lugu, A. Hammond, I. Basiru, F.A. Afriyie, and B. Mahajan. 2021. Examining quality, value, satisfaction and trust dimensions: An empirical lens to understand health insurance systems actual usage. Public Organization Review 21 (3): 471–489. https://doi.org/10.1007/s11115-020-00498-x.
Arner, D.W., J. Barberis, and R.P. Buckley. 2015. The evolution of Fintech: A new post-crisis paradigm. Georgetown Journal of International Law. 47: 1271.
Ayoconnect. 2022. How Fintech Revolution Can Help Insurance Industry. Retrieved from: https://www.ayoconnect.com/blog/how-fintech-revolution-can-help-insurance-industry (accessed on: 24 Nov 2023)
Azman, N.H.N., and M.Z.M. Zabri. 2022. Sharīʿah-compliant fintech usage among microentrepreneurs in Malaysia: An extension of UTAUT model. Journal of Islamic Monetary Economics and Finance 8 (2): 305–324. https://doi.org/10.21098/jimf.v8i2.1417.
Beers, B. 2022, December 11. P-Value: What It Is, How to Calculate It, and Why It Matters. Investopedia. Retrieved from: https://www.investopedia.com/terms/p/pvalue.asp#:~:text=A%20p%2Dvalue%20measures%20the,is%20generally%20considered%20statistically%20significant
Bin-Nashwan, S.A. 2022. Toward diffusion of e-Zakat initiatives amid the COVID-19 crisis and beyond. Foresight 24 (2): 141–158. https://doi.org/10.1108/FS-08-2020-0082.
Cao, Q., and X. Niu. 2019. Integrating context awareness and UTAUT to explain Alipay user adoption. International Journal of Industrial Ergonomics 69: 9–13. https://doi.org/10.1016/j.ergon.2018.09.004.
Castelfranchi, C. and Falcone, R. 2000. Trust is much more than subjective probability: mental components and sources of trust. In Proceedings of the 33rd Annual Hawaii International Conference on System Sciences, IEEE, January, pp 10.
Chan, R., I. Troshani, S. Rao Hill, and A. Hoffmann. 2022. Towards an understanding of consumers’ FinTech adoption: The case of Open Banking. International Journal of Bank Marketing 40 (4): 886–917. https://doi.org/10.1108/IJBM-08-2021-0397.
Chawla, D., and H. Joshi. 2019. Consumer attitude and intention to adopt mobile wallet in India—An empirical study. International Journal of Bank Marketing 37 (7): 1590–1618. https://doi.org/10.1108/IJBM-09-2018-0256.
Chen, L., M.S. Rashidin, F. Song, Y. Wang, S. Javed, and J. Wang. 2021. Determinants of consumer’s purchase intention on fresh e-commerce platform: Perspective of UTAUT model. SAGE Open 11 (2): 1–17. https://doi.org/10.1177/21582440211027875.
Chin, W.W. 2010. How to write up and report PLS analyses. In Handbook of partial least squares, 655–690. Berlin: Springer.
Choi, S. 2016. The flipside of ubiquitous connectivity enabled by smartphone-based social networking service: Social presence and privacy concern. Computers in Human Behavior 65: 325–333. https://doi.org/10.1016/j.chb.2016.08.039.
Das, C. S. 2021. Digitalization in the BD insurance industry. The Financial Express. Retrieved from: https://thefinancialexpress.com.bd/views/digitalisation-in-bd-insurance-industry-1614953370 (accessed on: 4 Apr 2023)
Dawson, J.F. 2014. Moderation in management research: what, why, when, and how. Journal of Business and Psychology 29 (1): 1–19.
Dowdy, A. E. A. 2020. Public Librarians’ Adoption of Technology in Two Southeastern States (Doctoral dissertation, Walden University).
EY Global Financial Services. 2019. Global FinTech Adoption Index 2019. https://assets.ey.com/content/dam/ey-sites/ey-com/en_gl/topics/banking-and-capital-markets/ey-global-fintech-adoption-index.pdf
Farzin, M., M. Sadeghi, F. Yahyayi Kharkeshi, H. Ruholahpur, and M. Fattahi. 2021. Extending UTAUT2 in M-banking adoption and actual use behavior: Does WOM communication matter? Asian Journal of Economics and Banking 5 (2): 136–157.
Ferdaous, D.J., and M.N. Rahman. 2021. Banking goes digital: Unearthing the adoption of fintech by Bangladeshi households. Journal of International Business Studies 1: 7–42.
Findexable. 2021. Global fintech ranking report 2021. Retrieved From: https://findexable.com/wp-content/uploads/2021/06/Global-Fintech-Rankings-2021-v1-23-June-21.pdf (accessed on: 4 Apr 2023)
Flavián, C., and M. Guinalíu. 2006. Consumer trust, perceived security, and privacy policy: Three basic elements of loyalty to a web site. Industrial Management & Data Systems 106 (5): 601–620. https://doi.org/10.1108/02635570610666403.
Frazier, P.A., A.P. Tix, and K.E. Barron. 2004. Testing moderator and mediator effects in counseling psychology research. Journal of Counseling Psychology 51 (1): 115–134.
Gai, K., M. Qiu, and X. Sun. 2018. A survey on FinTech. Journal of Network and Computer Applications 103: 262–273. https://doi.org/10.1016/j.jnca.2017.10.011.
Gefen, D. 2004. What makes an ERP implementation relationship worthwhile: Linking trust mechanisms and ERP usefulness. Journal of Management Information Systems 21 (1): 263–288.
Global Insurance Report. 2022. Creating value, finding focus: Global Insurance Report 2022. McKinsey & Company. Retrieved from: https://www.mckinsey.com/industries/financial-services/our-insights/creating-value-finding-focus-global-insurance-report-2022
Gupta, K., and N. Arora. 2020. Investigating consumer intention to accept mobile payment systems through the unified theory of acceptance model: An Indian perspective. South Asian Journal of Business Studies 9 (1): 88–114. https://doi.org/10.1108/SAJBS-03-2019-0037.
Gupta, K., A. Wajid, and D. Gaur. 2023. Determinants of continuous intention to use FinTech services: The moderating role of COVID-19. Journal of Financial Services Marketing 28: 1–17.
Hair, J.F., G.T.M. Hultupta, C.M. Ringle, M. Sarstedt, and K.O. Thiele. 2017. Mirror on the Wall: A Comparative Evaluation of Composite-based Structural Equation Modeling Methods. Journal of the Academy of Marketing Science 45 (5): 616–632. https://doi.org/10.1007/s11747-017-0517-x.
Hair, J.F., J.J. Risher, M. Sarstedt, and C.M. Ringle. 2019. When to use and how to report the results of PLS-SEM. European Business Review 31 (1): 2–24. https://doi.org/10.1108/EBR-11-2018-0203.
Hasan, F., M. Al-Okaily, T. Choudhury, and U. Kayani. 2023. A comparative analysis between FinTech and traditional stock markets: Using Russia and Ukraine war data. Electronic Commerce Research. https://doi.org/10.1007/s10660-023-09734-0.
Hassan, M.S., M.A. Islam, F.A. Sobhani, H. Nasir, I. Mahmud, and F.T. Zahra. 2022a. Drivers Influencing the adoption intention towards mobile fintech services: A Study on the emerging bangladesh market. Information 13 (7): 349. https://doi.org/10.3390/info13070349.
Hassan, M.S., M.A. Islam, F.A. Sobhani, M.M. Hassan, and M.A. Hassan. 2022b. Patients’ intention to adopt fintech services: A study on Bangladesh healthcare sector. International Journal of Environmental Research and Public Health 19 (22): 15302. https://doi.org/10.3390/ijerph192215302.
Hassan, M.S., M.A. Islam, M.F. Yusof, and H. Nasir. 2023. Users’ fintech services acceptance: A cross-sectional study on Malaysian Insurance & takaful industry. Heliyon. https://doi.org/10.1016/j.heliyon.2023.e21130.
Henseler, J., and W.W. Chin. 2010. A comparison of approaches for the analysis of interaction effects between latent variables using partial least squares path modeling. Structural Equation Modeling 17 (1): 82–109.
Henseler, J., C.M. Ringle, and M. Sarstedt. 2015. A new criterion for assessing discriminant validity in variance-based structural equation modeling. Journal of the Academy of Marketing Science 43 (1): 115–135. https://doi.org/10.1007/s11747-014-0403-8.
Hu, Z., S. Ding, S. Li, L. Chen, and S. Yang. 2019. Adoption intention of fintech services for bank users: An empirical examination with an extended technology acceptance model. Symmetry 11 (3): 340. https://doi.org/10.3390/sym11030340.
Humphries, A.S., and R.D. Wilding. 2004. Long-term collaborative business relationships: The impact of trust and C3 behavior. Journal of Marketing Management 20 (9/10): 1107–1122.
Ibrahim, M., R.E. Hinson, and A. Stephen. 2022. Exploring consumers’ intention to adopt mobile payment systems in Ghana. International Journal of E-Services and Mobile Applications 14 (1): 1–16. https://doi.org/10.4018/IJESMA.285547.
IOM. 2002. Speaking of health: Assessing health communication strategies for diverse populations. Washington: The National Academies Press. https://doi.org/10.17226/10018.
Irawan, D., and M.W. Affan. 2020. Pengaruh privasi dan keamanan terhadap niat menggunakan payment fintech. Jurnal Kajian Akuntansi 4 (1): 52–62. https://doi.org/10.33603/jka.v4i1.3322.
Ivanova, A., and J.Y. Kim. 2022. Acceptance and use of mobile banking in central Asia: Evidence from modified UTAUT model. The Journal of Asian Finance, Economics and Business 9 (2): 217–227. https://doi.org/10.13106/jafeb.2022.vol9.no2.0217.
Jusoh, Z.M., and T.Y. Jing. 2019. Perceived security, subjective norm, self-efficacy, intention, and actual usage towards e-payment among UPM students. Journal of Education and Social Sciences 12 (2): 8–22.
Khan, I.U. 2022. How does culture influence digital banking? A comparative study based on the unified model. Technology in Society 68: 101822. https://doi.org/10.1016/j.techsoc.2021.101822.
Khan, M.S.U., and M.N. Uddin. 2020. Insurance industry in Bangladesh: Opportunities and challenges. Thoughts on Economics 23 (4): 55–78.
Khan, I.U., Z. Hameed, and S.U. Khan. 2017. Understanding online banking adoption in a developing country: UTAUT2 with cultural moderators. Journal of Global Information Management 25 (1): 43–65. https://doi.org/10.4018/JGIM.2017010103.
Khan, M.S., M.R. Rabbani, I.T. Hawaldar, and A. Bashar. 2022. Determinants of bis to use islamic financial technology: An empirical assessment. Risks 10 (6): 114. https://doi.org/10.3390/risks10060114.
Khatun, N., and M. Tamanna. 2020. Factors affecting the adoption of fintech: A study based on the financial institutions in Bangladesh. Copernican Journal of Finance & Accounting 9 (4): 51–75. https://doi.org/10.12775/CJFA.2020.021.
Khazaei, H. 2020. Integrating cognitive antecedents to the UTAUT model to explain the adoption of blockchain technology among Malaysian SMEs. JOIV: International Journal on Informatics Visualization 4 (2): 85–90. https://doi.org/10.30630/joiv.4.2.362.
King, P.S. 2013. Moderators/moderating factors. In Encyclopedia of behavioral medicine, ed. M.D. Gellman and J.R. Turner. New York: Springer. https://doi.org/10.1007/978-1-4419-1005-9_971.
Kock, N. 2015. Common method bias in PLS-SEM: A full collinearity assessment approach. International Journal of e-Collaboration 11 (4): 1–10.
Lee, I., and Y.J. Shin. 2018. Fintech: Ecosystem, business models, investment decisions, and challenges. Business Horizons 61 (1): 35–46.
Leong, C., B. Tan, X. Xiao, F.T.C. Tan, and Y. Sun. 2017. Nurturing a FinTech ecosystem: The case of a youth microloan startup in China. International Journal of Information Management 37 (2): 92–97. https://doi.org/10.1016/j.ijinfomgt.2016.11.006.
Lim, S.H., D.J. Kim, Y. Hur, and K. Park. 2018. An empirical study of the impacts of perceived security and knowledge on continuous intention to use mobile fintech payment services. International Journal of Human-Computer Interaction 35 (10): 886–898.
Makki, A.M., A.B. Ozturk, and D. Singh. 2016. Role of risk, self-efficacy, and innovativeness on BIs for mobile payment systems in the restaurant industry. Journal of Foodservice Business Research 19 (5): 454–473. https://doi.org/10.1080/15378020.2016.1188646.
Mamun, D.M.Z. 2016. Problems and prospects of insurance business in Bangladesh from the companies’ perspective. Journal of Bangladesh Insurance Academy 62: 5–48.
Mansyur, A., and E.M.T. Ali. 2022. The adoption of sharia fintech among millenial in indonesia: Moderating effect of islamic financial literacy on UTAUT 2. International Journal of Academic Research in Business and Social Sciences 12 (4): 1329–1343.
Manyika, J., Lund, S., Singer, M., White, O. and Berry, C. 2016. Digital finance for all: Powering inclusive growth in emerging economies. McKinsey Report. Retrieved from: https://www.mckinsey.com/∼/media/mckinsey/featured%20insights/Employment%20and%20Growth/How %20digital%20finance%20could%20boost%20growth%20in%20emerging%20economies/ MGI-Digital-Finance-For-All-Executive-summary-September-2016.ashx
Marzuki, M., and N. Nurdin. 2020. The influence of halal product expectation, social environment, and fiqh knowledge on intention to use shariah financial technology products. International Journal of Innovation, Creativity, and Change 13 (1): 171–193.
Mckinsey. 2023. Global Insurance Report 2023. Retrieved from: https://www.mckinsey.com/industries/financial-services/our-insights/global-insurance-report-2023-reimagining-life-insurance (accessed on: 24 Nov 2023)
Memon, M.A., J.H. Cheah, T. Ramayah, H. Ting, F. Chuah, and T.H. Cham. 2019. Moderation analysis: Issues and guidelines. Journal of Applied Structural Equation Modeling 3 (1): 1–11.
Mensah, I.K. 2019. Factors influencing the intention of university students to adopt and use e-government services: An empirical evidence in China. SAGE Open. https://doi.org/10.1177/2158244019855823.
Miraz, M.H., M.T. Hasan, M.S. Rekabder, and R. Akhter. 2022. Trust, transaction transparency, volatility, facilitating condition, performance expectancy towards cryptocurrency adoption through intention to use. Journal of Management Information and Decision Sciences 25: 1–20.
Moon, S.G., S.Y. Jeong, and Y. Choi. 2017. Moderating effects of trust on environmentally significant behavior in Korea. Sustainability 9 (3): 415–433. https://doi.org/10.3390/su9030415.
Najib, M., W.J. Ermawati, F. Fahma, E. Endri, and D. Suhartanto. 2021. FinTech in the small food business and its relation with open innovation. Journal of Open Innovation: Technology, Market, and Complexity 7 (1): 88–104. https://doi.org/10.3390/joitmc7010088.
Nathan, R.J., B. Setiawan, and M.N. Quynh. 2022. Fintech and financial health in Vietnam during the COVID-19 pandemic: In-depth descriptive analysis. Journal of Risk and Financial Management 15 (3): 125. https://doi.org/10.3390/jrfm15030125.
Owusu Kwateng, K., K.A. Osei Atiemo, and C. Appiah. 2019. Acceptance and use of mobile banking: An application of UTAUT2. Journal of Enterprise Information Management 32 (1): 118–151. https://doi.org/10.1108/JEIM-03-2018-0055.
Permatasari, M. I., and Kartawinata, B. R. 2021. The effect of perceived ease, benefit, and security on interest in using ovo fintech application in Indonesia. In Proceedings of the International Conference on Industrial Engineering and Operations Management, August 16–18, Bangalore, India, pp. 878–885.
Podsakoff, P.M., S.B. MacKenzie, J.Y. Lee, and N.P. Podsakoff. 2003. Common method biases in behavioral research: A critical review of the literature and recommended remedies. Journal of Applied Psychology 88 (5): 879.
Preacher, K.J., D.D. Rucker, and A.F. Hayes. 2007. Addressing moderated mediation hypotheses: Theory, methods, and prescriptions. Multivariate Behavioral Research 42 (1): 185–227.
Purwanto, A., and Y. Sudargini. 2021. Partial least squares structural equation modeling (PLS-SEM) analysis for social and management research: A literature review. Journal of Industrial Engineering & Management Research 2 (4): 114–123. https://doi.org/10.7777/jiemar.v2i4.168.
Rabaa’i, A.A. 2023. An investigation into the acceptance of mobile wallets in the FinTech era: An empirical study from Kuwait. International Journal of Business Information Systems 44 (4): 536–580.
Rahardjo, B., B.M.B. Akbar, and I. Novitaningtyas. 2020. The analysis of intention and use of financial technology. Journal of Accounting and Strategic Finance 3 (1): 88–102. https://doi.org/10.33005/jasf.v3i1.70.
Rahim, N.F., M.H. Bakri, B.A. Fianto, N. Zainal, and S.A. Hussein Al Shami. 2022. Measurement and structural modelling on factors of Islamic Fintech adoption among millennials in Malaysia. Journal of Islamic Marketing. https://doi.org/10.1108/JIMA-09-2020-0279
Ramayah, T., J. Cheah, F. Chuah, H. Ting, and M.A. Memon. 2018. Partial least squares structural equation modeling (PLS-SEM) using SmartPLS 3.0: An updated guide and practical guide to statistical analysis, 2nd ed. Kuala Lumpur: Pearson.
Ramos, F. A. B. 2017. Accessing the determinants of BI to adopt fintech services among the millennial generation (Doctoral dissertation at Universidade NOVA).
Regina, T., Kurniasari, F., and Utomo, P. 2021. Utaut Approach Application to analyze the determinants of fintech market aggregator user satisfaction. In ICEBE 2020: In Proceedings of the First International Conference of Economics, Business & Entrepreneurship, ICEBE 2020, 1st October 2020, Tangerang, Indonesia, p. 454. European Alliance for Innovation.
RBI Report. 2018. FinTech and Digital Banking, 2017 (published in 2018), RBI, available at: www.rbi. org.in
Sarstedt, M., and J.H. Cheah. 2019. Partial least squares structural equation modeling using SmartPLS: A software review. Journal of Marketing Analytics 7: 196–202.
Schueffel, P. 2016. Taming the beast: A scientific definition of fintech. Journal of Innovation Management 4 (4): 32–54.
Sekaran, U., and R. Bougie. 2009. Research method for business, a skill building approach. Singapore: Wiley.
Sekaran, U., and R. Bougie. 2016. Research methods for business: A skill building approach. Hoboken: Wiley.
Setiawan, B., D.P. Nugraha, A. Irawan, R.J. Nathan, and Z. Zoltan. 2021. User innovativeness and fintech adoption in Indonesia. Journal of Open Innovation: Technology, Market, and Complexity 7 (3): 188.
Singh, G., and P.V. Rajeev. 2021. Fintech: An inquisitive disruptive technology for small retailers. Nveo-Natural Volatiles & Essential Oils Journal 8 (5): 9078–9097.
Solarz, M., and J. Adamek. 2022. Wpływ ryzyka pandemii COVID-19 na wykorzystanie usług bankowości mobilnej w Polsce. Przegląd Prawno-Ekonomiczny 1 (4): 79–96.
Streukens, S., and S. Leroi-Werelds. 2016. Bootstrapping and PLS-SEM: A step-by-step guide to get more out of your bootstrap results. European Management Journal 34 (6): 618–632.
Šumak, B., and A. Šorgo. 2016. The acceptance and use of interactive whiteboards among teachers: Differences in UTAUT determinants between pre-and post-adopters. Computers in Human Behavior. 64: 602–620. https://doi.org/10.1016/j.chb.2016.07.037.
Tamilmani, K., Rana, N. P., and Dwivedi, Y. K. 2018. Use of ‘habit’ is not a habit in understanding individual technology adoption: a review of UTAUT2 based empirical studies. In International Working Conference on Transfer and Diffusion of IT, June, pp. 277–294, Springer, Cham.
Taufiq, A.R. 2021. Integrating TAM, VAM, PAM, and security perception in the intention of fintech service usage. Jurnal Manajemen Indonesia 21 (3): 198–207.
Tohang, V., Ramadhan, A. S., and Djajadiningrat, V. 2021. An Empirical Study on Customer Acceptance of FinTech 3.0 in Private Banking. In 2021 International Conference on Information Management and Technology (ICIMTech). Vol. 1, pp. 105–110.
Tun-Pin, C., W.C. Keng-Soon, Y. Yen-San, C. Pui-Yee, J.T. Hong-Leong, and N. Shwu-Shing. 2019. An adoption of fintech service in Malaysia. Southeast Asia Journal of Contemporary Business 18 (5): 134–147.
Venkatesh, V., M.G. Morris, F.D. Davis, and G.B. Davis. 2003. User acceptance of information technology: Toward a unified view. MIS Quarterly 27 (3): 425–478. https://doi.org/10.2307/30036540.
Venkatesh, V., J.Y. Thong, and X. Xu. 2012. Consumer acceptance and use of information technology: Extending the unified theory of acceptance and use of technology. MIS Quarterly 36 (1): 157–178.
Wang, Y.S., H.H. Lin, and P. Luarn. 2006. Predicting consumer intention to use mobile service. Information Systems Journal 16 (2): 157–179.
Weber, R. 2012. Evaluating and developing theories in the information systems discipline. Journal of the Association for Information Systems 13 (1): 1–30.
Wirani, Y., R. Randi, M.S. Romadhon, and S. Suhendi. 2022. The influence of familiarity and personal innovativeness on the acceptance of fintech lending services: A perspective from Indonesian borrowers. Register: Jurnal Ilmiah Teknologi Sistem Informasi 8 (1): 81–93.
Xie, J., L. Ye, W. Huang, and M. Ye. 2021. Understanding FinTech platform adoption: Impacts of perceived value and perceived risk. Journal of Theoretical and Applied Electronic Commerce Research 16 (5): 1893–1911. https://doi.org/10.3390/jtaer16050106.
Yahaya, M.H., and K. Ahmad. 2019. Factors affecting the acceptance of financial technology among a snap for the distribution of zakat in Selangor—A Study Using UTAUT. Journal of Islamic Finance 8: 035–046.
Yohanes, K., Junius, K., Saputra, Y., Sari, R., Lisanti, Y., and Luhukay, D. 2020. Unified theory of acceptance and use of technology (UTAUT) model perspective to enhance user acceptance of fintech application. In 2020 International Conference on Information Management and Technology (ICIMTech), August 13–14, Bandung, Indonesia, pp. 643–648. IEEE.
Funding
Open Access funding enabled and organized by CAUL and its Member Institutions. The research project was funded by the Research Management Center of Universiti Malaysia Perlis, Special Grant Number: 9004-00092.
Author information
Authors and Affiliations
Corresponding author
Ethics declarations
Conflict of interest
On behalf of all authors, the corresponding author states that there is no conflict of interest.
Additional information
Publisher's Note
Springer Nature remains neutral with regard to jurisdictional claims in published maps and institutional affiliations.
Appendix
Appendix
Measurement items | references |
|---|---|
Performance expectancy | |
PE1: Using fintech services helps me to accomplish insurance-related transactions more quickly | Rahim et al. (2022) |
PE2: Using fintech services increases my productivity in insurance policy handling | |
PE3: Using fintech services makes it easier for me to do insurance-related transactions (i.e., premium payment, loan payment, etc.) | |
PE4: Using fintech services improves my overall insurance-related transaction performance | |
Effort expectancy | |
EE1: I find the fintech services platform easy to use | Rahim et al. (2022) |
EE2: My interaction with the fintech services platform is clear and understandable | |
EE3: It is easy for me to become skillful at using the fintech services platform | |
EE4: I find the fintech services platform flexible to interact with | |
EE5: I find it easy to get fintech services platform to do what I want it to do | |
Social influence | |
SI1; People who are important to me expect me to use fintech services to perform insurance-related transactions | |
SI2: Those people that influence my behavior think that I should use fintech services to conduct insurance policy payments | |
SI3: I will use fintech services for insurance premium payments if people in my community widely use the service | |
SI4: I expect using fintech services to be trendy | |
SI5: I think that using fintech services would make me look professional in managing my insurance policy | |
Facilitating conditions | |
FC1: I have the necessary knowledge and capacity to use fintech services | Rahim et al. (2022) |
FC2: Fintech services applications for the insurance-related transaction are compatible with all of my computing devices, mobile, and gadget | |
FC3: I can get help from others when I have difficulties using the fintech services platform | |
Personal innovativeness | |
PI1: If I heard about new fintech services for insurance transactions, I would look for ways to experiment with them | Hu et al. (2019) |
PI2: I like to experiment with new fintech services | |
PI3: In general, I am not hesitant to try out new fintech services | |
Perceived security | |
PS1: The payment transaction process is secure when I use the Fintech services | Lim et al. (2018) |
PS2: When I use the fintech services, the user authentication method is secure | |
PS3: Using the Fintech services platform is secure | |
PS4: There is no communication problem when using the Fintech services | |
Trust | |
T1: I trust fintech services to be reliable | |
T2: I believe fintech services are trustworthy | |
T3: I believe Fintech services keep my personal information safe | |
BI to us | |
BI1: If I have used Fintech services, I am willing to continue using | Gupta and Arora (2020) |
BI2: I would like to use Fintech services soon | |
BI3: I will recommend Fintech services to my friends | |
Actual usage | |
AU1: I sometimes use fintech service to conduct insurance transactions | Gupta and Arora (2020) |
AU2: I regularly use fintech services to conduct insurance transactions | |
AU3: I always use fintech services to conduct insurance transactions | |
Rights and permissions
Open Access This article is licensed under a Creative Commons Attribution 4.0 International License, which permits use, sharing, adaptation, distribution and reproduction in any medium or format, as long as you give appropriate credit to the original author(s) and the source, provide a link to the Creative Commons licence, and indicate if changes were made. The images or other third party material in this article are included in the article's Creative Commons licence, unless indicated otherwise in a credit line to the material. If material is not included in the article's Creative Commons licence and your intended use is not permitted by statutory regulation or exceeds the permitted use, you will need to obtain permission directly from the copyright holder. To view a copy of this licence, visit http://creativecommons.org/licenses/by/4.0/.
About this article

Cite this article
Hassan, M.S., Islam, M.A., Abdullah, A.B.M. et al. End-user perspectives on fintech services adoption in the Bangladesh insurance industry: the moderating role of trust. J Financ Serv Mark (2024). https://doi.org/10.1057/s41264-024-00268-6
Received:
Revised:
Accepted:
Published:
DOI: https://doi.org/10.1057/s41264-024-00268-6