
Abstract
Catastrophic failure in brittle materials is often due to the rapid growth and coalescence of cracks aided by high internal stresses. Hence, accurate prediction of maximum internal stress is critical to predicting time to failure and improving the fracture resistance and reliability of materials. Existing high-fidelity methods, such as the Finite-Discrete Element Model (FDEM), are limited by their high computational cost. Therefore, to reduce computational cost while preserving accuracy, a deep learning model, StressNet, is proposed to predict the entire sequence of maximum internal stress based on fracture propagation and the initial stress data. More specifically, the Temporal Independent Convolutional Neural Network (TI-CNN) is designed to capture the spatial features of fractures like fracture path and spall regions, and the Bidirectional Long Short-term Memory (Bi-LSTM) Network is adapted to capture the temporal features. By fusing these features, the evolution in time of the maximum internal stress can be accurately predicted. Moreover, an adaptive loss function is designed by dynamically integrating the Mean Squared Error (MSE) and the Mean Absolute Percentage Error (MAPE), to reflect the fluctuations in maximum internal stress. After training, the proposed model is able to compute accurate multi-step predictions of maximum internal stress in approximately 20 seconds, as compared to the FDEM run time of 4 h, with an average MAPE of 2% relative to test data.
Introduction
Brittle materials, such as glass, ceramics, concrete, some metals, and composite materials, are widely used in many applications that involve complex dynamics, impulse, or shock loadings. In structural materials, high-stress concentration around micro-scale defects precipitates cracks, eventually leading to fracture initiation, propagation, and coalescence. In brittle materials, fractures propagate fast with almost no elastic deformation leading to catastrophic failure with little warning. The dynamics of fracture evolution are governed strongly by maximum internal stresses in the material. However, accurate prediction of maximum internal stress of brittle material under dynamic loading conditions remains a challenge in the field of materials science1,2,3. Therefore, ensuring the durability and reliability of brittle materials under various dynamic loading conditions is imperative, especially in cases where accidents can jeopardize safety and security.
A material fails when the maximum internal stress in any direction equals either the tensile or compressive strength4. Under idealized conditions, the internal stress field should be distributed homogeneously through the sample. However, real-world materials inevitably contain microfractures, defects, or impurities, which result in high values of stresses being concentrated internally5,6. Hence, the real fracture strength of a brittle material is usually lower than the theoretical value. The presence of cracks increases stress values locally, and in turn, the stress concentration around fractures results in the fractures propagation. Predicting the maximum internal stress of a material is extremely difficult because the stress and damage are highly coupled.
A common approach to simulate the stress and strain of a given material is the finite element method (FEM)7,8,9. The main idea of FEM lies in simplifying the problem by breaking the material down into a large number of finite elements and then building up an algebraic equation to compute the coupled mechanical deformations and stresses based on the boundary and load conditions. The Hybrid Optimization Software Suite (HOSS), developed at Los Alamos National Laboratory, is a hybrid finite-discrete element method (FDEM) that can simulate the fracture growth of both 2D and 3D physical systems10,11. Within HOSS simulations, the material is modeled as finite elements and the fractures are represented by discrete elements which can only form along the boundaries of the finite elements. Although this method gives accurate predictions of the fracture growth and the dynamics of stress distribution, it is computationally intensive, especially when multiple runs are needed to obtain the statistical variability naturally existent in real-world materials. Machine learning (ML) techniques are becoming popular12 in modeling complex systems because they can serve as lower-order surrogates to approximate higher-fidelity models, which significantly reduces the model complexity and computation time, as shown in Fig. 1.

The machine learning model informs the continuum model with crack statistics and stresses. The machine learning model replaces the expensive mesoscale simulation model (high-fidelity) to speed up predictions while maintaining its accuracy.
Despite recent advances, applying ML models for predicting the maximum internal stress with fracture propagation of materials is still limited. Nash et al.13 reviewed the most recent deep learning methods for detection, modeling, and planning for material deterioration. Nie et al.14 used Encoder-Decoder Structure based on Convolutional Neural Network (CNN) to generate the stress field in cantilevered structures. However, these methods do not consider temporal dynamics of the stress field or fracture within the material. On the other hand, most recent papers focus on predicting the fracture propagation instead of internal stresses. Rovinelli et al.15 built a Bayesian Network (BN) to identify an analytical relationship between crack propagation and its driving force, which focuses on predicting the direction of crack propagation instead of the detailed crack path. Hunter et al.16 applied an Artificial Neural Network (ANN) to approximately learn the dominant trends and effects that can determine the overall material response. Moore et al.17 implemented a Random Forest (RF) and a Decision Tree (DT) to predict the dominant fracture path within the material. Shi18 compared the performance of Support Vector Machine (SVM) and ANN in fracture prediction. Schwarzer et al.10 employed a Graph Convolutional Network to recognize features of the fractured material and a recurrent neural network (RNN) to model the evolution of these features. Fernández-Godino et al.19 used an RNN to bridge meso and continuum scales for accelerating predictions in a high strain rate application problem. One common issue with previous works10,16,17,18,19 is that the models are built on manually selected features such as fracture length, orientation, distance between fractures, etc., instead of features learned from the raw data. Manually selected features could reduce the computation requirement, but it might cause information loss and degrade model performance.
The proposed work seeks to go beyond existing methods by considering a dynamically evolving stress tensor. Simulation results from HOSS, which provide the data for building and validating ML surrogates, have two major properties. First, at each time step, a 3-way tensor representing the spatial properties of fractures and the stress field. In addition, the entire simulation is a time-series representing the temporal dependencies among different time-steps. The relevant literature about extracting spatial features of the tensor data and temporal dependencies of time series data is further reviewed.
For the tensor data, Yue et al.20 proposed a tensor mixed-effects model to analyze massive high-dimensional Raman mapping data with a complex correlation structure. Gao et al.21 integrated supervised tensor decomposition with ensemble learning for quality monitoring in friction stir blind riveting. Yan et al.22 and Si et al.23 applied Graph Convolutional Neural Networks to capture the spatial structure information of a body skeleton to recognize different actions in the video. Shou et al.24 implemented a 3D Convolutional-De-Convolutional structure to detect and localize actions in the video. Wang et al.25 proposed to compress deep learning models using tensor decomposition. All of the aforementioned work proposed methods to extract features from tensor data for different tasks. However, these methods do not consider temporal evolution. Therefore, they cannot be used directly to predict maximum internal stresses with fracture propagation.
For the analysis of time series data, in the context of statistical learning, Auto-Regressive Integrated Moving Average is a class of models that captures a suite of different standard temporal structures in time series data26. In the context of deep learning, RNN and Long Short-term Memory (LSTM) Network were proposed to solve the time-series prediction problem27. Their variants, such as Gated RNN28, were proposed in machine translation, which results in similar performance compared with LSTM. Bidirectional LSTM (Bi-LSTM) was proposed to capture both the forward and backward temporal properties of the sequence29. The attention mechanism was further incorporated into the Bi-LSTM30 to enable the model to assign different weights to the historical data when predicting or translating. Temporal dependency plays a significant role in predicting maximum internal stress. Both maximum internal stress and fracture propagation have temporal features, which need to be fused and incorporated into designing the deep learning surrogates for prediction of maximum internal stress.
Apart from extracting features from historical data, the challenge of predicting maximum internal stress also lies in fusing spatial and temporal features. There are recent advances in feature fusion in other fields. Wang et al.31,32 proposed to combine CNN and LSTM networks to predict the entire video based on the initial few frames. Yao et al.33, Wei et al.34, and Zhang et al.35 proposed to use CNN to represent the spatial view of the city topology and to use LSTM to represent the temporal view of traffic flow for predicting traffic condition. In predicting maximum internal stress, historical stress data does not have sufficient information for future prediction, especially for multi-step prediction. Spatial and temporal properties of fracture propagation serve as necessary and important supplementary information to reduce error accumulation in the multi-step prediction. Incorporating the dynamic changes of fracture into the prediction of maximum internal stress is a key challenge.
This work proposes a deep learning model, StressNet, to predict the maximum internal stress in the fracture propagation process. Instead of deterministically calculating the entire stress field at each time step as HOSS does, StressNet focuses on predicting only the maximum internal stress, which is the key factor influencing material failure. Spatial features of fractures, which are extracted by a Temporal Independent Convolutional Neural Network (TI-CNN), are incorporated to help with the multi-step prediction of the maximum internal stress. StressNet also uses the Bi-directional LSTM (Bi-LSTM)29 to capture the temporal features of fracture propagation and historical maximum internal stress. Finally, StressNet predicts the future maximum internal stress by fusing the aforementioned spatial and temporal features. During the training process, the Mean Squared Error (MSE) and Mean Absolute Percentage Error (MAPE) are integrated as an adaptive objective function, with a dynamically tuned weight coefficient, to predict both the peak and bottom values better. Inspired by physic knowledge and existing works in other domains, the StressNet is designed to incorporate features from fracture propagation into prediction and fuse spatial and temporal features from multiple data formats.
Results
Hybrid optimization software suite (HOSS) simulations
The data used for building and validating the ML model are from two-dimensional HOSS simulations. Each simulation is conducted on a rectangular sample material of 2 m width and 3 m length, loaded with uniaxial tension. At the beginning of each simulation, the material sample is seeded with 20 cracks that mimic initial defects in the material. Each of the initial cracks shares the same length of 20 cm, and the orientation is chosen uniformly randomly to be 0, 60°, or 120° from horizontal. To keep the initial cracks from overlapping, the material sample is divided uniformly into 24 grids, and 20 of them are randomly picked to place initial cracks. As the simulation progresses, some initial cracks propagate and coalesce due to the external tensile loading. The material sample completely fails when there is a single crack spanning the sample horizontally. At this point, the material cannot carry any load.
At each time step, the HOSS simulation outputs a 2-way tensor (matrix) representing the position of current cracks and a 3-way tensor representing the entire stress field. The sample data provided by the simulation is shown in Fig. 2. Figure 2 (a) is the distribution of cracks at each time step, and it is denoted as the damage channel. (b) and (c) are the stress field, decomposed into two directions, Channel xx (σxx) and Channel yy (σyy). To help with easier visualization, the stress field has been normalized into the range [0, 1] in both directions independently. Also, the yellow dashed boxes in Fig. 2 show that stress tends to concentrate on the tips of cracks. Moreover, those cracks propagate when the maximum local stress exceeds a threshold. For more details about HOSS, the reader can refer to10,11,36.

a is the propagation of cracks and the simulation ends when a single crack spans the width of the material, which is shown in the yellow-highlighted region. The white lines represent cracks and the black background represents the normal material. b represents the stress field of σxx and (c) represents the stress field of σyy. According to the yellow dashed boxes highlighted in this figure, the stress tends to concentrate on the tips of existing cracks, and moreover, the cracks will grow because of the stress concentration.
Problem formulation
Since the high-fidelity HOSS model is computationally intensive (each simulation takes about 4 h on 400 processors), a deep learning model, StressNet, is proposed as a surrogate to predict the maximum internal stress until material failure. Instead of the entire stress field, StressNet focuses on the maximum internal stress, which is highly correlated with fracture propagation. This is analogous to the relationship between the spring deformation and the external force. Consequently, in StressNet, the cracks’ information is incorporated to improve the accuracy in multi-step predictions. So that the input of the model consists of two parts, x1, . . . , xΔt denotes the Δt consecutive time-steps of maximum internal stress, and I1, . . . , IΔt denotes the fractures’ information in the same period. The criterion for determining the value of Δt is to find the minimum input length containing sufficient temporal features to make predictions. The cracks’ information is in matrix format at each time step, and it is named as the damage channel in the rest of this paper. The output of the model is the predicted internal stress at the next time step, which is denoted as \({\hat{x}}_{{{\Delta }}t+1}\). To get the multi-step predictions towards the end of one simulation (when the material fails), the result from the former step \({\hat{x}}_{{{\Delta }}t+1}\) is fed into the model to make further predictions.
Data properties
-
Significant Fluctuation: The maximum internal stress changes severely after the initial increase, as shown in red lines in Figs. 3 and 4. There is no obvious trend of the changes in the forward direction. So the model needs to incorporate reference information, forward and backward temporal information to enrich features for the prediction of maximum internal stress.
Fig. 3: Comparison of test results on channel xx (σxx) from different models. 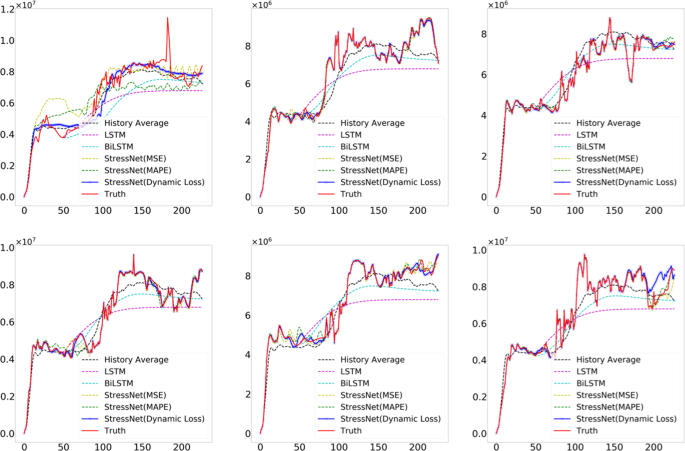
We use the same training and testing data to train and test each model. From the result, StressNet combined with Dynamic Fusion Loss Function receives the best performance (solid blue line).
Fig. 4: Comparison of test results on channel yy (σyy) from different models. 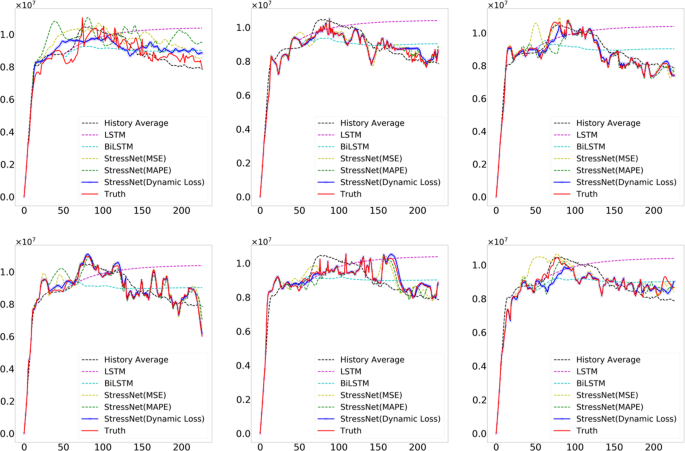
StressNet combined with Dynamic Fusion Loss Function has the best performance (solid blue line).
-
Spatial and Temporal Features: The motivation for incorporating the damage channel into the maximum internal stress prediction is introduced in the section of Problem Formulation. The damage channels within a certain time interval, I1, . . . , IΔt, contain both spatial and temporal features, and the historical stress data contains temporal features. Our model is designed to capture and fuse these features.
-
Large Range: The range of maximum stress data is from zero to a scale of 107. Even after normalization, some of the data will be close to 0, while some of the data will be close to 1. Thus, our model needs to perform well on both peak and bottom values to accurately predict the stress change during the fracture propagation process.


Data description and preprocessing
The dataset is composed of 61 high-fidelity HOSS simulations, and each of them contains 228 time-steps to simulate the detailed fracture propagation process. Each simulation contains the binary image data (damage channel) denoting the position of cracks at each time step, in which 0 represents undamaged material and 1 represents damaged material. Each simulation also contains the time-series maximum internal stress.
The original damage channel has a shape of 192 × 128, which makes the TI-CNN model large and challenging to train. During the data preprocessing, the damage channel is downsampled into the shape 24 × 16 using the max-pooling method with filter size 8 × 8. The downsampled data can preserve the properties of cracks such as orientation, position, and dynamic changes of the crack length.
The time-series maximum internal stress data set has a wide range, and the difference between the peak and bottom value could be up to 107. To tackle this problem, the original data is normalized into the range [0, 1] by using the min-max normalization method, which is given below equation.
where \({x}_{\max }\) and \({x}_{\min }\) are the maximum and minimum stress data among all the simulations. The model is trained and tested by using the normalized data, and then the predicted results are reversed back into the original value.
Furthermore, in HOSS simulations, the stress data at each time step is decomposed into three components, which are denoted as Channel xx, Channel xy, and Channel yy. Among all of them, Channel xx and Channel yy represent two stress components with orthogonal directions and determine the fracture propagation. In the experiment, the same model structure is applied to predict Channel xx and Channel yy separately.
Training settings
The code is implemented using the Python libraries Keras37 and Tensorflow38. During the training phase, the adaptive moment estimator known as the Adam optimizer39 is used, and the learning rate is set at 10−3. Note that Adam is an optimizer based on gradient and momentum, which is used to minimize the loss function and update the weight matrices in StressNet. The dataset contains 61 groups of high-fidelity HOSS simulations, and 55 of them are selected as the training data to build the model. The remaining simulations are used to test model performance after training. In the training process, one epoch represents that the model was trained once throughout the entire training dataset. During each epoch, the dataset is ordered randomly and split into batches. Generally, the training process contains multiple epochs. At each epoch, six simulations are randomly selected and set aside for model validation. Note that validation is conducted at the end of each epoch to assess the model’s performance. The goal of validation is to indicate the model performance in data unseen during the epoch to avoid overfitting. This is different from testing—which is conducted just once after all training—on data never fed to the network during the training process.
In summary, at each epoch, StressNet is trained on 49 simulations, and validated on six simulations. After training, the model is tested on the remaining six simulations. To prevent overfitting, the order of feeding simulations is shuffled every 30 epochs, and the shuffling process is repeated 60 times, which means there are 1,800 epochs total. When the dynamic loss function is applied, the value of λ is set to 0.9 for the first 600 epochs, and then, it is changed to 0.1 for the remaining simulations. The training process takes between 8 to 20 h on a single NVIDIA GeForce GTX 1080Ti GPU, depending on the number of epochs.
The training phase is conducted on one-step prediction, which means that StressNet only predicts one step, and then it compares the result with the ground truth. The input and output of the model at the training phase are shown in Table 1, in which It is the damage channel at time t, \({x}_{t}^{\,\text{norm}\,}\) is the ground truth at time t, and \({\hat{x}}_{t}^{\,\text{norm}\,}\) denotes the prediction at time t. In the simulations, the number of time-steps is T = 228, and Δt = 10. The validation phase has the same setting as the training phase.
Testing settings
The training phase can be conducted on the one-step prediction because the entire time-series stress data are provided to train the model. However, in the testing phase, only the initial Δt steps of stress data, \({x}_{1}^{\,\text{norm}\,},...,{x}_{{{\Delta }}t}^{\,\text{norm}\,}\), are available. Hence, the model has to make predictions recursively by successively using the former prediction \({\hat{x}}_{t}^{\,\text{norm}\,}\) to predict the maximum internal stress \({\hat{x}}_{t+1}^{\,\text{norm}\,}\) in the next time-step. The input and output at the testing phase are shown in Table 2, in which, the previous predictions are served as the model input. It takes ~20 s to generate one entire simulation (228 time-steps).
Baseline models
StressNet has two characteristics. One is that the damage channel is incorporated as reference information to improve accuracy in multi-step predictions on maximum internal stress. The other is that the MAPE and MSE are adaptively fused as loss functions according to the data properties. To show the performance of the proposed StressNet, we selected the diverse baseline models as benchmark. To ensure a fair comparison, all the benchmark methods are trained using the same Adam optimizer.
-
Historical Average: Historical average predicts the maximum internal stress at time step t by using the average value of all simulations at the same time step. In the experiments, the average of all training simulations at each time step is calculated and used as the prediction of the test data.
-
LSTM: LSTM27 is a popular method for time series prediction, which combines the long term and short term temporal dependencies to make the prediction. In the experiment, it is hard for the LSTM to give a reasonable prediction of each simulation (228 time-steps in all) only based on the initial ten time-steps of data. So in the LSTM, the value of Δt is set to 50, which means that the initial 50 time-steps of data are used as the input to recursively predict the entire time-series.
-
Bi-LSTM: The structure of Bi-LSTM29 takes both the forward and backward temporal properties into consideration. Similar to the LSTM, we also set Δt = 50 for the Bi-LSTM.
-
StressNet + MSE: The Mean Squared Error (MSE) is used as the loss function. The model structure of StressNet will be described in Method section. The expression of the MSE is given in Eq. (6).
-
StressNet + MAPE: Another variant of the StressNet is using the Mean Absolute Percentage Error (MAPE) as the loss function. The expression of the MAPE is given in Eq. (7).
Evaluation metrics
To evaluate the performances on predicting the peak and bottom values of maximum internal stress equally, the MAPE is selected to evaluate the performance of StressNet. The expression of MAPE is given as Eq. (7). According to the section of Data Properties, one of the important features of maximum internal stress is that it fluctuates significantly. The MAPE is selected to treat data with large and small values equally when evaluating the model performance.
Performance comparisons
The numerical results of StressNet and baseline models are shown in Table 3. Compared with the baseline models, the proposed StressNet incorporates features from the damage channel and uses the adaptively fusing loss function. To show the benefit of incorporating the damage channel in multi-step predictions, several classical time series prediction models are selected, including Historical Average, LSTM27, and Bi-LSTM29. The results show that StressNet significantly outperforms these time series models even though the LSTM and Bi-LSTM took advantage of using more initial data for model training.
In order to demonstrate the strength of the adaptively fusing loss function, it is compared with its two components MSE and MAPE. From the theoretical analysis, MSE performs better on large values, while MAPE performs better on small values. Among all the variants of the loss function, the results show that the fused loss function achieves the best performance, with an error of 2%.
In order to better visualize the experiment results, the predictions of the different models on the test data and the corresponding ground truth are plotted in Figs. 3 and 4 for channel xx and channel yy, respectively. The figures show that the ground truth plot shows severe fluctuations and orders of magnitude variation. Although the normalization technique makes it smoother, such properties are still a challenge for multi-step predictions. The results of the Historical Average show that it successfully predicts the overall trend of changes but fails to capture the fluctuations and peaks, which are critical factors causing fracture growth. Bi-LSTM29 and LSTM27 share a similar performance to the Historical Average. It mainly because they both tend to pay more attention to the most recent data when making the prediction. If multi-step prediction is conducted recursively, their outputs tend to converge to the same value. StressNet combined with the adaptively fusing loss function successfully captures most of the fluctuations and receives accurate predictions on both peak and bottom values.
Discussion
Maximum internal stress is highly correlated with fracture propagation within the material, and in turn, the presence of fractures plays a key role in determining the level of internal stresses. Due to these complex nonlinear inter-dependencies, accurately predicting the maximum internal stress remains a challenging problem in materials science. The contribution of this work lies in designing a physics-based model, StressNet, which combines the material fracture characteristics and the data properties within a deep learning architecture. StressNet is designed to predict the entire sequence of maximum internal stress until material failure. Unlike statistical learning methods or those using manually selected features, StressNet that directly integrates the damage channel into the multi-step predictions, and learns the features by minimizing a loss function. The advantages of the StressNet could be summarized as follows. (i) After training, the model can generate the entire time series of maximum internal stress in about 20 s, which significantly reduces the computation time from more than 4 h to 20 s as compared to the high-fidelity HOSS model. (ii) Compared with statistical learning models, the proposed model receives the best prediction performance with an error of 2%. (iii) As a physics informed data-driven model, StressNet is flexible enough such that it is easy to generalize to other fracture propagation scenarios that involve diverse loading conditions and different material properties.
Methods
Temporal independent convolutional neural network (TI-CNN)
StressNet is a deep learning model that incorporates both the spatial and temporal features of fracture propagation for maximum internal stress prediction. Specifically, the Temporal Independent CNN (TI-CNN) captures spatial features of the damage channel at each time step, and the Bidirectional LSTM (Bi-LSTM) is adapted to capture the temporal features in the fracture propagation and historical stress data. Spatial features in the stress field indicate the material fracture path and distributions at each time step. Temporal features both describe the dynamic properties of fracture growth, which rely on external loadings and material physical properties, and contain the features from historical stress data. The proposed StressNet makes full use of various data formats (damage channel and stress field) of HOSS simulation outputs, and fuses the spatial and temporal features of those data. In this way, the maximum internal stress in the future time-steps can be accurately predicted. In this section, building blocks (TI-CNN and Bi-LSTM) of StressNet are firstly introduced. Then, the detailed architecture of StressNet is discussed.
Changes in the fracture pattern could indicate changes in the maximum internal stress; therefore, the TI-CNN extracts spatial features from the damage channel to represent crack information (including length, orientation, position, propagation, pairwise distance, etc.). As shown in Fig. 5, the input of TI-CNN is a 3-way tensor with a shape of h × w × Δt, in which the third dimension represents the time interval. The original convolution operation is directly applied to the entire tensor, which will destroy the temporal dependencies40. To keep temporal dependencies unchanged as well as extracting spatial features, in TI-CNN, the independent convolution kernel is defined for the damage channel at each time step. In a nutshell, the TI-CNN model consists of a stack of distinct layers, and the input tensor (damage channels within a certain interval) passes through these layers and outputs the features. Each of the layers is tailored for stress prediction, which is introduced below.

In TI-CNN, the independent convolution kernel for the damage channel at each time step is defined. In this way, the spatial features from the damage channel are extracted without changing the temporal dependencies.
Temporal Independent Convolutional Layer: Suppose that the input of the lth convolutional layer is \({{\mathcal{X}}}_{l}\) with a shape of Hl × Wl × Δt, in which Hl and Wl represent the spatial dimension, and Δt denotes the temporal dimension. The corresponding convolutional kernel \({{\mathcal{K}}}_{l}\) has a shape of d × d × Dl, in which d represents the spatial size of the convolutional kernel, and Dl denotes the number of kernels. In the Temporal Independent Convolutional Layer, the number of kernels (Dl) is set equal to the number of input channels (Δt), and the convolution operation is conducted on each input channel separately. The expression of Temporal Independent Convolutional Layer is given as below equation.
In Eq. (2), \({{\mathcal{X}}}_{l+1}\in {{\mathbb{R}}}^{({H}_{l}-d+1)\times ({W}_{l}-d+1)\times {{\Delta }}t}\) represents the output tensor of the lth convolutional layer, which is also the input of the next layer.
In maximum internal stress prediction, the initial input of TI-CNN is a time-series damage channel has a shape of h × w × Δt, as Fig. 5 shows. To capture spatial features and keep temporal dependencies unchanged, the temporal independent convolution operation is conducted on the damage channels. The output is further fed into the following pooling layer.
Pooling Layer: The pooling layer is, generally, a non-linear downsampling function. For the sake of consistency, suppose that the input of the lth pooling layer is \({{\mathcal{X}}}_{l}\) with a shape of Hl × Wl × Δt, and the kernel size of the pooling layer is d × d. The output of this layer \({{\mathcal{X}}}_{l+1}\) has the shape \(\frac{{H}_{l}}{d}\times \frac{{W}_{l}}{d}\times {{\Delta }}t\). In general, there are two kinds of pooling layers: average-pooling and max-pooling. For the pooling operation, at first, each channel of the input tensor is divided into non-overlapping partitions which share the same spatial dimension (d × d) as the kernel. Then, for the average pooling, the mean value of each partition is calculated, while for the max-pooling, the maximum value of each partition is calculated.
Fractures only take up a small area in the material; therefore, if average pooling is used, then the features of the large undamaged area would dilute or even hide the features of the small damaged area. Therefore, max-pooling is used in TI-CNN to amplify the features of fracture propagation.
Fully Connected Layer: The fully connected layer takes the feature map from the previous layer as the input and outputs the feature vector by matrix multiplication. Suppose that the input of the fully connected layer is \({{\mathcal{X}}}_{l}\) with a shape of Hl × Wl × Δt, it is at first reshaped into \({\widetilde{X}}_{l}\in {{\mathbb{R}}}^{{H}_{l}{W}_{l}\times {{\Delta }}t}\), and the output of this layer is calculated in.
In Eq. (3), \(W\in {{\mathbb{R}}}^{D\times {H}_{l}{W}_{l}}\) represents the weight matrix in the fully connected layer, and \({X}_{l+1}\in {{\mathbb{R}}}^{D\times {{\Delta }}t}\) represents the output of the fully connected layer.
The output of the TI-CNN has a shape of D × Δt, which is the time series feature vector containing the spatial properties and preserving temporal dependencies of material fracture propagation.
Bidirectional LSTM (Bi-LSTM) on temporal dependency
Capturing temporal dependencies is essential in predicting maximum internal stress with fracture propagation. LSTMs27 are efficient variants of recurrent neural networks which can selectively remember the immediate history of the input sequence and longer-term trends. However, LSTMs only consider the forward pass over an input sequence; so the prediction error accumulates when the former prediction results are used to make multi-step predictions. To reduce the accumulated error, each step prediction must be as precise as possible: not only consistent with the forward property (from past to future) but also consistent with the backward property (from future to past). Therefore, the temporal features in fracture propagation and historical stress data are captured with a Bi-LSTM29, to ensure that their predictions are consistent with forward and backward temporal dependencies.
The structure of the Bi-LSTM29 is shown in Fig. 6, in which the model predicts the \({\hat{x}}_{t}\) given the input time series data xt−k, . . . , xt−1. Compared with LSTM, it has one extra hidden layer to capture the backward temporal properties within the input data. More specifically, for maximum internal stress prediction, there are two sources of time-series data serving as the input of Bi-LSTM, one of them is the time-series maximum internal stress, and the other is the time-series spatial features extracted from the damage channel (output of TI-CNN). The expressions of Bi-LSTM corresponding to Fig. 6 are given below.
In Eq. (4), the \({\vec{{\bf{h}}}}_{t}\) and \({\overleftarrow{{\bf{h}}}}_{t}\) represent the forward and backward temporal feature vectors at time t, respectively; Wi, i = 1, . . . , 6, denote the weight matrices in the Bi-LSTM, bj, j = 1, 2, 3, represent biases; and xt represents the prediction result.

The Bi-LSTM can be regarded as two layers of LSTM, in which the upper layer captures the forward temporal features and the bottom layer captures the backward temporal features.
In maximum internal stress prediction, the stress data have significant variations and do not have an apparent trend in the first few time-steps, which makes the multi-step prediction challenging. So Bi-LSTM is adapted to capture the complex temporal dependency. In general, the Bi-LSTM is mainly used for two purposes. First, separate Bi-LSTMs are adapted to encode the historical maximum internal stress and the time-series spatial feature vectors (extracted from damage channels), and output fixed- dimension time-series feature vectors. Second, the time-series feature vectors from two data sources are fused and decoded to make a prediction. Detailed explanations will be given in next section.
Based on the coupling effect between maximum internal stress and fracture propagation, it is hard to predict the future maximum internal stress purely based on previous stress data. Therefore, the time-series spatial feature vectors extracted from the damage channel is incorporated to improve the performance of prediction. In next section, the structure of StressNet is introduced to encode the dynamic properties of the maximum internal stress and fuse the spatial internal and temporal features.
StressNet - Convolutional aided bidirectional LSTM
The basic building blocks of StressNet are introduced in previous sections. TI-CNN is mainly used to capture the spatial features of the damage channel, and Bi-LSTM is mainly used to encode the temporal dependencies of historical data. StressNet is proposed to fuse the features from these building blocks and improve the multi-step prediction performance.
The structure of StressNet is shown in Fig. 7. The goal is to predict the maximum internal stress at the next time step, given the previous maximum internal stress and damage channels, which is shown in Eq. (5). The left branch of StressNet uses the Bi-LSTM to capture the bidirectional temporal properties of historical maximum internal stress. Suppose that initially, there are consecutive Δt steps of stress data xt−1, xt−2, . . . , xt−Δt, the Bi-LSTM will encode their temporal dependencies into time-series feature vectors with a shape of D × Δt (as the red part shown in Fig. 7). The right branch of StressNet uses TI-CNN to extract spatial features of the damage channels within the same consecutive time-steps It−1, It−2, . . . , It−Δt, and then further extract the temporal features into time-series vectors with the same shape D × Δt (as the blue part shown in Fig. 7). Up to now, at each time step, there are two feature vectors with the same shape D representing the features from the stress data and the damage channel, respectively. Every pair of feature vectors are concatenated and fed into the last Bi-LSTM layer to fuse and decode their temporal information. Finally, the predicted maximum internal stress \({\hat{x}}_{t}\) is given by the final fully connected layer.
In summary, StressNet is designed to take the historical stress data (vector) and damage channels (3-way tensor) as the input to predict the maximum internal stress in the next time step. To generate the entire sequence of stress data recursively, the previously predicted results will be fed into the StressNet to make further predictions. As a surrogate model of HOSS simulation, StressNet will be trained and validated on the simulations generated from HOSS. After training, accurate prediction of maximum internal stress is beneficial to ensure the material reliability and further applied to evaluate its residual life.

The model consists of two branches. In the left branch, the Bi-LSTM encodes the temporal dependency among historical maximum stress data into a series of vectors. In the right branch, TI-CNN followed by Bi-LSTM encodes the spatial and temporal information of the damage channel into another series of vectors. By fusing features from these two branches, StressNet can predict the maximum stress at the next time step.
Loss function
The loss function is used to evaluate the difference between the ground truth and model prediction. The unknown parameters in our model are estimated by minimizing the loss function. StressNet is tested on three different loss functions, which are MSE, MAPE, and dynamic fusion of MAPE and MSE.
The MSE is calculated as Eq. (6). The MSE will tend to perform better in predicting large values while ignoring small values to some extent. Also, the MSE is easy to optimize.
The expression of MAPE is given as Eq. (7). In practice, unlike the MSE, the advantage of MAPE is that it is a relative loss which treats the large and small values equally. However, it is hard to get the minimum by using gradient descent methods because of the absolute component.
In the problem of maximum internal stress prediction, the stress data fluctuate significantly with time. Capturing those fluctuations requires StressNet to predict both the large and small values precisely. Moreover, StressNet should pay more attention to large values because they will have a major impact on the fracture propagation. Furthermore, the loss function should adapt to the stress fluctuation and be easy to converge. Based on these requirements, an adaptive loss function is designed as the dynamic fusion of MAPE and MSE. The expression is given below.
In Eq. (8), θ represents the trainable parameters in StressNet; β represents the index of the current training epoch. λ is the hyper-parameter. It is the function of β and is used to fuse the two components. The value of λ is updated during the training process. In general, MSE tends to give better prediction on large values, while MAPE tends to perform better on small values. λ is set to a large value at the beginning of the training process to get better performance on large target values. As the training process goes by, the value of λ is decreased for improving prediction on the small target values. This loss function is easy to optimize and is robust to large and small values.
Data availability
The data that support the findings of this study was generated in Los Alamos National Laboratory. Restrictions may apply to the availability of these data, Data are available from the authors upon reasonable request and with permission of Los Alamos National Laboratory.
Code availability
The StressNet code will be available upon request to the corresponding author.
References
Forquin, P. Brittle materials at high-loading rates: an open area of research. Philos. Trans. R. Soc. Math. Phys. Eng. Sci. 375, 20160436 (2017).
Perez, N Fracture mech anics, 25–38 (Springer US: 2004).
Wen, Y., Yue, X., Hunt, J. H. & Shi, J. Virtual assembly and residual stress analysis for the composite fuselage assembly process. J. Manuf. Syst. 52, 55–62 (2019).
Leckie, F. A. & Bello, D. J. Strength and stiffness of engineering systems. Mechanical engineering series (Springer, 2009).
Noda, N.-A. et al. Strain rate concentration and dynamic stress concentration for double-edge-notched specimens subjected to high-speed tensile loads. Fatigue Fract. Eng. Mater. Struct. 38, 125–138 (2015).
Durelli, A. J. & Jacobson, R. H. Brittle-material failures as indicators of stress-concentration factors. Exp. Mech. 2, 65–74 (1962).
Ashcroft, I. A. & Mubashar, A. Numerical approach: finite element analysis, 629–660 (Springer Berlin Heidelberg: 2011).
Ma, Y., Liu, S., Feng, P. F. & Yu, D. W. Finite element analysis of residual stresses and thin plate distortion after face milling. In 2015 12th International Bhurban Conference on Applied Sciences and Technology (IBCAST), 67–71 (2015).
Wen, Y., Yue, X., Hunt, J. H. & Shi, J. Feasibility analysis of composite fuselage shape control via finite element analysis. J Manuf. Syst. 46, 272–281 (2018).
Schwarzer, M. et al. Learning to fail: predicting fracture evolution in brittle material models using recurrent graph convolutional neural networks. Comput. Mater. Sci. 162, 322–332 (2019).
Knight, E. E., Rougier, E., Lei, Z. & Munjiza, A. Hybrid optimization software suite, version 00 (2014).
Yue, X., Wen, Y., Hunt, J. H. & Shi, J. Surrogate model-based control considering uncertainties for composite fuselage assembly. J. Manuf. Sci. Eng. 140(4), 041017 (2018).
Nash, W., Drummond, T. & Birbilis, N. A review of deep learning in the study of materials degradation. NPJ Mater. Degrad. 2, 37 (2018).
Nie, Z., Jiang, H. & Kara, L. B. Stress field prediction in cantilevered structures using convolutional neural networks. J. Comput. Inf. Sci. Eng. 20(1), 011002 (2020).
Rovinelli, A., Sangid, M. D., Proudhon, H. & Ludwig, W. Using machine learning and a data-driven approach to identify the small fatigue crack driving force in polycrystalline materials. NPJ Comput. Mater. 4, 1–10 (2018).
Hunter, A. et al. Reduced-order modeling through machine learning and graph-theoretic approaches for brittle fracture applications. Comput. Mater. Sci. 157, 87–98 (2019).
Moore, B. A. et al. Predictive modeling of dynamic fracture growth in brittle materials with machine learning. Comput. Mater. Sci. 148, 46–53 (2018).
Shi, G. Superiorities of support vector machine in fracture prediction and gassiness evaluation. Pet Explor. Dev. 35, 588–594 (2008).
Fernández-Godino, M. G. et al. Accelerating high-strain continuum-scale brittle fracture simulations with machine learning. Comput Mater Sci. 186, 109959 (2021).
Yue, X., Park, J. G., Liang, Z. & Shi, J. Tensor mixed effects model with application to nanomanufacturing inspection. Technometrics 62(1), 116–129 (2020).
Gao, Z., Guo, W. & Yue, X. Optimal integration of supervised tensor decomposition and ensemble learning for itin situ quality evaluation in friction stir blind riveting. IEEE Trans Autom. Sci. Eng. 18(1), 19–35 (2021).
Yan, S., Xiong, Y. & Lin, D. Spatial temporal graph convolutional networks for skeleton-based action recognition. In 32nd AAAI Conference on Artificial Intelligence, 7444–7452 (2018).
Si, C., Jing, Y., Wang, W., Wang, L. & Tan, T. Skeleton-based action recognition with spatial reasoning and temporal stack learning. In Proceedings of the European Conference on Computer Vision (ECCV) (2018).
Shou, Z., Chan, J., Zareian, A., Miyazawa, K. & Chang, S.-F. Cdc: Convolutional-de-convolutional networks for precise temporal action localization in untrimmed videos. In Proceedings of the IEEE Conference on Computer Vision and Pattern Recognition (CVPR) (2017).
Wang, Y., Guo, W. & Yue, X. Cpac-conv: Cp-decomposition to approximately compress convolutional layers in deep learning. arXiv preprint arXiv:2005.13746 (2020).
Chatfield, C. & Prothero, D. L. Box-jenkins seasonal forecasting: problems in a case-study. J. R. Stat. Soc. Series A (General) 136, 295–336 (1973).
Hochreiter, S. & Schmidhuber, J. Long short-term memory. Neural Comput. 9, 1735–1780 (1997).
Cho, K., van Merrienboer, B., Bahdanau, D. & Bengio, Y. On the properties of neural machine translation: Encoder-decoder approaches. In Eighth Workshop on Syntax, Semantics and Structure in Statistical Translation (SSST-8), 103–111 (2014).
Schuster, M. & Paliwal, K. Bidirectional recurrent neural networks. IEEE Trans. Signal Process. 45, 2673–2681 (1997).
Bahdanau, D., Cho, K. & Bengio, Y. Neural machine translation by jointly learning to align and translate. international conference on learning representations (2014).
Wang, Y., Long, M., Wang, J., Gao, Z. & Yu, P. S. Predrnn: Recurrent neural networks for predictive learning using spatiotemporal lstms. In Advances in Neural Information Processing Systems 30, 879–888 (2017).
Wang, Y., Gao, Z., Long, M., Wang, J. & Yu, P. S. PredRNN++: Towards a resolution of the deep-in-time dilemma in spatiotemporal predictive learning. In Proceedings of the 35th International Conference on Machine Learning, 80, 5123–5132 (2018).
Deep multi-view spatial-temporal network for taxi demand prediction. In 32nd AAAI Conference on Artificial Intelligence, 2588–2595 (2018).
Wei, H., Zheng, G., Yao, H. & Li, Z. Intellilight: A reinforcement learning approach for intelligent traffic light control. In Proceedings of the 24th ACM SIGKDD International Conference on Knowledge Discovery Data Mining, 2496–2505 (2018).
Zhang, H. et al. Cityflow: A multi-agent reinforcement learning environment for large scale city traffic scenario. In The World Wide Web Conference, 3620–3624 (2019).
Lei, Z., Rougier, E., Knight, E. E., Munjiza, A. & Viswanathan, H. A generalized anisotropic deformation formulation for geomaterials. Comput Particle Mech. 3, 215–228 (2016).
Chollet, F. et al. Keras. https://github.com/fchollet/keras (2015).
Abadi, M. et al. TensorFlow: Large-scale machine learning on heterogeneous systems. Software available from tensorflow.org (2015).
Kingma, P. D. & Ba, L. J. Adam: A method for stochastic optimization. international conference on learning representations (2015).
Krizhevsky, A., Sutskever, I. & Hinton, G. E. Imagenet classification with deep convolutional neural networks. In Advances in Neural Information Processing Systems 25, 1097–1105 (2012).
Acknowledgements
D.O., N.P., and G.S. were supported by the Laboratory Directed Research and Development program of Los Alamos National Laboratory under project number 20170103DR; Y.W. was supported by the LANL Applied Machine Learning Summer Research Fellowship; X.Y. were partially supported by the National Science Foundation under project number 1855651.
Author information
Authors and Affiliations
Contributions
Y.W. mainly conducted the data preprocessing, model designing, and results comparison under the guidance of D.O. and X.Y. W.G.G. mainly offered ideas in results comparison. A.M., and C.B.S. offered the experimental data. N.P., M.G.F.-G., and G.S. offered the physical interpretation of data, provided ideas in model designing. All authors discussed the results and contributed to the final version of manuscript.
Corresponding author
Ethics declarations
Competing interests
The authors declare no competing interests.
Additional information
Publisher’s note Springer Nature remains neutral with regard to jurisdictional claims in published maps and institutional affiliations.
Rights and permissions
Open Access This article is licensed under a Creative Commons Attribution 4.0 International License, which permits use, sharing, adaptation, distribution and reproduction in any medium or format, as long as you give appropriate credit to the original author(s) and the source, provide a link to the Creative Commons license, and indicate if changes were made. The images or other third party material in this article are included in the article’s Creative Commons license, unless indicated otherwise in a credit line to the material. If material is not included in the article’s Creative Commons license and your intended use is not permitted by statutory regulation or exceeds the permitted use, you will need to obtain permission directly from the copyright holder. To view a copy of this license, visit http://creativecommons.org/licenses/by/4.0/.
About this article

Cite this article
Wang, Y., Oyen, D., Guo, W.(. et al. StressNet - Deep learning to predict stress with fracture propagation in brittle materials. npj Mater Degrad 5, 6 (2021). https://doi.org/10.1038/s41529-021-00151-y
Received:
Accepted:
Published:
DOI: https://doi.org/10.1038/s41529-021-00151-y
- Springer Nature Limited
This article is cited by
-
Performance evaluation of deep learning approaches for predicting mechanical fields in composites
Engineering with Computers (2024)
-
Prediction and control of fracture paths in disordered architected materials using graph neural networks
Communications Engineering (2023)
-
Integration of thermal imaging and neural networks for mechanical strength analysis and fracture prediction in 3D-printed plastic parts
Scientific Reports (2022)
-
Predicting stress, strain and deformation fields in materials and structures with graph neural networks
Scientific Reports (2022)
-
A Bayesian multiscale CNN framework to predict local stress fields in structures with microscale features
Computational Mechanics (2022)