
Abstract
We provide a critique of the standard methodology for inequality measurement, which makes welfare comparisons between households by deflating household income and consumption with an equivalence scale. We argue that this leads to support for tax/transfer policies that significantly disadvantage low to middle income households and second earners—predominantly women. Its main limitations are that it takes an overly-simplistic approach to household production, bases its welfare measurements on joint household income, and has no theory of the family household. We point the way to an alternative procedure by presenting a theoretical model of the family household that derives duality-based welfare measures. In the light of current data limitations we propose, as a second best, primary earner income as a superior base to joint income for across-household welfare comparisons in policy formulation. We also emphasise the importance of taking the family life cycle into account when making such comparisons. We use the Australian income tax system and Australian income and tax data for a detailed comparison of the standard approach with our proposed alternative.
1 Introduction
The use of equivalisation indices to deflate measures of household income and consumption in empirical studies of the family household has become widespread and routine, although some economists have argued strongly against it.Footnote 1 In practice a number of widely used equivalence scales exist. Their aim is based on an assumed need to take account of the variations in size and composition of households and economies of scale in the household consumption process when making welfare comparisons across heterogeneous households.
Equivalence scales in general are constructed on the basis of some calculation of the “needs” of individuals of different ages. Then with each household in the sample is associated a number of “adult equivalents”. The idea of economies of scale is reflected in weights of less than one for adults beyond the first and smaller weights for children.Footnote 2 By deflating a household’s total income by the equivalence index and assuming that income is equally distributed across adult equivalents within the household,Footnote 3 a single number is obtained, which, it is assumed, characterises the standard of living of each adult in the household and is directly comparable across households.
For example the widely used OECD “square root” scaleFootnote 4 deflates household aggregates, such as gross and disposable incomes and total consumption, by the square root of the number of individuals in the household. Another typical example is the “Oxford modified” scale used by the Australian Productivity Commission.Footnote 5 A scale of 1 point is used for the first adult, 0.5 for each additional person aged 15 years or more, and 0.3 points for each child under 15 years. If, for example, a household with two adults and two children had a joint income of 2.1 times that of a reference single person household the two households would be considered equally well off. A number of other scales that use a similar procedure, but with different numbers, have been proposed over the years.
It is not difficult to be critical of this type of homogenisation procedure as a way of dealing with household heterogeneity. Our aim in this paper is to focus more directly on the connection between inequality measurement and the formulation of tax/transfer policies. Perceptions of the ranking of households in terms of which household types are better and which worse off will obviously be influential in determining the support for a particular policy. For example, we show below that equivalence scales based on total household income lend support to joint rather than individual income tax systems.Footnote 6
One important source of support for this view is the belief that, controlling for family composition, equilibrium household income and individual wellbeing are co-monotonic: one necessarily increases with the other as we move through the equilibria of a given set of households, or, in other words, a ranking of households in terms of equivalised household income corresponds to a ranking in terms of individual wellbeing. Although in the standard household model in which single individuals divide their time between work and leisure this seems unobjectionable, in a world of couple households with considerable heterogeneity in second earner labour supplies it is no longer true in general.
Moreover, the equivalisation procedure, when based on standard demographic variables, assumes that the components of the household type vectorFootnote 7 are fully observed, and therefore rules out consideration of the implications of the fact that important components of this vector may not be observable, or, more accurately, not currently available in existing datasets. This has to do with the absence of a conceptual framework for family household decision taking of the kind we provide in this paper.
The simple assumption of “economies of scale” applying in some way to household consumption processes does not do justice to the complexity of realistic household production functions. It confuses two aspects of household production that have long been well understood: first, the presence of non-assignable goods, often referred to as “household public goods”;Footnote 8 and secondly, the significance of joint production in household production processes.Footnote 9 The critique of the Becker model of household production by Pollak and Wachter (1975) emphasised the importance of multi-activity production functions characterised by significant joint production,Footnote 10 without the presumption that economies of scale apply to all or even the majority of household production processes. Even the most recent contributions to the family economics literature have not really dealt comprehensively with this issue, nor with the presence of a significant subset of couple households in which the second earner does not participate in the labour force.Footnote 11
The models we present in this paperFootnote 12 analyse the implications of taking household production and second earner non-participation into account. Our main focus is on across-household inequality measurement, with the aim of showing that household equivalence scales are both unnecessary and misleading. In particular, they offer support for tax/transfer policies that make low-to-middle income households and second earners - predominantly women - in those households significantly worse off than they would be under alternative policies. Following the discussion of the models, we present an in-depth analysis of the Australian family tax system to support our argument. The results of the models suggest the need for data that does not appear in available datasets, but the second best approach we adopt to deal with this is we believe sufficient to support our main argument. This also leads us to describe the kinds of data collection that should take place to allow more comprehensive measures to be constructed.
2 Exchange models of the household
The models here have the general aim of clarifying the limitations of the equivalisation procedure and providing the basis for an alternative, by characterising the variables exogenous to the household that are the main determinants of the wellbeing of individuals across a given set of households.
The majority of models in family economicsFootnote 13 assume that households take decisions cooperatively in choosing Pareto efficient allocations of consumptions and time use.Footnote 14 In the earlier literature a relatively small subset of these models took account of household production,Footnote 15 though there does now seem to be an increasing tendency to do so. There is also a subset of models that assumes the household behaves entirely non-cooperatively,Footnote 16 and some empirical evidence to suggest that both types of household may exist.Footnote 17
The models have as a central principle the idea that households are characterised by specialisation and exchange. In a family household the primary earner specialises in market work, the second earner does significantly more of the household production, even if working full-time in the labour market, but may on the other hand have only a part time job or none at all. Her (assignable) consumption expenditures may well exceed her market income. This should however be regarded not as an altruisitic transfer from the primary earner, but rather as an implicit exchange of market for household goods. Note therefore that the designations “primary” and “second” earner are based on role (and income level) rather than gender.Footnote 18 We consider both assignable and non-assignable goods.
For the purposes of this paper, it is sufficient to make the assumption that the equilibrium outcome of the model is Pareto efficient.Footnote 19 This allows us to clarify the key exogenous variables that determine across-household inequality, while being consistent with a large range, though not all, of the existing models in the family economics literature. In this section we consider two cases. In the first the second-earner participates in the labour market, while in the second she does not participate. We then explore the implications of the results for the measurement of inequality.
2.1 The two-earner household
Households consists of a primary and a second earner, both supplying time to the labour market. They divide their time between market labour supply L, leisure l, and time t spent in production of an assignable good z and a non-assignable good g. The individuals have market wage rates of \(w_{i},\) \(i=1,2,\) with \(w_{1}\ge w_{2}>0,\) and \(i=1\) denotes the primary earner. In this first model these wage rates are the opportunity costs both of leisure and of time spent in household production.Footnote 20 There is also a market composite consumption good x, the numéraire with price normalised to 1, as well as a bought in market input b which is used in production of both household goods.Footnote 21 The price of this input is \(p>0\), and this may also vary across households. The household production function constraints are
The production functions \(f^{z}(.),f^{g}(.)\) are continuously differentiable and concave, so we are ruling out economies of scale.Footnote 22 The exogenously given parameters \(k_{ij},q_{j}>0,\) \(j\in \{z,g)\) are productivities that can vary between individuals and across households. We are making here the very strong assumption that the production processes are separable: variations in the inputs and outputs of one household good have no direct effects on those of the other. This rules out joint production, which we briefly consider below.
The individual time constraints, with total time available normalised to 1, are then:
The individual utility functions are strictly quasiconcave and increasing and given by:
where preferences are identical across all individuals and households.Footnote 23
The household’s budget constraint is:
Since the household chooses a Pareto efficient allocation of consumption goods and time it solves the problem:
for any arbitrary value \(u_{2}^{0}>0.\) Assuming an interior solution with \(L_{i}>0\) \(i=1,2,\) and given the assumptions of the model, the first order conditionsFootnote 24 give a global optimum yielding values of all the endogenous variables as differentiable functions of the vector of exogenous variables, which we denote by
Thus this vector \(\varphi\) gives the list of determinants of the wellbeing of the household members since it determines all their consumption demands for goods and leisure as well as their labour supplies. As a result, we can define the individual indirect utility functions:
for any given value \(u_{2}^{0},\) with of course \(v_{2}\equiv\) \(u_{2}^{0}.\) Individual expenditure functions \(e_{i}(\varphi ,v_{i}(\varphi ))\) can be found as the amounts of the consumption good that would have to be given to each individual to allow them to reach the utility level \(v_{i}(\varphi )\), conditional on the household having enough to fund the optimal amount of the non-assigned good.
Applying the Envelope Theorem we have what we need for qualitative determination of how household welfare varies with respect to the components of \(\varphi\) at any given value of \(u_{2}^{0}\). Denoting the optimised value of \(v_{1}\) by \(v_{1}^{*}\) that theorem gives, using the Lagrange function at the optimal point, with \(i=1,2\) and \(j\in \{z,g):\)
Thus, we have that increases in either wage rate and in any of the productivity parameters \(k_{ij},q_{j}\) increase the primary earner’s utility, and therefore the level of overall household wellbeing, at any given utility level of the second earner, while increases in the price of the bought in input will reduce it. This is perfectly intuitive.Footnote 25
There are then two ways in which we can approach the measurement of individual utility in households with identical preferences.Footnote 26 Given a parameterised utility function we could on the one hand collect information on the vectors of endogenous variables \([x_{i},z_{i},l_{i},g]\) and compute the resulting direct utilitiesFootnote 27, \(u_{i}^{*};\) or on the other hand collect information on the vectors of exogenous variables \(\varphi\) and calculate the indirect utilities \(v_{i}^{*}.\) In the former case, we would need measures of the outputs \(z_{i}\) and g, as well as individual consumptionsFootnote 28\(x_{i},\) and in the latter case we would need values of the wage rates \(w_{i}\) and productivities \(k_{ij},q_{j}\) as well as data on the input prices. In neither case is it sufficient to have measures only of the inputs such as time spent in household production, because this does not give us the parameters of the household production functions. In the absence of information on these functions, we must either assume that household production is irrelevant/does not exist, as in the case of standard equivalence scales, or, as the better second best, seek to find proxies for the missing information in the data available, which is the approach we adopt in this paper.
2.2 Non-participation
In the OECD countries, on average roughly one-third of family households have just one earner. Yet this seems to be ignored in almost all of the work on within-household allocations of consumption and time. If there is no household production then, since the non-working spouse has no market income, the entire expenditure on market consumption goods and bought in inputs must be provided out of the primary earner’s income, and the value of consumption of the non-working spouse can only be interpreted as a pure transfer. All of her time must be assumed to consist of leisure. This is an illustration of how ignoring the existence of household production can have misleading implications.
If the household has decided on the second earner’s non-participation in the labour market, in the sense that at the margin an increase in the market wage she is expected to get would not change that decision, then the model with household production has to be reformulated, since, as we show,Footnote 29 her (potential) market wage rate may no longer give the marginal opportunity cost of her time. If she supplies no time to the market, this implies that the marginal value product of her time in household production, which we denote by \(\hat{w}_{2},\) is at least as high as her market wage (net of tax and any other costs of work, both fixed and marginal, such as child care costs). Does that imply that any consumption of her own must be regarded as a lump sum transfer from the primary earner? Obviously not, since she is simply specialising in the production of the household goods which she (implicitly) exchanges for market goods.
From this we conclude that if \(w_{2}<\) \(\hat{w}_{2}\) the market wage gives an underestimate of the marginal value product of the time the second earner spends in household production. This also implies that \(w_{2}l_{2}\) is an underestimate of the value of the second earner’s leisure time, since \(\hat{w }_{2}\) is also the implicit price of leisure (in consumption units) for the second earner. In an across-household inequality analysis, the wellbeing of households with non-participating second earners is then in general understated, even if an adjustment is made for the second earner’s leisure time by multiplying it by the market wage. In terms of the vector of characteristics \(\varphi ,\) for households in which the solution for the second earner’s labour supply is intramarginal, we could eliminate \(w_{2}\) since this has no effect at the margin on the level of wellbeing of the household.
If we want to allow for joint production in the model, in relation to parental time inputs for example, we would simply have to re-write the production function constraints as:
Then in the case where \(L_{i}>0,\) \(i=1,2,\) the sum of the marginal value products with respect to \(t_{i}\) would equal \(w_{i},\) whereas when \(L_{2}=0\) we would again have that \(w_{i}\) is only a lower bound to this sum and is likely to understate this value even more.
2.3 The life cycle and disaggregation
From the perspective of the analysis of tax/transfer policy, the main relevance of the life cycle is to the cross-section of households in a given time period rather than to the case of a given household going through its life cycle phases over time. Current governments cannot bind future governments to any given policy, but existing tax /transfer systems can and do take account of the decisions driven by structures of preferences and constraints of households currently at different stages of their life cycle.
At the same time, welfare comparisons based on equivalivised household income across a population of households that are at different phases of their life cycles are of doubtful usefulness: what does it mean to compare on the basis of equivalised incomes the wellbeing of a young two-earner couple who have not yet had children, a single earner household with a child under school age, and a retired couple? All of these households could have about the same equivalised household incomes and so would be ranked as equally well off. Moreover, the amounts of household production can be expected to vary significantly across the household life cycle, at its highest when young children are presentFootnote 30 and in retirement.Footnote 31
When the principal aim of welfare comparisons is to design tax/transfer policies a different approach is required. Quite obviously, there has to be differentiation between the policy issues around households at different phases of the family life cycle. We would go further and argue that households should be assigned to life cycle phases according to the similarity of the preference structures and constraint sets that confront them, since these are the policy-relevant determinants of their wellbeing. For this reason, we have argued for a specification of the life cycle based not on the age of the “head of the household”, as is the usual case in life cycle studies, but rather upon the phases through which family households typically go.Footnote 32
For couples, for example, perhaps the broadest characterisation would be of a life cycle defined on five phases: the first phase in which the couple household has been formed but no children are present; the second, in which there are children of pre-school age in the household; the third, in which the children are older but still present in the household; the fourth, in which children have left home but the parents are still of working age: and the last phase in which both adults have retired.Footnote 33 Clearly, across these phases structures of preferences and constraints can be expected to vary significantly, as would the values of the vectors of characteristics exemplified by \(\varphi\) in the above analysis.
We should also recognise that there are other household types that do not fit into our characterisation of the family life cycle, such as single parent and single person households, childless couples, households having members with disabilities and households with all members unemployed. Since these differ in terms of observable characteristics they can be “tagged”Footnote 34 and made the subjects of policy analysis in a straightforward way.
In line with this discussion, we take the data for our discussion of Australian tax/transfer policy in the next two sections from a sample of households with at least one employed adult together with young children. The reason for this choice is the importance of this phase for the subsequent life cycle behaviour of the household. As shown in Apps and Rees (2009), not only does the existence of this phase contradict the standard assumption of a smooth “hump-shaped” time path of household consumption, but also the decisions on the second earner’s labour supply made in this phase affect the subsequent path of her labour supply over the remainder of the lifecycle. It can therefore be argued that tax/transfer policy toward households in this phase is of particular importance.
3 Welfare measures and tax/transfer policy
For tax/transfer policy analysis the message of the models in the previous section is that the wellbeing of households depends on market wage rates (net of tax), productivities in household production and the prices of bought-in inputs. The effects of variation across households are reasonably clearcut. In the setting of two-earner households, as we move through the equilibrium household allocations wellbeing increases with wage rates and productivities in home production and decreases with input prices. Joint market earnings are an unreliable proxy for these and, other things equal, actually vary inversely with household production. As we have emphasised, the value of this is effectively set to zero by standard equivalisation methods. Therefore these can be grossly misleading. The fact that they are so easy to apply in empirical work has worked against awareness of the need for better measures based on real data.
We have also argued for data disaggregation as an alternative to applying the equivalisation procedure to demonstrably very heterogeneous households, at least for tax/transfer policy analysis, since the procedure serves to conceal differences in characteristics that are important for this purpose. For that reason, in what follows we draw on data for a sample of “in-work” couple income units,Footnote 35 and for most of the analysis take a subset of this that controls for demographic variation by limiting the sample to families with two dependent children under 15 years.Footnote 36
The main problem in applying directly the results of the theoretical models is the lack of data that allows calculation of the value to the household of the goods and services it produces. Time use data does not resolve this problem because that supplies only inputs and not outputs. On the other hand, we do have readily available data on primary earner income and, since hours of work of primary earners are relatively uniform we can take this as interchangeable with the primary earner’s wage. Figure 2 below shows that there is a strong relationship between the primary earner wage and the average family’s second earner wage, with the difference in fact being rather small over the range with which we are most concerned.Footnote 37 Moreover, it seems reasonable to assume that productivities in household production, which depend on both the human and the physical capital households possess, would be increasing with primary earner income. Thus, admittedly as a second best, in what follows we take primary income as a reasonable approximation to the desired measure of household wellbeing on which to base rankings of households.Footnote 38 We then highlight the distortions that are created by using joint equivalised incomes as an alternative ranking measure.
Our main contention is that these distortions support tax/transfer policies that yield unfair and inefficient outcomes. Taking joint income as the measure of how well off people are supports a policy that taxes households with higher joint income more heavily even when they are actually worse off than households lower down in this ranking. For an entire economy this can result in an income tax system that is both less fair and less efficient than one based on individual incomes.Footnote 39 Means-testing or “targeting” child benefits with a system that withdraws the benefit over a range of low to middle incomes as a function of joint income effectively raises the marginal tax rate on second earners whose incomes place the household in that range, and therefore creates work disincentives at the margin far higher than those that face households with joint incomes above the level at which the benefit is fully withdrawn. The remainder of this paper uses Australian data to support these arguments.
Section 3.1 begins by comparing participation rate profiles across quintiles of primary income and quintiles of equivalised household income calculated according to the Oxford modified scale. Since all records have two children under 15 years, we have for each adult: equivalised income = household income/2.1. The results show a dramatic re-ranking of households when we switch from primary to equivalised income as the ranking variable: single earner households are made to look much worse off across equivalised income due to the implicit assumption that the value of household production is zero. Section 3.2 goes on to highlight the change in the distribution of households according to primary and second incomes by reporting results for two subsets of families defined according to the midpoint of second earner hours within each quintile of the income ranking variable.
3.1 Participation rates across primary and equivalised incomes
Table 1 presents quintile data means of primary and second earner incomes and participation rates across primary income. Participation rates are defined as: non-participants (0 h), part-time (1–34 h) and full-time (35+). Overall, 27% are non-participants, 45% are working part-time and 28% are in full-time work.Footnote 40 Table 2 presents quintile data means of primary and second earner incomes and participation rates across equivalised income.
Two important features of the data are evident in Table 1. First, the high degree of heterogeneity in the overall profile of participation rates, and therefore in second earner labour supply, is closely replicated within each primary income quintile. Second, the mean of primary income tends to rise relatively slowly across the first four quintiles but doubles in quintile 5, a reflection of the now widely recognised high incomes of those in the “top” percentiles.
These two features of the data drive the dramatic re-ranking of households when we switch to equivalised income as the ranking variable. This is evident from the profiles of primary and second income data means and participation rates across the distribution of equivalised income in Table 2. Families with a non-participant become heavily concentrated towards quintile 1 while those with two full-time earners are shifted towards quintile 5. The percentage of single-earner households in quintile 1 rises from 29% in Table 1 to 54% in Table 2. At the same time, the percentage of two-earner families employed full-time in quintile 5 rises from 26% in Table 1 to 41% in Table 2.
Also evident in the comparison of the quintile distributions in the two tables is the compression in the distribution of primary incomes as we go from Table 1 to Table 2: the ratio of income in the top quintile to that in the bottom is nearly 20% larger in Table 1 than in Table 2, so that the re-ranking of households in Table 2 gives a more benign impression of the inequality in incomes across individual primary earners than is evident in Table 1. The Gini coefficient for the primary income distribution in Table 1 is 0.330 and that for the distribution in Table 2 is 0.310.
3.2 Household subsets defined on second earner hours of work
The re-ranking of families when we switch from primary to equivalised income as the ranking variable also generates large changes in the distribution of primary and second incomes, as we would expect. To illustrate this outcome, which is central to the analysis of tax policy to follow, we first split the records in each quintile of primary income in Table 1 into two subsamples, labelled H1 and H2, at the 50th percentile of 2nd hoursFootnote 41:
-
H1 households: Second earner is working at or below the 50th percentile.
-
H2 households: Second earner is working above the 50th percentile.
Next, we split the records in each quintile of equivalised income in Table 2 into two subsamples, labelled E1 and E2, at the 50th percentile of 2nd hours:
-
E1 households: Second earner is working at or below the 50th percentile.
-
E2 households: Second earner working above the 50th percentile.
Table 3 reports H1 and H2 primary and second income data means across quintiles of primary income. The primary incomes of the two subsamples are almost equal up to the 5th quintile, with the latter reflecting the greater tendency for primary earners in the very top percentiles to have a partner who is a non-participant or in part-time work. The gap between the H1 and H2 second incomes within each quintile reflects the variation in second earner hours of market work associated with participation rates.
Table 4 presents the data means of primary and second incomes across quintiles of equivalised income for the two subsets of families, E1 and E2, defined again according to the midpoint of second hours. The dramatic change in the distribution of quintile data means for primary and second incomes across Tables 3 and 4 reflects the re-ranking of households according to the second partner’s hours of work and, in turn, her market income. For example, the H1 mean second income in quintile 1 of primary income is $10,887. This figure falls to $412 for the E1 mean second income in quintile 1 of equivalised income. Instead of closely equal primary incomes, as in Table 3, families with a second earner working fewer hours are shifted towards the lower quintiles and those working longer hours towards the top. Thus we have a greater concentration of households with higher primary incomes but lower second hours and incomes in quintile 1, while those with lower primary incomes but higher second hours and incomes are shifted towards quintile 5.
The overall result is that the percentage of H1 families in quintile 1 rises from 50% in Table 3 to 76% in Table 4. Only 24% of H2 families remain in quintile 1. In quintile 5 the percentage of H1 families falls from 50% in Table 3 to 28% in Table 4. The vast majority of families in quintile 5, 72%, have a second earner working full time or close to full time. Figure 1 illustrates graphically the redistribution of H1 and H2 households when we switch from primary income to equivalised household income as the welfare ranking variable.

Quintile distribution of H1 and H2 households
The preceding analysis serves to highlight further the role of the relatively flat profile of primary incomes towards the 5th quintile in driving a strong re-ordering of families when we switch from primary to equivalised household income as the ranking variable. When there is little variation in primary incomes below the top percentiles, a single income family in quintile 1 of an equivalised household income ranking can be shifted to quintile 4 when the second partner switches from home production to full time market work for close to the same income as her partner. Consequently, the family can be misrepresented as “upper middle income” and justifiably taxed accordingly, as the following analysis of the Australian income tax system illustrates.
4 Individual vs. joint taxation
The Australian family tax system provides an especially useful case study on which to base an analysis of individual vs. joint taxation, containing as it does elements of both. The system combines the Australian individual based income tax with a family payment system, labelled Family Tax Benefit - Part A (FTB-A), which withdraws the payments on the basis of joint income.Footnote 42 The rate scale under the individual based income tax system is set by the Personal Income Tax (PIT) rate scale in combination with the Low Income Tax Offset (LITO). The PIT rate scale is strictly progressive but when combined with the LITO is no longer so, as shown below. FTB-A was introduced under the Howard Government’s tax reforms of 2000 as part of a longer term agenda of shifting towards joint taxation with much less progressivity in the marginal tax rate scale on individual incomes,Footnote 43 together with the complete elimination of the earlier non-means tested “family allowance” per child.
Such reforms clearly change the effective tax parameters faced by each taxpayer, whether actual or potential. Under a piecewise-linear multiple-bracket income tax system with varying marginal tax rates, each individual faces just two tax parameters: an effective marginal rate and an effective lump sum,Footnote 44 where the latter is the lump sum payment (if any) plus the positive (negative) “intra-marginal lump sum”Footnote 45 associated with lower (higher) MTRs across preceding income tax brackets. The effective marginal rate is the formal rate plus the rate at which the lump sum payments, such as child benefits, are withdrawn. The key point is that “income targeting” a family payment or benefit, on either an individual or joint basis, does not end the payment of an effective lump sum. The immediate impact is a change in the marginal rate scale, typically making it not only less progressive but also no longer strictly progressive, if it raises the effective tax rate in lower brackets above the marginal tax rate in higher tax brackets in which the benefit has been fully withdrawn.Footnote 46 Switching to income testing of family payments based on joint income in a previously individual income-based income tax system changes the tax base of the system from individual to joint income across the withdrawal range of the benefits.
Support for targeting benefits typically draws on the argument that it is necessary to avoid making transfer payments to well-off households - so-called “middle class welfare” - and that it leads to a more efficient use of tax revenue. In the case of income targeting on the basis of joint income, the outcome cannot be an increase in economic efficiency. A higher tax rate on the second income cannot achieve efficiency gains given the evidence that second earner labour supply elasticities are significantly higher than those of prime age males in full employment, and there is no evidence that labour supply elasticities increase across the primary earner wage distribution.Footnote 47 In the model set out in Sect. 2, higher second earner labour supply elasticities can be explained by a high elasticity of substitution between home production and market work, which arises when there is a high degree of substitutability between domestic and market inputs, as in the case of home and bought in childcare.Footnote 48
It could, of course, be argued that the efficiency loss associated with higher MTRs on second incomes can be avoided, or at least minimised, by basing the withdrawal rate on primary earner income.
This highlights what can be seen as a key driver of support for income testing benefits: higher marginal rates across middle incomes combined with lower top rates implying a shift to a much less progressive income tax system. We question therefore whether targeting on the basis of either individual or joint incomes can be supported in terms of fairness. To provide an answer we draw on the larger data set containing 5481 records for “in work” couples selected on the criteria listed in Sect. 3.
Figure 2 plots the percentile distribution of the primary earner wage and the average second earner wage within each primary wage percentile. The primary wage in each percentile is calculated as average gross earnings, with hours smoothed across the distribution.Footnote 49 The second earner profile is calculated as the average second earner wage at each primary wage percentile.Footnote 50

Percentile primary and average second wage distributions
Consistent with the profile of primary income data means in Table 1 for couples with two dependent children under 15, the percentile distribution of the primary earner wage rate is quite flat and virtually linear up to the 80th percentile, but then rises sharply. The degree of inequality between the top percentiles and the rest of the primary earner wage distribution is large, and far outweighs the degree of inequality between primary and average second earner wages. These observations suggest that a far more equitable outcome would be achieved by raising top tax rates rather than the rates on low and middle wage earners.
Against this, it could be argued that raising tax rates on top incomes would cause higher efficiency losses. However, this objection is not supported empirically. In contrast to the wage profiles in Fig. 2, hours profiles are relatively flat from around the 20th percentile. Consequently, primary earner wage elasticities are found to approach zero towards the top percentiles.Footnote 51
We now turn to an analysis of the Australian family income tax system to show how using equivalised income as a measure of inequality can support the policy shift just outlined. Section 4.1 focuses on the individual based income tax under the PIT+LITO rate scale, while Sect. 4.2 identifies the effects of combining a family payment system, FBT-A, targeted on joint income, with the PIT+LITO.
4.1 Australian individual based income tax
The strictly progressive 2015-16 PIT rate scale contained 5 annual taxable income brackets with marginal rates rising from zero up to $18,200 followed by 19% from $18,201 to $37,000, 32.5% from $37,001 to $80,000, 37% from 80,001 to $180,000 and, thereafter, to 45% beyond the upper limit of $180,000 of the 4th bracket. The MTR and ATR profiles of the scale across taxable income is shown graphically in Fig. 3.
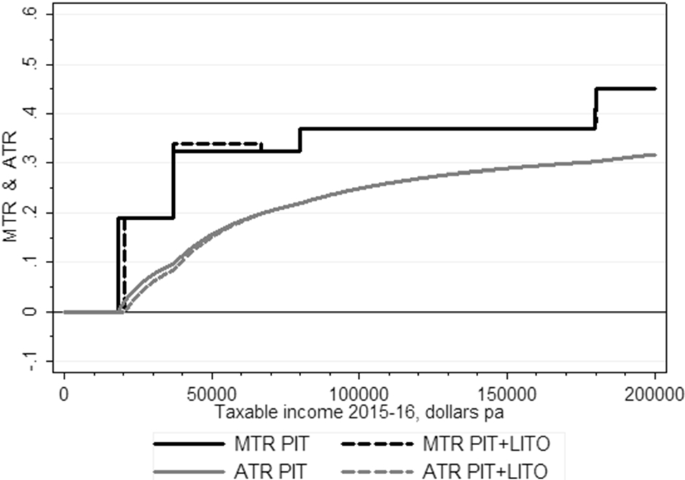
MTRs & ATRs of PIT & PIT+LITO
As noted previously, the PIT scale is not the true or “effective” rate scale of Australia’s individual based income tax. To obtain the effective rate scale we need to include the 2015-16 LITO of $445, withdrawn at a rate of 1.5% at an income above $37,000. Introducing the LITO results in two changes to the MTR scale, as indicated by the dashed grey profile for the MTR PIT+LITO in Fig. 3. First, the LITO raises the zero rated threshold from $18,200 to $20,542. Second, the LITO splits bracket 3 into two brackets, $37,001–$66,666 and $66,667–$80,000, with MTRs of 34% and 32.5%, respectively. Thus, the true MTR scale is no longer strictly progressive. The effect of the LITO, as indicated by the ATR profile for the PIT+LITO in Fig. 3, is to raise MTRs to eliminate the lump sum gain from the higher zero rated threshold at the relatively low income level of $66,666, as an alternative to raising rates at higher income levels that would make the system more progressive overall.
While a LITO of $445 has relatively little impact, it is important to note that it has been far larger in previous years. In 2011–12, for example, a LITO of $1500 was withdrawn at 4 cents in the dollar above $30,000. The effect was to raise the zero-rated threshold at that time from $6000 to $16,000 and to replace the 15% MTR that applied to taxable incomes from $30,000 to $37,000 with a rate of 19%. And as we see above, by 2015–2016 the zero-rated threshold had risen to $20,542 and the 19% rate applied across the entire second taxable income bracket. A higher zero-rated threshold together with large shifts in the bracket limit for the top tax rate over recent decadesFootnote 52 are typically supported as a response to “bracket creep”. However, when combined with higher effective MTRs across low to middle incomes, made non-transparent by adjustments to a LITO, this direction of reform undermines the overall progressivity of the Australian income tax and shifts the tax burden disproportionately towards low to middle wage earners.
In the analysis to follow we show that these outcomes of a less progressive income tax are evident when tax burdens are compared across primary incomes but are concealed when we switch to equivalised income as the ranking variable. We draw on the dataset containing 1055 records for “in-work” families with two children under 15 years and present results for subsamples defined according to the median of second hours across each income ranking variable.
Table 5 reports H1 and H2 income tax payments on primary and second incomes across quintiles of primary income under the PIT+LITO rate scale. Taxes on H1 and H2 primary incomes are closely matching across quintiles 1 to 4 because their incomes, reported in Table 3, are almost equal. In contrast there is a large gap between the taxes on H1 and H2 second earners’ incomes, as we would expect given that the H1 second earner specialises in untaxed home production and her H2 counterpart, in taxed market work. Across quintiles 1 to 4 the gap between second earner income taxes is around 30% to 40%. The very small gap, at around 4%, in quintile 5 reflects the sharp rise in top percentile primary incomes and, as noted above, the tendency for those at the very top to be single-income. Figure 4 compares the quintile distribution of H1 and H2 total income tax payments across primary income.
Table 6 compares E1 and E2 primary and second earner tax payments across households ranked by equivalised income. In contrast to the distribution of H1 and H2 total tax burdens across primary income, E1 households are found to be taxed more heavily than E2 households within each quintile of equivalised incomes. This is shown in Fig. 5. The result reflects the higher primary incomes of E1 households and, in turn, the higher tax they pay in each quintile. While average E1 second incomes are lower than those of E2 households, the difference is not sufficient to alter the result. Thus, switching from primary to equivalised income as the welfare ranking variable completely reverses the finding on which household type pays more tax.

H1&H2 income tax payments

E1&E2 income tax payments
From Fig. 4 we can see that if we accept that primary income is the more reliable measure of family welfare, we obtain a result that supports a more progressive individual based income tax in order to lower the gap between H1 and H2 tax burdens, especially in the quintiles 2–4. Ideally, when home and market work are close substitutes, H1 and H2 tax burdens at a given primary income would be equal or, at the very least, more closely matching than Fig. 4 suggests. While this ideal is unattainable in the short run, the gap can be reduced by returning towards a more progressive, and strictly progressive, PIT rate scale. A more progressive PIT scale would, by reducing the overall degree of inequality, shift the tax burden from lower income second earners towards higher income primary earners and would at the same time therefore reduce the net-of-tax gender pay gap. Lower taxes on second incomes can also be expected to achieve efficiency gains, together with a growth in the tax base, when home and market production are close substitutes for families with dependent children.
In contrast, Fig. 5 supports progressive joint taxation to achieve a closer match between E1 and E2 tax burdens. These strongly conflicting findings illustrate the potential impact of alternative assumptions on the contribution of home production to family welfare. Setting that contribution to zero lends support for a progressive rate scale on joint income to achieve not only vertical equity but “horizontal equity”, mistakenly defined as the equal taxation of couples with the same joint income. When home and market produced goods and services are close substitutes and we switch from primary to equivalised incomes as the welfare ranking variable, H2 families with low to middle income earners working full time are mistakenly re-ranked towards higher quintiles of equivalised income, and H1 families with higher primary incomes but lower second hours are shifted towards the lower quintiles, as indicated in Fig. 1.
Note that the consistently higher tax on the E1 household across equivalised income in Fig. 5 is driven not only by their higher primary incomes but also by the progressivity of the PIT rate scale. This effect is accentuated in quintile 5 where the average E1 primary income is $284,008, a figure that exceeds the lower bracket limit of the top MTR of 45% by over $100,000. In contrast, the average primary income of the E2 household in quintile 5 is $194,302, which is less than $15,000 above the lower bracket limit for the top MTR.
Our core argument, therefore, is that once a realistic value is placed on home production, even if exact empirical measures of this value do not (as yet) exist, primary income provides the more accurate welfare ranking. Equivalised joint income gives misleading results for distributional outcomes when there is heterogeneity in second earner hours due to the significance of household production as a substitute for market work, especially when primary earnings are relatively flat across much of the distribution of primary income.Footnote 53 We now turn to an analysis of the effects of shifting towards joint taxation by targeting family payments on joint income.
4.2 FTB-A and the PIT+LITO
FTB-A provides a payment per dependent child that varies with the age of each child. The total payment is labelled the “Maximum Rate”. For a child under 13 years the Maximum Rate is $5412.95 and for a child aged 13–14 years, $6825.50. The total of “Maximum Rate” payments for a two-child family with one in each of these age categories is therefore $12,238.45. This total is withdrawn at a rate of 20 cents in the dollar on a joint family income above $51,027 until it falls to $2230.15 per child, an amount relabelled the “Base Rate + Supplement” per child. The total of “Base Rate + Supplement” payments is then withdrawn 30 cents in the dollar on a joint income above $94,316 until it is fully withdrawn.
Given that the Maximum Rate payment is set according to observable characteristics - the age and number of dependent children—it can be classified as a “tagged” universal payment. The withdrawal of total payments at specified rates in the dollar changes effective marginal tax rates but not the universality of the payments. Applying the withdrawal rates to joint income changes the tax base. With the shift towards joint taxation, the calculation of EMTRs changes dramatically. Under an individual based income tax, such as the PIT, the same rate scale applies separately to the taxable income of each partner. The system therefore has marginal rate independence at all income levels—an increase in one partner’s income does not affect the other’s MTR. In contrast, under a joint income tax the marginal rates faced by partners are equalised, regardless of the degree of inequality of those incomes—their tax rates exhibit positive jointness. This means, for example, that if the male partner as primary earner is fully employed, the question of whether the female partner will take a job or work longer hours depends on the change in the household’s total tax bill that results, including any effect on the male partner’s marginal tax rate of her increase in income, that is, it depends on the incremental tax burden with respect to her work decision.
To illustrate the impact of shifting towards joint taxation by combining the PIT+LITO with the FTB-A system, we first construct the EMTR and ATR profiles across primary incomes from zero to $200,000 with the second income set to zero. For this case, the withdrawal of FTB-A payments, at 20 cents in the dollar from $51,027 and at 30 cents from $94,316, increases the number of taxable income brackets under the PIT+LITO from six to ten and introduces a new EMTR scale across the 10 taxable income brackets. Figure 6 presents the EMTR and ATR profiles. For the purpose of comparison, the figure contains the profile of the PIT+LITO, represented by the dashed grey line. We can see that the withdrawal of FTB-A payments results in EMTRs that are dramatically higher across low to middle ranges of primary income and well above the rates under the PIT+LITO scale.

EMTRs and ATRs: single income family
We also observe in Fig. 6 that the ATR profile rises steeply as primary income approaches $109,183, the level at which the FTB-A payments are completely offset by the negative intramarginal lump sums associated with higher EMTRs across these bands of income. At this point the EMTR falls to the 37% rate of the PIT scale and the ATR is 26%. Thereafter, the ATR rises very slowly, reaching a rate of 32% at a primary income level of $200,000. The dramatic change in the slope of the ATR profile once the payments are fully withdrawn reflects, in effect, the policy decision to fund family payments by raising MTRs across low to middle primary incomes rather than across top incomes.Footnote 54
If all families were single income, the debate on the optimal profile of EMTRs would focus on concerns about the progressivity of the ATR profile in Fig. 6, together with the impact on labour supply. However, for the two-parent family there are more far reaching issues. When primary earnings lie within a low to average range, the second earner may not only face EMTRs that are well above the PIT+LITO rates but, in families with relatively low to average primary incomes, she may also face higher ATRs on her entire earnings.
To illustrate this, we calculate ATRs across second incomes for three levels of primary income: $52,000, $60,000 and $70,000. The ATR profiles for these cases are shown in Fig. 7. All three incomes fall either fully or partly within the taxable income brackets subject to the high withdrawal rates of FTB-A in addition to the PIT+LITO rates. Consequently, the three profiles are initially flat, at an ATR of 20%, and then rise towards a rate which can equal or exceed the 32% rate at $200,000 under the PIT scale.

ATRs on second income
For the purpose of illustration, consider the case of the family with a primary income of $60,000. The second earner faces a marginal tax rate of 20% on the first dollar earned because the family’s joint income exceeds the lower limit of $51,027 for the withdrawal of Maximum Rate payments at 20 cents in the dollar. She continues to face an MTR that is 20% above the PIT+LITO rate until her income rises to $29,918, at which point family income reaches the level at which the Maximum Rate is fully withdrawn. At this point, the second earner’s ATR is 26%. At an income of $34,316 ($94,316 - $60,000) her EMTR rises to 49 cents in the dollar and then, at an income of $37,000, to 64 cents, the sum of the PIT 32.5% rate, the 0.15% withdrawal rate of the LITO and the 30% withdrawal rate of the “Base Rate + supplement”. At $49,183 her MTR returns to that of PIT scale. Her ATR is 36%, family income is $109,183 and FTB-A payments, net of losses due to targeting, have fallen to zero.
From Fig. 7 it is evident that across low to average primary incomes the ATR on the second income is far higher than under the PIT+LITO alone and rises significantly as the second income rises due to the withdrawal of FTB-A payments at rates of 20% and 30% on joint income.
We now investigate the overall distributional impact of family payments, calculated as the total payments of $12,238.45 net of losses due to targeting, by subtracting the payments from PIT+LITO taxes across primary incomes reported in Tables 5 and across equivalised incomes reported in Table 6.
Table 7 presents average H1 and H2 FTB-A payments across quintile of primary income. Figure 8 shows the resulting distribution of H1 and H2 PIT+LITO income taxes, net of FTB-A payments, within each quintile of primary income. Table 8 reports average E1 and E2 FTB-A payments across quintiles of equivalised income. The resulting distribution of E1 and E2 income taxes, net of FTB-A, within each quintile is shown in Fig. 9.

H1&H2 Income tax - FTB-A

E1&E2 Income tax - FTB-A
The results strongly conflict. As we would expect, joint income targeting concentrates the payments towards the lower quintiles across both rankings, an outcome that might be viewed superficially as a gain in equity. However, across the primary income ranking the losses from targeting are significantly greater for the H2 household up to about the top quintile. Consequently the gaps between H1 and H2 PIT+LITO tax burdens, shown graphically in Fig. 4, become wider across quintiles 1 to 4 when we include FTB-A payments. This outcome is evident in Fig. 8. In contrast, according to the equivalised income ranking in Table 9, family payments are closely matching. This result supports the erroneous view that joint income targeted family payments contribute to both vertical and horizontal equity.
To sum up: The conflict between the results highlights the importance of basing an analysis of family tax/transfer policy on a model that recognises household production as a substitute for market work. When the second earner in a low to average primary income household switches from untaxed home production to market work, she can face excessively high EMTRs and, in turn, ATRs as illustrated in Fig. 7, an outcome that conflicts with both vertical and horizontal equity. In contrast, the classification of households as E1 or E2 is based on splitting equivalised income equally between partners under the assumption that the second earner makes no additional contribution to the family’s standard of living. This results in H2 households with low to average primary incomes being shifted from the 1st or 2nd quintiles towards the 3rd or 4th quintiles of equivalised income, as reflected in Fig. 1. We are then supposed to believe that their greater loss of FTB-A payments and higher overall levels of total income taxation can be justified in terms of both vertical and horizontal fairness.
Given the high degree of heterogeneity in second earner labour supplies and, therefore, in market work vs. home production, we require a tax system which narrows the gap between H1 and H2 tax burdens within each quintile of primary income. As discussed previously, this outcome can be achieved by increasing the progressivity of the MTR scale on individual incomes. A more progressive individual based income tax, by reducing tax rates on lower income earners, can also be expected to reduce the net-of-tax gender pay gap and, in turn, achieve efficiency gains when home and market work are close substitutes.
5 Conclusions
In this paper we have presented a critique of the standard methods of using equivalence scales to make across-household welfare comparisons. The basis of this critique is the argument that they produce misleading results in support of tax/transfer policies which disadvantage low to middle income households and the second earners in those households, who are predominantly women. In particular they supply arguments in favour of joint taxation and the withdrawal of child benefits on the basis of joint income, which make working mothers, as second earners, significantly worse off and so create disincentives to female labour force participation.
More constructively, we have proposed alternatives with more relevance to the analysis of public policies, particularly those relating to taxes and transfers. From a theoretical point of view, we should develop measures based on indirect utility or expenditure functions defined on truly exogenous variables that define the household types, and which reflect significant differences in the preference structures and constraints that different households face.Footnote 55 But disaggregation is also important. In particular we should distinguish between groups of households in different stages of the family life cycle, as well as those with particular characteristics that are amenable to being tagged. To impose homogeneity in the measurement of well-being across all such groups by an equivalisation procedure obscures important issues, such as the trade-offs that tax/transfer policy has to make between these groups of households.
We fully recognise that such disaggregation requires datasets that are currently not available, though this is at least in part due to the crowding-out effect of the routine procedures offered by the standard measures based upon equivalised household incomes. As an interim solution we propose, for family households in which household production is a significant form of time use, primary earner income as a better, readily available measure of household well-being. A large part of the paper has been devoted to making the argument, in the concrete policy setting of the Australian family tax system, that this is a less distortionary basis for household welfare rankings and public policy more generally than standard equivalence scales.
It appears to be the case that the gender wage gap in terms of pre-tax/transfer wage rates has improved somewhat over the past few decades, but unfortunately, inappropriate policies supported by an overly simplistic economic methodology have had at least to some extent a countervailing effect on net wage rates, which are after all more fundamental determinants of household well-being than household income, which we have shown to be a poor indicator.Footnote 56
Notes
See Apps and Rees (2001) for a different approach to estimating child costs.
This assumption has been widely criticised in the family economics literature. See for example Lise and Saetz (2011), who show using UK data that within-household equality is rejected.
Report of the Australian Productivity Commission (2018).
In a companion paper to this, Apps and Rees (2018), we show that an optimal individual income-based tax system is superior on grounds of both equity and efficiency to an optimal system based on joint income, for a population of family households with young children. See also Apps and Rees (2022) for a survey of the literature on this issue.
This is the list of exogenously given household characteristics that can cause two households with the same total incomes and preferences to choose different consumption bundles and time allocations. Important components of these vectors are wage rates. They may also include some prices which vary across households, for example those of bought in goods, such as child care. Attanasio et al. (2008) use child care prices to explain across-cohort variation in female labor supply in the US.
This may not always be appropriate terminology. Food, for example, does not have the properties of non-rivalry and non-excludability that characterise pure public goods, but does not seem to be perceived or recorded by households as assignable. The evidence for this is provided by the few, valuable studies that have been able to obtain datasets on within-household consumption allocations. See for example Bonke and Browning (2009), Browning and Gørtz (2012), (for Denmark), Cheryche et al. (2012) (for the Netherlands) and Lise and Yamada (2019) (for Japan).
The fact for example that one can be looking after a small child as well as carrying out other household tasks is often ignored in time use studies. Most report only one time use for each activity episode. An exception is the Australian 2005–06 Time Use Survey which reports two activities for each activity episode. More recent US surveys report if a child is present which allows, to some extent, misleadingly low estimates of the time a household spends on child care to be avoided. Nevertheless this still may mean that the value of household production is considerably understated if only part of the output of a given time segment is recorded.
Although the basis for the critique was the problem of empirical estimation in the absence of the required data rather than any conceptual difficulty in modelling joint production, since this is a well-known topic in microeconomics.
These stem from Apps (1982), where the gender wage gap is seen to be the result of labour market discrimination. This has the effect of crowding women into lower wage occupations. This then creates inequality in the within-household allocation of time use and consumption.
In intertemporal models it is also necessary to take into account issues of commitment to implement ex post the ex ante efficient decisions. See Lise and Yamada (2019) for a thorough discussion of this in the context of a comprehensive panel dataset that includes data on within-household consumption allocations.
In particular Becker (1965, 1981), Gronau (1977, 1980, 1986) , Apps (1982), Apps and Rees (1988, 1996, 1997, 1999b) and Chiappori (1997). In macroeconomics there has long been a strand of literature that stresses the importance of household production. See Doepke and Tertilt (2016) for a recent survey.
See Del Boca and Flinn (2012).
See McClelland et al. (2014) for recent work on labour supply elasticities by role and gender.
As pointed out in Apps and Rees (1988), this would not hold if we wanted to carry out the comparative statics analysis of the model, to derive restrictions on demand functions for example. In that case we would require a household welfare function.
These wage rates of course vary across households but because we do not really need the household subscript we leave it out. They could also be thought of as net of tax wage rates with the marginal tax rates those that prevail at the household equilibrium.
Realistically of course the variables x, z, g and b should be defined as vectors, but we prefer to keep notation as simple as possible.
This is primarily for simplicity. Including nonconvexities would be an interesting technical exercise but would not contribute significantly to the main aims of this paper.
This assumption is typically made in analyses of tax/transfer policy, since it avoids having to deal with the difficult issue of interpersonal comparisons of utility, and is of course also implicit in the construction of equivalence scales.
Set out in full in the Appendix A1.
By assuming a specific household welfare function we can use these indirect utility functions, or their associated expenditure functions, in tax/transfer policy analysis. See for example Apps and Rees (2009, 2022) where this is extensively discussed. Browning et al. (2013) use a collective model to derive family equivalence scales from this approach, but exclude household production and assume that individual preference orderings remain unchanged when a couple household is formed, whatever the subsequent family circumstances.
Individual utilities can be aggregated to give “household utilities” in two ways. We can put them into a household welfare function (such as the weighted utilitarian function of the collective model) to give the household’s own measure of its total utility; or they can be put into a social welfare function to give the “planner’s” measure of household utility. Where these two functions differ [the case called “dissonance” in Apps and Rees (1988)] there is then an argument that policy formulation should take account of this. For example, transfers could be targeted to specific family members [see Lundberg et al. (1997)].
Recalling that even with identical utility functions the individuals may not in general derive the same utility from the given amount of the non-assigned good g if their allocations of the other goods differ. Recall also that g may not be a truly “public” household good.
Because information on individual within-household consumptions is collected only in a very few countries, there is a very large and ingenious literature on estimating the “household sharing rule”, which transforms total into individual consumptions. For the general theory of sharing rules, first introduced in Samuelson (1956), see Mas-Colell et al. (1995) ch.4.
See Appendix A2. This requires simply adding a non-negativity constraint on the second earner’s market labour supply to the above model. The non-participation result is then derived as a corner solution with \(L_{2}=0\) while \(l_{2},t_{2}>0.\)
See Aguiar and Hurst (2013), who provide evidence that the factors “driving life cycle consumption either are inputs into market work or are amenable to home production”. In particular the “puzzle” of why retired couples’ expenditures on market goods fall to an extent that cannot be adequately explained by standard life cycle models is due to the fact that they have much more time to spend on shopping and home production of substitutes for market goods.
See Apps and Rees (2011), Ch 3, for an analysis of time use and incomes based on a lifecycle model defined on these five phases.
For further discussion of “tagged” payments, see Sect. 4.2.
This is selected from the Australian Bureau of Statistics (ABS) 2015–2016 Survey of Income and Housing. The sample is selected on the criteria that the primary earner is aged from 20 to 64 years, earns a minimum of $12/hour and works for at least 30 h per week. It contains 5481 records.
This sample contains 1055 records.
Recall that this does not correspond exactly to the “gender wage gap” since our definition of “primary” and “second” is based on role and not gender.
An alternative argument is suggested by the empirical work in Andrienko et al. (2015). Given a primary income, we add, for each second earner in the corresponding households, the value of their market income to the value of their household production (found by using time use data to multiply hours in household work by an estimated wage rate), and subtract expenditure on bought in child care and other substitutes for household production. Then, the resulting values of “household GDP” are approximately equal across these households, while increasing with the primary earner income. Even if not perfect, we would argue that any possible error would be much smaller and less biased than that which results from setting the value of household production to zero, as is done by the equivalisation procedure. Even if, because of variations in productivities and prices, the heterogeneity in second earner labour supply is large, the variance in “household GDP” is actually quite small at any given primary income level.
Apps and Rees (1999a) show, using a tax reform approach, that replacing joint by individual taxation shifts the overall tax burden away from low-to-middle income households to higher income households with a low second earner participation rate. This is because second earners now face lower and primary earners higher marginal tax rates. Then, the higher the second earner income, the more likely it is that the household gains overall. If household production is ignored this could be seen as creating horizontal inequities, but in fact it is a means of indirectly taxing household production. Furthermore, because of higher second earner elasticities, aggregate income increases, so that gainers could compensate losers. See also LaLumia (2008). Apps and Rees (2018) is based on a comparison of an optimal joint with an optimal individual tax system which reaches a similar conclusion, in an economy with progressive piecewise linear taxation.
The system also includes Family Tax Benefit Part B and the Medicare Levy. These are omitted here in order to focus on the implications of combining an individual based income tax with joint income targeted family payments.
Reforms prior to 2000 included large cuts in top marginal tax rates and, post 2000, upward shifts in the bracket limits to which the top rate applied. As an example of the latter, from 2004–05 to 2008–09, the bracket limit at which the top marginal tax rate applied rose from $70,000 to $180,000.
The “intra-marginal lump sum” is calculated by subtracting the amount of tax actually paid from the amount that would be payable had the individual’s total income been taxed at the marginal rate applying to her/his last dollar, and may be positive or negative depending on the progressivity/regressivity of preceding MTRs. The effective lump sum is then obtained by adding the result to any formal lump sum, such as family payments under FTB-A. In the simplest two-bracket system with formal lump sum \(a_{1}\), marginal tax rates \(t_{1},t_{2}\) and bracket limit \(y_{1}\), the tax bill for lower rate taxpayers with income \(y\le\) \(y_{1}\) is \(t_{1}y-a_{1}\) and for higher rate taxpayers it is \(t_{2}y-a_{2}\), where \(a_{2}=a_{1}+(t_{2}-t_{1})y_{1}\) is the effective lump sum.
Moreover, in terms of the theory, this creates a budget constraint that is no longer convex, and this can have a non-marginal effect on choices of how much to work.
See McClelland et al. (2014).
As demonstrated in Apps and Rees (2018).
The Lowess method is applied to obtain a smoothed profile.
For non-participants we use predicted wage rates corrected for selectivity bias within each quintile. Recall our earlier argument that this provides only a lower bound to the marginal value product in home production of the second earner.
See Andrienko et al. (2016).
See footnote 4 for summary of relevant changes.
Note that even if all second earners made the same participation decision at each primary income, a joint income tax would still have a higher efficiency cost than individual taxation if the second earner has a higher elasticity of substitution between home and market work than the primary earner. See Apps and Rees (2018).
Note that the policy decision cannot be supported on the basis of high labour supply elasticities at top income levels. See Andrienko et al. (2016).
This is essentially a proposal for the extension of the Deaton and Muellbauer (1980) approach to take into account realistically the characteristics vectors of family households.
See for example the empirical study by Bick et al. (2019), which identifies taxation as a driving force behind developments in female labour supply over the past few decades.
This makes the model one of the “traditional household” in which the specialisation in the roles of provider of household income and provider of household goods is complete. It is easy to extend the model to the case where the primary earner may also be a non-participant, though in that case we would have to assume the household has some form of non-wage income, for example a transfer from public funds. Again, the model would imply that this would give only a lower bound to the values of time of members of the household.
If the production functions are linear homogeneous these prices are independent of outputs but if they are strictly concave then they vary with the equilibrium quantities.
References
Aguiar, M., & Hurst, E. (2013). Deconstructing life cycle expenditure. Journal of Political Economy, 121(3), 437–49.
Andrienko, Y., Apps, P., & Rees, R. (2015). Gender bias in tax systems based on household income. Annals of Economics and Statistics, 117/118, 141–155.
Andrienko, Y., Apps, P., & Rees, R. (2016). Optimal taxation and top incomes. International Tax and Public Finance, 23(6), 981–1003.
Apps, P. (1982). Institutional inequality and tax incidence. Journal of Public Economics, 18(2), 217–42.
Apps, P., Long, N. V., & Rees, R. (2014). Optimal piecewise linear income taxation. Journal of Public Economic Theory, 16(4), 523–545.
Apps, P., & Rees, R. (1988). Taxation and the household. Journal of Public Economics, 35(3), 355–69.
Apps, P., & Rees, R. (1996). Labour supply, household production and intra-family welfare distribution. Journal of Public Economics, 60(2), 199–219.
Apps, P., & Rees, R. (1997). Household production and collective labor supply. Journal of Political Economy, 105(1), 178–190.
Apps, P., & Rees, R. (1999a). On the taxation of trade within and between households. Journal of Public Economics, 73(2), 241–264.
Apps, P., & Rees, R. (1999b). Individual vs joint taxation in models with household production. Journal of Political Economy, 107(2), 1999, 393–403.
Apps, P., & Rees, R. (2001). Household production, full consumption and the costs of children. Labour Economics, 8(6), 621–48.
Apps, P., & Rees, R. (2005). Gender, time use, and public policy over the life cycle. Oxford Review of Economic Policy, 21(3), 439–461.
Apps, P., & Rees, R. (2009). Public economics and the household. Cambridge: Cambridge University Press.
Apps, P., & Rees, R. (2010). Family labor supply, taxation and saving in an imperfect capital market. Review of Economics of the Household, 8, 297–323.
Apps, P., & Rees, R. (2011). Household time use, inequality and taxation. In J. Molina (Ed.), Household Economic Behaviors. Berlin: Springer.
Apps, P., & Rees, R. (2018). Optimal family taxation and income inequality. International Tax and Public Finance, 25(5), 1093–1128.
Apps, P., & Rees, R. (2022). Family taxation. Cambridge University Press. (forthcoming).
Attanasio, O. P., Low, H., & Sanchez-Marcos, V. (2008). Explaining changes in female labour supply in a life-cycle model. American Economic Review, 98(4), 1517–1552.
Atkinson, A. (1970). On the measurement of inequality. Journal of Economic Theory, 2, 244–263.
Atkinson, A., Leventi, C., Nolan, B., Sutherland, H., & Tasseva, I. (2017). Reducing poverty and inequality through tax benefit reform and the minimum wage: The UK as a case study. Journal of Economic Inequality, 15(4), 303–323.
Becker, G. (1965). A theory of the allocation of time. Economic Journal, 75(299), 493–517.
Becker, G. (1981). A treatise on the family. Harvard University Press.
Bergstrom, T. (1997). A survey of theories of the family. In M. Rosenzweig & O. Stark (Eds.), Handbook of population and family economics (Vol. 1, Ch. 2, pp. 21–79).
Bick, A., Brueggemann, B., Fuchs-Schuendeln, N., & Paule-Paludkiewcz, H. (2019). Long-term changes in married couples’ labor supply and taxes: Evidence from the US and Europe since the 1980’s. Journal of International Economics, 118, 44–62.
Blundell, R., Chiappori, P.-A., Magnac, T., & Meghir, C. (2007). Collective labour supply: Heterogeneity and non-participation. Review of Economic Studies, 74(2), 417–45.
Bonke, J., & Browning, M. (2009). Allocation within the household: A new survey. Fiscal Studies, 30(3/4), 161–481.
Browning, M., & Gørtz, M. (2012). Spending time and money within the household. Scandinavian Journal of Economics, 114, 681–704.
Browning, M., Chiappori, P.-A., & Lewbel, R. (2013). Estimating economies of scale, adult equivalence scales and household bargaining power. Review of Economic Studies, 80, 1267–1303.
Cheryche, L., De Rock, B., & Vermeulen, F. (2012). Married with children: A collective labor supply model with detailed time use and intrahousehold expenditures information. American Economic Review, 102(7), 3377–3405.
Chiappori, P.-A. (1997). Introducing household production in collective models of labor supply. Journal of Political Economy, 105(1), 191–209.
Deaton, A., & Muellbauer, J. (1980). Economics of consumer behavior. Cambridge: Cambridge University Press.
Del Boca, D., & Flinn, C. (2012). Endogenous household interaction. Journal of Econometrics, 166, 49–65.
Doepke, M., & Tertilt, M. (2016). Families in macroeconomics. In J. Taylor & H. Uhlig (Eds.), Handbook of macroeconomics (pp. 1790–1891). Amsterdam: Elsevier.
Donni, O. (2003). Collective household labor supply: Nonparticipation and income taxation. Journal of Public Economics, 87(5–6), 1179–98.
Gronau, R. (1977). Leisure, home production and work: The theory of the allocation of time revisited. Journal of Political Economy, 85(6), 1099–1123.
Gronau, R. (1980). Home production: A forgotten industry. Review of Economics and Statistics, 62(3), 26–42.
Gronau, R. (1986). Home production: A survey. In Ashenfelter, O. & Layard, R., Handbook of Labor Economics, vol. 1, pp. 273–304.
Konrad, K., & Lommerud, K. (1995). Family policy with non-cooperative families. Scandinavian Journal of Economics, 97, 581–601.
LaLumia, S. (2008). The effects of joint taxation of married couples on labor supply and non-wage Income. Journal of Public Economics, 92(7), 1698–1791.
Lise, J., & Saetz, S. (2011). Consumption inequality and intra-household allocations. Review of Economic Studies, 78, 328–355.
Lise, & Yamada, K. (2019). Household sharing and commitment: Evidence from panel data on individual expenditures and time use. Review of Economic Studies, 86, 2184–2219.
Lundberg, S., Pollak, R. A., & Wales, T. J. (1997). Do husbands and wives pool resources? Evidence from the United Kingdom child benefit. Journal of Human Resources, 32, 463–80.
Mas-Colell, A., Whinston, M. D., & Green, J. R. (1995). Microeconomic theory. Oxford: Oxford University Press.
McClelland, R., Mok, S. & Pierce, K. Labor force participation elasticities of women and secondary earners within married couples. In Working Paper 2014-06. Congressional Budget Office.
OECD. (2019). Under pressure: The squeezed middle class. Paris: OECD Publishing.
Productivity Commission (2018). Rising inequality? A stocktake of the evidence. Productivity Commission Report, Productivity Commision, Australia.
Pollak, R., & Wales, T. (1979). Welfare comparisons and equivalence scales. American Economic Review, 69, 316–21.
Pollak, R., & Wachter, M. (1975). The relevance of the household production function and its implications for the allocation of time. Journal of Political Economy, 68, 349–59.
Samuelson, P. A. (1956). Social indifference curves. Quarterly Journal of Economics, 70, 1–22.
Sila, U., & Dugain, V. (2019). Income, wealth and earnings inequality in Australia: Evidence from the Hilda survey. WP No. 1538. Economics Department, OECD, Paris.
Ulph, D. (1988). A general non-cooperative Nash model of household consumption behaviour. WP 88-205, University of Bristol.
Vermeulen, F. (2005). And the winner is... an empirical evaluation of unitary and collective labour supply models. Empirical Economics, 30, 711–734.
Vermeulen, F. (2006). A collective model for female labour supply with non-participation and taxation. Journal of Population Economics, 19, 99–118.
Acknowledgements
We are grateful to the editor and two referees whose comments led to significant improvements on an earlier draft of this paper. The usual disclaimer applies.
Author information
Authors and Affiliations
Corresponding author
Additional information
Publisher's Note
Springer Nature remains neutral with regard to jurisdictional claims in published maps and institutional affiliations.
Appendix
Appendix
A1 Two-earner households
The Lagrange function for the household’s problem is:
with production functions: \(f^{z}(k_{1z}t_{1z},k_{2z}t_{2z},q_{z}b_{z});\) \(f^{g}(k_{1g}t_{1g},k_{2g}t_{2g},q_{g}b_{g}).\) We make the standard assumptions: all functions are continuously differentiable; utility functions are strictly quasiconcave, production functions are concave; the constraint functions define a non-empty convex set; the constraint qualification holds; and all endogenous variables are strictly positive at the optimum.
The FOCs yield:
where \(\pi _{z}^{*},\pi _{g}^{*}\) are implicit prices of the household goods at the optimum. Note that defining marginal value products as \(\pi _{j}f_{ij}^{j}k_{ij},\pi _{j}f_{3j}^{j}q_{j},\) \(i=1,2,\) \(j\in \{z,g\},\) we have that at the optimum these are equated to the respective input prices \(w_{i},p\) as is required for Pareto efficiency.
Note that given the assumptions of the model, and that we know the values of the implicit prices \(\pi _{z}^{*},\pi _{g}^{*},\) we could alternatively solve for the endogenous variables from the problem:
which is a perfectly standard consumer problem. So we can derive the demands for the goods as functions of the exogenous variables and from those expenditure and indirect utility functions can be defined. However some theory of the determination of \(u_{2}^{0}\) is required to place restrictions on these functions, such as the properties of the Slutsky matrix. In other words we would need a theory of the household that specifies the properties of the objective function \(u_{1}+\phi (u_{2}-u_{2}^{0}).\)
A2 Single earner households
The production functions, which we again assume concave, now become:
We also assume for simplicity that the primary earner works only in the market and so supplies no time to household production.Footnote 57 The Lagrange function of the Pareto efficiency problem is now:
with the added non-negativity constraint \(L_{2}\ge 0\) . From the first order conditions we have:
We have \({\hat{\pi }}_{j}\equiv\) \(\mu _{j}/\lambda\) as the implicit price of the household good \(j\in \{z,g\}\) in units of consumption.Footnote 58 In the complementary slackness condition (21) we have the solution possibilities:
Thus from (22)–(24) we have the result:
The market wage rate is a lower bound for the single earner household’s marginal opportunity cost of the second earner’s time, \(\hat{w} _{2}.\)
In the case where there is joint production, for example in the case where the second earner labour supply \(L_{2}\ge 0,\) we could simply write the production functions as
in which case we would obtain the condition:
where \(\hat{w}_{2}=w_{2}\) holds if \(L_{2}>0.\) Even in this case however, since \(w_{2}\) is equal to the sum of marginal value products, diminishing marginal productivity would imply that \(w_{2}t\) would still be an underestimate of the total value of household production.
Rights and permissions
Open Access This article is licensed under a Creative Commons Attribution 4.0 International License, which permits use, sharing, adaptation, distribution and reproduction in any medium or format, as long as you give appropriate credit to the original author(s) and the source, provide a link to the Creative Commons licence, and indicate if changes were made. The images or other third party material in this article are included in the article's Creative Commons licence, unless indicated otherwise in a credit line to the material. If material is not included in the article's Creative Commons licence and your intended use is not permitted by statutory regulation or exceeds the permitted use, you will need to obtain permission directly from the copyright holder. To view a copy of this licence, visit http://creativecommons.org/licenses/by/4.0/.
About this article

Cite this article
Apps, P., Rees, R. Inequality measurement and tax/transfer policy. Int Tax Public Finance 29, 953–984 (2022). https://doi.org/10.1007/s10797-021-09695-w
Accepted:
Published:
Issue Date:
DOI: https://doi.org/10.1007/s10797-021-09695-w