
Abstract
Soil moisture can be an effective climate prediction signal due to its long memory. This study investigated seasonal persistence of soil moisture anomalies from the preceding autumn to spring dominated by the soil freeze–thaw (FT) process over the Tibetan Plateau (TP), and their relationship with summer precipitation in eastern China. Results demonstrated that soil moisture anomalies from the preceding autumn can persist until spring by water storage effect of the soil FT process. Soil moisture in the TP during the preceding autumn and winter had similar climatic effects as spring soil moisture. Positive soil moisture anomalies in the eastern TP during the spring led to less summer precipitation in south China and the Yellow River basin, and more summer precipitation in the Yangtze River basin and northeast China. A possible mechanism for this was that wetter soil moisture anomalies from the preceding autumn were stored in the soil by soil freezing, and were released with soil thawing in the spring, inducing surface diabatic heating anomalies over the TP. These anomalies then persisted into summer and enhanced the TP’s thermal forcing to the subtropical westerlies and affected stationary Rossby wave train propagation in middle latitudes, particularly on the northwest and northeast sides of the TP. This study suggests that most of spring soil moisture anomalies signal contains the preceding two seasons’ soil moisture anomalies information; therefore, summer precipitation predicting signals can be obtained from soil moisture anomalies from the preceding autumn, which could lengthen the seasonal climate prediction period.
1 Introduction
Seasonal climate prediction is a challenging issue, in which finding a robust signal connected with precipitation or temperature variability on seasonal scale is crucial. Sea surface temperature anomalies as currently the most significant signal (e.g., the El Niño/La Niña phenomena) widely used for climate prediction (e.g., Ropelewski and Halpert 1987; Wang and Eltahir 1999; Wang et al. 2000; Zhang et al. 1999; Dai and Wigley 2000). Other factors such as soil moisture (e.g., Fischer et al. 2007; Koster et al. 2003, 2004; Seneviratne et al. 2006; Conil et al. 2007; May et al. 2017; Ardilouze et al. 2018) and snow cover/depth (e.g., Blanford 1884; Chen 1997; Wu and Qian 2003; Ding et al. 2010; Wang et al. 2017; Yang et al. 2017; Diro et al. 2017), have received much attentions. Studies suggested that sea surface temperature has a much smaller effect than soil moisture on predicting precipitation over mid-latitude land (Koster and Suarez 1995; Conil et al. 2007; Yang et al. 2016). Soil moisture affects the weather and the climate (e.g., Koster et al. 2004; Diro and Sushama 2017) through its effects on land surface energy balance and the water cycle (Seneviratne et al. 2010). Soil moisture varies slowly relative to atmospheric elements, with soil moisture anomalies persisting for several weeks to 1 month or longer (several months or seasons) in deep soil layers (Koster and Suarez 2001; Dirmeyer et al. 2008; Li et al. 2016). Soil moisture content influences not only current climatic conditions, but also subsequent climate conditions through its memory effect (Beljaars et al. 1996).
The relationship between spring soil moisture and subsequent summer precipitation has attracted much attention. For example, early work by Namias (1952, 1960) demonstrated that spring precipitation and soil moisture can affect summer precipitation in continental interiors. Modeling and observations have demonstrated that springtime soil moisture conditions can aid in drought or flood year prediction (e.g., Yeh et al. 1984; Findell and Eltahir 1997; Koster et al. 2003; Grimm et al. 2007; Meng and Quiring 2010). Studies have suggested that spring soil moisture anomalies in eastern China (EC) can affect summer monsoon circulation anomalies, leading to local summer precipitation anomalies (e.g., Zuo and Zhang 2007; Zhang and Zuo 2011; Meng et al. 2014). Summer precipitation over EC is also closely related to spring soil moisture anomalies on the Tibetan Plateau (TP; Chow et al. 2008; Wang et al. 2009; Li and Wang 2016). These studies have suggested that soil moisture during the spring could be a signal for summer climate prediction (e.g., Koster et al. 2003; Ma et al. 2000; Guo et al. 2007). For instance, assimilating spring soil moisture can improve predictions of summer precipitation (Walker and Houser 2001; Wang and Cui 2018). Nevertheless, seeking a signal over a longer time scale is still a prime climate prediction goal (Vautard et al. 2007; Quesada et al. 2012). Additionally, exploring factors in effect before spring could provide a better signal for boreal summer climate predictions.
Studies have shown that the FT process significantly affects land surface water and energy budgets though phase changes of soil water (Wang et al. 2003; Guo et al. 2011; Wang and Yang 2018). The FT process over the TP shows a significant connection with atmospheric circulation anomalies in East Asia (Wang et al. 2003, 2008a, b). Additionally, spring soil moisture anomalies induced by thawing of frozen soils and melting of snow affect summer precipitation in EC (Wang et al. 2003, 2017; Chow et al. 2008). Spring serves as a transition from winter to summer, and because the atmosphere is mainly influenced by land and ocean diabatic heating, seasonal climate prediction has a well-known spring disorder. Studies regarding the effects of spring soil moisture on subsequent summer precipitation (e.g., Namias 1952, 1960; Findell and Eltahir 1997; Zhang and Zuo 2011; Meng et al. 2014, Yang et al. 2016, Wang and Cui 2018) have focused on spring diabatic heating. Nevertheless, soil moisture anomalies prior to spring have been suggested to also affect summer climate. For example, heat in European summers can be induced by wet or dry conditions during the winter and spring (Vautard et al. 2007; Quesada et al. 2012). In addition to being a transitional season, spring is also when frozen soils thaw and snow melts over the TP, which has a large distribution of frozen ground. Yang and Wang (2018) have suggested that the soil FT process play a water storage role that can lengthen soil moisture memory and affect spring soil moisture content. This implies that spring soil moisture anomalies might contain information on soil moisture anomalies from the preceding winter or autumn.
In this study, we investigate the relationship between soil moisture anomalies over the TP in seasons before spring (autumn and winter in the previous year) and subsequent summer precipitation in EC and explore possible physical mechanisms by which soil moisture anomalies persisting from preceding seasons affect summer precipitation in EC. Elucidating these aspects would benefit seasonal climate prediction and deepen understanding of FT’s role in land–atmosphere interactions.
The remainder of this paper is organized as follows. In Sect. 2 we introduce data and methodology. In Sect. 3 we analyze the connection between spatiotemporal variations in soil moisture over the TP and summer precipitation in EC. In Sect. 4 we verify statistical results by performing numerical experiments and explore possible mechanisms linked to the impacts of the persistence of TP soil moisture anomalies on summer precipitation in EC. Lastly, we provide a discussion and main conclusions in Sect. 6.
2 Data and methodology
In this study, the daily and monthly soil moisture data for period 1979–2010 were obtained from the Global Land Data Assimilation System (GLDAS) Version 2, generated by the Noah land surface model, with a 1° × 1° spatial resolution. The GLDAS generates satellite- and ground-based observational data using advanced land surface modeling and a data assimilation technique (Rodell et al. 2004). Previous studies have used GLDAS soil moisture data and have verified the data across the TP (e.g., Chen et al. 2013; Bi et al. 2016). Although GLDAS soil moisture data have errors and uncertainties over the TP, the data still possess certain representativeness, even over complex terrain (Bao et al. 2017). The GLDAS soil moisture dataset provides four depth layers: 0–0.1 m, 0.1–0.4 m, 0.4–1.0 m, and 1.0–2.0 m. In this study we focused on soil moisture variations between 0 and 1.0 m.
To validate the reliability of GLDAS’s for interannual variability, we used in situ soil moisture measurements from agricultural meteorological stations collected by the China Meteorological Administration (CMA). We obtained CMA soil moisture data from 778 stations over a 19 year period (1992–2010). In these data, soil moisture content was measured every 10 days (i.e., on the 8th, 18th, and 28th day of each month) at soil depths of 0.1, 0.2, 0.5, 0.7, and 1.0 m (only data in the first three layers are available) using a gravimetric technique and measurements were originally recorded as mass percentage (unit: %). Monthly soil moisture content values were then averaged from these 10-day values. To conveniently compare with GLDAS data, similar as soil layers in Community Land Model (Oleson et al. 2013), CMA data at 0.1, 0.2, 0.5 m depth represent the value of layers 0–0.165 m, 0.165–0.493 m, and 0.493–1.0 m, respectively, and weighted average is calculated as mean data of layer 0–1.0 m based on each soil layer thickness (0.165, 0.328, and 0.507 m, respectively). In order to compare GLDAS grid data with CMA in situ observation data, the soil moisture data was averaged over a region where observation stations were centralized (D1; Fig. 1a). This direct comparison would disturb the results (Fig. 1b–c). A note is that observed soil moisture in the CMA is liquid water, but soil moisture in GLDAS contains both liquid water and ice; additionally, CMA data is observed at one site but GLDAS represents grid mean, both data representations differ over complex terrain. Therefore, we used the principal component (PC) of the empirical orthogonal function (EOF) in GLDAS soil moisture to compare with observations averaged over region D2 which has marked variations in soil moisture (Fig. 3). The results show that GLDAS is significantly consistent with CMA observations in interannual variability (Fig. 1d–e) during March–April–May (MAM) and September–October–November (SON). The correlation coefficients between GLDAS and observations are r = 0.45 (p < 0.05) in MAM and r = 0.40 (p < 0.1) in SON. These imply that GLDAS well represents soil moisture characteristics over the TP. We also calculated correlations between observations and other reanalysis data, such as ERA-Interim, CPC, and MERRA-2, and these results show that GLDAS is better than other reanalysis data (figure not shown).

Evaluation of Global Land Data Assimilation System (GLDAS) soil moisture dataset over Tibetan Plateau (TP). a Distribution of China Meteorological Administration (CMA) soil moisture measurement stations (red dots). Color shading represents terrain height (m). b–c Comparison of soil moisture data between CMA (black line) and GLDAS (blue line) data averaged over region D1 (black rectangles) during spring (MAM) and autumn (SON). Data are detrended and correlations (r) are shown in each panel. ** and * represent r values significant at the 95% and 90% levels, respectively. d–e same as b–c, but for comparison between CMA observations averaged over region D2 (purple rectangles; this region shows marked variations in soil moisture as shown in Figs. 3, 5) and principal component (PC) of the empirical orthogonal function (EOF) for GLDAS soil moisture
To analyze connections between soil moisture in the spring and preceding seasons, we further subdivided the duration of the data spanning from September in the previous year to May into three periods: the preceding autumn [September–October–November (PSON)], the preceding winter [December–January–February (PDJF) and spring (MAM)]. The TP covers a region bounded by coordinates 25°–40°N and 75°–105°E and has an elevation greater than 2000 m.
Daily precipitation data for 1979–2010 were collected from 756 observation stations of the National Climate Center of the CMA and we obtained monthly precipitation from the average of daily data.
We employed the EOF to investigate spatiotemporal characteristics of soil moisture anomalies in different seasons.
To validate the statistical results, a series of experiments were performed using the Community Earth System Model Version 1.2.0 (CESM 1.2.0), which was developed by the U.S. National Center for Atmospheric Research and implemented with fully dynamic atmosphere, land, ocean, sea ice, and river runoff components. The atmosphere component is the Community Atmosphere Model Version 4, and the land component is the Community Land Model Version 4 (CLM4). CESM has been widely used in other studies (e.g., Hurrell et al. 2013) and can effectively simulate general circulation and climate characteristics over the TP and surrounding regions (Wang et al. 2017). Studies have also suggested that CLM4 has good performance for land surface processes (Lawrence et al. 2011) and can well describe soil moisture characteristics in FT processes (Yang et al. 2018).
3 Spatiotemporal evolutions of soil moisture anomalies over the TP and relationship with summer precipitation anomalies in EC
Persistence of soil moisture anomalies has received much attention in recent years, with most studies focusing on seasonal-scale or sub-seasonal-scale soil moisture anomalies (e.g., Koster and Suarez 2001; Seneviratne et al. 2006). Considering the soil FT process’s water storage effect (Yang and Wang 2018), frozen ground in cold regions can produce a soil moisture anomaly that persists longer. Soil moisture anomaly persistence can be quantified by soil moisture memory, which is defined as the average time required for lagged autocorrelation of soil moisture dropping below the 99% confidence level (Dirmeyer et al. 2008). This lag is backward in time and the memory implies how far in the past the anomaly arose. For example, a 120-day memory for March means that anomalies in November persisted into March.
To investigate the persistence of soil moisture anomalies, Fig. 2 shows soil moisture memory over the TP calculated from the GLDAS dataset. March soil moisture memory across most regions of the TP was generally longer than 120 days (Fig. 2a), with memory reaching 180 days in the middle and northern regions of the TP which have low soil moisture content and precipitation and where permafrost is distributed. Soil moisture memory was short in the TP’s southern edges (especially in the Himalaya Mountains) as these regions had abundant precipitation. Soil moisture memory spatial distribution characteristics in April and May were similar to those of March, whereas the western region and southern edges of the TP had soil moisture memories that became shorter (Fig. 2b, c), which could be associated with the beginning of the rainy season (Wei et al. 2003) and with snowmelt. To further illustrate spring soil moisture memory, Fig. 2d shows an evaluation of averaged backward lagged autocorrelations of soil moisture over the eastern TP where soil moisture has large interannual variations. Backward lagged days reached approximately 150, 180, and 210 days for soil moisture in March, April and May, respectively, after which soil moisture autocorrelation drops below the 99% confidence level. This implies that spring soil moisture anomalies are connected with previous states and that soil moisture anomalies in the PSON and PDJF can persist into MAM.

Soil moisture memory over TP calculated from GLDAS daily dataset. a–c Spatial distribution of soil moisture memory (days) from March to May. The black rectangular box is the region with marked soil moisture variations (as shown in Figs. 3, 5). These values were only shown in region where spring soil moisture standard deviations were greater than 0.0 mm3/mm3 (Seneviratne et al. 2006). d Evolution of backward lagged autocorrelation for soil moisture during March, April, and May (the shading for ± mean 1 standard deviation). Soil moisture is averaged over the black rectangular box region
To investigate spatiotemporal characterizations of soil moisture variation and seasonal persistence over the TP, Fig. 3 shows EOF results of MAM, PDJF, and PSON soil moisture. Comparing EOF soil moisture spatial patterns during the three seasons and associated time series (PCs), except for the first mode (EOF1) of MAM soil moisture which displayed a large interannual variations in the eastern and western TP (figure not shown) and represented mean features of the MAM soil moisture anomalies, the spatial pattern of the second mode (EOF2), with a variance contribution of 18.0%, reflected opposite variations in the eastern and western TP (Fig. 3a), and EOF2’s load vectors (LVs) in the eastern TP were larger than those of EOF1. The EOF1 pattern of PDJF soil moisture (Fig. 3b), which had a variance contribution of 23.2%, was similar to the EOF2 pattern of MAM soil moisture, and the EOF1 pattern of PSON soil moisture, which had a variance contribution of 25.9% also showed similar characteristics of spatial variation (Fig. 3c). These results mean that except for the first MAM soil moisture mode, other spatial variation characteristics might be inherited from PDJF or PSON soil moisture, which is consistent with soil moisture memory results. During the winter soil is frozen and soil water is stored as ice, soil liquid water amounts over the TP are small and evaporation low. Therefore, the seasonal persistence of soil moisture anomalies from PSON to MAM was linked to soil FT processes over the TP. It should be noted that, although snow-melting and precipitation also influence soil moisture variation in the spring in addition to soil thawing, we focused on EOF2 of MAM soil moisture rather than EOF1 which represents mean features of soil moisture anomalies derived from precipitation and other processes. Furthermore, the associated time series (PCs) of EOFs of PDJF and PSON soil moisture showed significantly consistent variations with MAM soil moisture (Fig. 3d). Correlations between PC2 of MAM and PC1 of PDJF or PSON were r = 0.835 (p < 0.05) or r = 0.821 (p < 0.05), respectively. This further illustrated the close soil moisture connection between MAM and preceding seasons.

EOFs of soil moisture during three seasons. Spatial patterns of load vectors for a spring (MAM), b preceding winter (PDJF), and c preceding autumn (PSON). d Comparison of PCs of EOFs for soil moisture during three seasons: PC1 for PDJF and PSON and PC2 for MAM. Values of r with blue and red colors represent correlation between PC2 of MAM and PC1 of PDJF or PSON, respectively
To investigate the relationship between antecedent soil moisture anomalies in the TP and summer precipitation in EC, Fig. 4 shows correlations between PCs of soil moisture EOFs during the different seasons and summer precipitation in EC. MAM soil moisture EOF1 pattern appeared to reveal no significant signs for summer precipitation in EC (figure not shown). Nevertheless, when MAM soil moisture anomalies in the eastern TP were mainly negative (MAM soil moisture EOF2 pattern), summer precipitation in south China and the Yellow River basin was deficient, whereas it was excessive in the Yangtze River basin and northeast China (Fig. 4a), which is also consistent with previous results (Wang et al. 2016). Soil moisture anomalies in the eastern part of the TP during PDJF and PSON also showed similar effects on summer precipitation in EC (Fig. 4b, c). When comparing correlation patterns of summer precipitation with soil moisture during preceding seasons, an interesting feature is identified: PDJF and PSON soil moisture anomalies showed significant relationships with summer precipitation in EC, as well as similar with MAM soil moisture. Additionally, CPC and MERRA-2 also showed similar correlation patterns (figure not shown). It appears that soil moisture anomalies in the preceding autumn can be maintained in the soil for two seasons, with their effects being released in the spring. These results also imply that a prediction signal for summer precipitation can be provided by soil moisture anomalies from the preceding autumn to spring.

Correlation between PCs of EOFs for soil moisture during three seasons and summer precipitation in Eastern China (EC). a Spring (MAM), b preceding winter (PDJF), and c preceding autumn (PSON). Black dots and crosses represent grid values significant at 80% and 90% confidence levels under the Student’s t test, respectively
4 Validation of persistent climatic effects of soil moisture anomalies using numerical experiments
4.1 Experiment design
To validate the relationship between soil moisture anomalies over the TP and the summer precipitation in EC from the EOF analyses and explore possible mechanisms linked to the persistence of preceding season soil moisture anomaly climate effects, a control experiment (CTL) and three sensitive experiments (SEs) were performed as follows:
-
(1)
The CTL experiment was performed without modifying soil moisture calculated in the model.
-
(2)
The SE_MAM experiment was performed with increased soil moisture in the eastern TP (30°–37.5°N, 87°–102°E, rectangular box region in Fig. 5a) during MAM.
Fig. 5 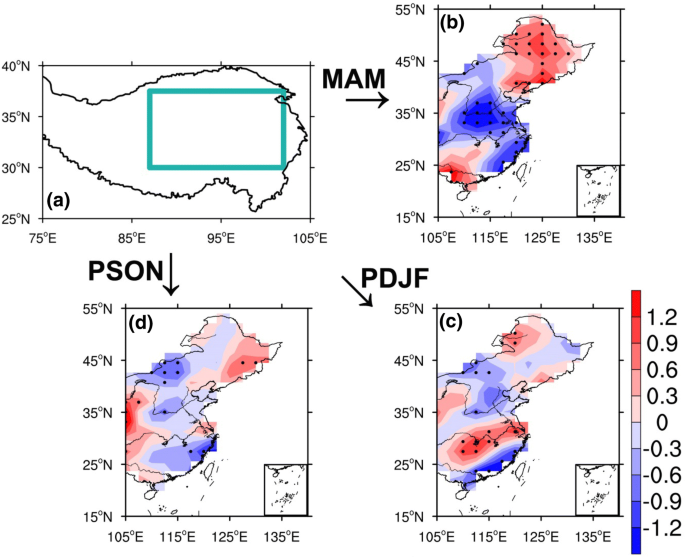
Simulated impacts of soil moisture anomalies on summer (JJA) precipitation (mm/day). a Increased soil moisture in the eastern region of the TP (rectangular box) during three seasons (MAM, PDJF and PSON). Corresponding patterns of summer precipitation anomalies (sensitive experiments minus control experiment; mm/day) in East China (EC) from experiments b SE_MAM, c SE_DJF and d SE_PSON. Black dots represent grid values significant at the 90% confidence level under the Student’s t test
-
(3)
The SE_PDJF experiment was performed with increased soil moisture in the eastern TP during PDJF.
-
(4)
The SE_PSON experiment was performed with increased soil moisture in the eastern TP during PSON.

The North rule (North et al. 1982) states that only the maximum value of LVs has meaning. Soil moisture anomalies taken in the SEs were based on large interannual soil moisture anomaly regions (with maximum LVs). For example, the soil moisture was increased in the eastern part of the TP in SE_MAM (Fig. 5a), which corresponds to the maximum LVs region in the MAM soil moisture EOF2 spatial pattern (Fig. 3a). Considering that soil moisture’s maximum standard deviation could reach 0.05 mm3/mm3, and that the average soil moisture climatology was approximately 0.25 mm3/mm3 over the TP, the soil moisture increased by 20% on the monthly scale in the SEs, soil moisture in the 0–1.0 m layer was modified.
CESM was run with fully coupled atmosphere, land, sea ice, and ocean components (the component set is B_2000). Initializations were arbitrary. Each experiment was integrated for 20 model years without re-initialization each year, with the first 10 years for model spin-up and the last 10 years’ results used for the analyses. The last 10 years of simulations represented a 10-member ensemble.
4.2 Results
Figure 5 shows increased soil moisture in eastern region of the TP during three seasons and the corresponding differences of the subsequent summer precipitation in EC between CTL and the SEs. When MAM soil moisture in eastern TP was increased (SE_MAM), simulated summer precipitation in south China and the Yellow River basin decreased and simulated summer precipitation in the Yangtze River basin and northeast China increased (Fig. 5b). The distribution of precipitation anomalies was consistent with the statistical results (Fig. 4a), although the positive precipitation anomalies in Inner Mongolia were not well reproduced. When PDJF (SE_PDJF) and PSON (SE_PSON) soil moisture were increased in the eastern part of the TP, simulated summer precipitation anomaly patterns (Fig. 5c, d) were similar to the SE_MAM simulations. These results illustrated that preceding season (i.e., PDJF and PSON) soil moisture can significantly affect subsequent summer precipitation in EC.
5 Possible mechanisms for the relationship between seasonal persistent soil moisture anomalies over the TP and summer precipitation in EC
Sections 3 and 4 showed that PSON soil moisture anomalies over the TP can persist for two seasons into the spring and then affect summer precipitation in EC. To validate persistence of soil moisture anomalies, Fig. 6 shows soil moisture differences between CTL and the SEs. SE_MAM showed distinct positive spring soil moisture anomalies in the eastern TP, which have been persisting to the summer (Fig. 6a, b). When PDJF soil moisture was increased (SE_PDJF), spring soil moisture also increased and the wetter soil state persisted into the summer but was weakened afterward (Fig. 6c–e). When PSON soil moisture was increased (SE_PSON), the positive soil moisture anomaly persisted into spring, but could not be clearly identified in the summer (Fig. 6f–i). This is because only soil moisture in 0–1.0 m layer was increased in the SEs and soil moisture has vertical infiltration and diffusion, and surface evaporation can induce soil water loss. Although the wetter soil moisture anomalies were weakened, wetter conditions in the preceding autumn can be maintained to the spring. Results of the numerical experiments illustrated that soil moisture anomalies from the preceding one or two seasons can persist into the spring to some extent, confirming statistical results from soil moisture memory calculation and EOF analysis.

Differences (sensitive experiments minus control experiment) of soil moisture (SM; mm3/mm3) from experiments a, b SE_MAM, c–e SE_PDJF, and f–i SE_PSON. Latticed shading represent grid values significant at the 90% confidence level under the Student’s t test
To understand the persistence of soil moisture anomalies and how it affects climate, Fig. 7 shows the evolution of soil moisture anomalies and corresponding changes in surface sensible heat (SH) and latent heat (LH), outgoing longwave radiation (OLR) at the top of the atmosphere, and net shortwave radiation (NSR) and net longwave radiation (NLR) at the surface. In SE_MAM, increased MAM soil moisture led to synchronous positive LH anomalies and negative SH anomalies, decreased NSR and NLR, reduced diabatic heating of the TP land surface, and negative OLR anomalies during the spring and positive OLR anomalies during the summer (Fig. 7a). Anomalies of surface diabatic heating and OLR with increased PDJF (SE_PDFJ) and PSON (SE_PSON) soil moisture (Fig. 7b, c) were similar to those of MAM, as soil moisture wetter anomalies during preceding seasons persisted into the spring, surface diabatic heating during spring in the TP was affected, with negative OLR anomalies developing above the TP during the spring and positive OLR anomalies during the summer. Figure 7c also shows that when PSON soil moisture was increased, surface diabatic heating (SH and LH) and OLR exhibited obvious anomalies, these anomalies became small during PDJF, this was caused by soil moisture being frozen in winter; nevertheless, surface diabatic heating anomalies reappeared during MAM. These results imply that the soil FT process not only retains water in the soil, but it also serves as a form of energy storage. In other words, the FT process not only causes PSON and PDJF soil moisture anomalies to persist into spring, it also seems to store diabatic heating anomalies in soil that are released in the spring.

Differences (sensitive experiments minus control experiment) in soil moisture (SM; mm3/mm3), surface sensible heat flux (SH; W/m2), surface latent heat flux (LH; W/m2), outgoing longwave radiation at the top of the atmosphere (OLR; W/m2), and net shortwave radiation (NSR; W/m2) and net longwave radiation (NLR; W/m2) at the surface. Differences are averaged over the region (eastern Tibetan Plateau; Fig. 5a) where soil moisture increased in the experiments
During the summer the TP serves as a heat source for the surrounding atmosphere (Ye and Gao 1979; Ye and Wu 1998). Soil moisture anomalies over the TP would change land surface diabatic heating, leading to further TP heat forcing anomalies and inducing general circulation anomalies around the TP. To investigate how surface diabatic heating anomalies due to soil moisture anomalies affect general circulation surrounding TP and summer precipitation in EC, Fig. 8 shows general circulation anomalies in the SEs. The air temperature above the TP in the upper troposphere exhibited negative anomalies due to weakened TP land surface diabatic heating to the atmosphere during spring. Air temperatures on the north side of the TP were also anomalous (Fig. 8a), but the temperature anomalies were smaller than those above the TP. In summer, wetter soil moisture anomalies still existed but were weakened, as were negative temperature anomalies above the TP. In contrast, negative temperature anomalies on the north side of the TP were enhanced, which might be related to the TP’s poleward heat transport (Hoskins and Pearce 1983; Ye and Wu 1998; Wang et al. 2017). These implied that surface diabatic heating anomalies in the TP affected the atmospheric thermal regime at two sides of the TP more than the atmosphere above the TP from spring to summer. While soil moisture during PDJF and PSON has wetter anomalies, enhanced negative air temperature anomalies at the north side of the TP could also be seen during the summer (Fig. 8d, g).

Changes of air thermal regime over TP and zonal wind. (Left) Evaluation of averaged air temperature differences (sensitive experiments minus control experiment) between region above the TP (30°–40°E, 200–300 hPa) and region at the north side of the TP (40°–50°E, 200–300 hPa) from spring (MAM) to summer (JJA). (Middle) Latitude–height cross sections (Note: panels were rotated 90° anclockwise) of differences of JJA mean meridional temperature gradient (color shading; × 10−4 °C km−1), zonal wind (contour; m s−1), and meridional circulation (vectors; m s−1; vertical velocity has been amplified by a factor of 500) averaged over 80°–100°E. Differences of meridional temperature gradient (latticed shading), zonal wind (colored contour), and meridional circulation (green vectors) are statistically significant at the 90% confidence level under the Student’s t test. Black shading represents topography. (Right) 15 and 30 m s−1 contours (blue and red thick lines are for CTL and SEs, respectively) of JJA mean westerlies (maximum horizontal wind speed between 100 and 500 hPa), the contour represents the difference of zonal wind at 200 hPa. Grid cells with values significant at the 90% confidence level under the Student’s t test are indicated by black dots
The atmosphere dynamic process over and around the TP is related to thermal regimes at its two sides. In SE_MAM, air temperatures at the north side of the TP were much colder during the summer due to the TP cold anomalies, which led to an increase in the meridional temperature gradient between the TP and air at its north side (Fig. 8b). Based on thermal wind law, zonal wind had positive anomalies and westerly wind flow on the north side of the TP is accelerated (Fig. 8b, c), and westerlies at the downstream exit region from northeast China to Japan would also be enhanced. In experiments SE_PDJF (Fig. 8e, f) and SE_PSON (Fig. 8h, i), the overall patterns of general circulation anomalies over East Asia caused by soil moisture anomalies in preceding winter and autumn are generally similar to the SE_MAM, except for some differences in details of the pattern of zonal wind anomalies.
General circulation anomalies surrounding the TP should relate to wave activity. Studies have shown that in summer, wave activity fluxes are dominantly upward in the middle to upper troposphere over the TP, indicating a conversion of available potential energy from the mean flow to disturbances (e.g., Takaya and Nakamura 2001). To further illustrate the effects of diabatic heating anomalies caused by MAM soil moisture anomalies, which contain information on PDJF and PSON soil moisture anomalies, we analyzed the dynamics of summer general circulation anomalies over East Asia. Figure 9 shows JJA mean 250 hPa meridional winds and stationary Rossby wave activity flux in CTL and corresponding anomalies in the SEs. In CTL, the stationary Rossby wave trains with alternating positive and negative meridional winds in the upper troposphere across Asia, with the wave train propagating eastward along the westerlies (about 40°N) and then heading southeastward to EC when passing over the TP (Fig. 9a). Meridional winds were positive (northward) on the western side of the TP and negative (southward) on the eastern side. When soil moisture was increased in the eastern TP during spring (SE_MAM), meridional winds at the northern side of the TP weakened, and wave activity flux anomalies were westward over EC, the northern TP, and the western side of the TP, implying that stationary Rossby wave train propagation was weakened (Fig. 9b). With attenuation of the stationary Rossby wave, the zonal mean flow gained momentum and energy from the wave, which enhanced the zonal mean flow (accelerated westerlies). When PDJF and PSON soil moisture in the eastern TP has wetter anomalies (SE_PDJF, SE_PSON), stationary Rossby wave anomaly patterns (Fig. 9c, d) were similar to those of SE_MAM (Fig. 9b), with meridional winds weakening near the TP and attenuation of the stationary Rossby wave. These imply that when the Rossby wave propagated across the TP it was influenced by heat forcing from the TP in spring. Wetter soil moisture anomalies would weaken Rossby wave propagation, which mainly appears in wave activity flux anomalies across the TP and EC. These results illustrated that surface diabatic heating anomalies in the TP due to PSON and PDJF soil moisture anomalies had similar effects on general circulation over downstream of the TP as MAM soil moisture anomalies. This further caused low level wind anomalies connected with those in the upper troposphere through the atmosphere’s barotropic or baroclinic structure and changed water vapor transport (Wang et al. 2008a, b), leading to summer precipitation anomalies in EC.

Distribution of summer (JJA) mean 250 hPa meridional winds (shading; m s−1) and wave activity flux (vectors; m2 s−2) from a control experiment (CTL; only > 2 m−2 s−2 are shown), and c, d corresponding differences between CTL and sensitive experiments (SEs; SEs minus CTL; only > 1 m−2 s−2 are shown). Black dots and purple vectors represent the grid cells with meridional wind and wave activity flux difference values significant at the 90% confidence level under the Student’s t test, respectively
Figures 8 and 9 show that general circulation and Rossby wave propagating anomalies patterns for the SEs were similar, which implies that no matter what soil moisture anomalies are present during preceding seasons, these through spring soil moisture anomalies affect general circulation. The experiments results illustrated that soil moisture anomalies in seasons preceding spring can serve as a signal for predicting summer precipitation in EC.
6 Discussion and conclusions
How to extract signals of external forcing from the land surface to improve seasonal climate prediction is an open issue. In this study, we analyzed seasonal persistence of soil moisture anomalies from the preceding autumn to subsequent seasons over the TP using both observations and model experiments and investigated the relationship between soil moisture anomalies from the two preceding seasons and summer precipitation in EC. We found that soil moisture anomaly patterns during the two preceding seasons (PDJF and PSON) were similar to pattern during the spring (MAM). In other words, spring soil moisture anomalies were inherited from preceding seasons. Soil moisture anomalies during MAM, PDJF and PSON over the TP have similar climate impacts, and the relationship between MAM soil moisture anomalies over the TP and summer precipitation anomalies in EC can retrospect to PSON and PDJF. When MAM soil moisture has wetter anomalies in the eastern TP, subsequent summer precipitation in south China and the Yellow River basin was deficient and excessive in the Yangtze River basin and northeast China. This was coincident with the effects of the soil FT process on precipitation (Wang et al. 2003). In the SEs, increased soil moisture in the eastern TP during the preceding autumn, preceding winter, and spring, reproduced similar summer precipitation anomaly patterns, illustrating that like spring soil moisture, soil moisture anomalies in preceding seasons over the TP have a significant relationship with subsequent summer precipitation in EC.
The possible mechanisms for the persistence of soil moisture anomalies from the preceding autumn to spring over the TP and its influence on summer precipitation in EC were investigated. A key linkage was that preceding autumn soil moisture anomalies persisted into MAM through a storage effect from the soil FT process (Yang and Wang 2018). Namely, soil moisture anomaly signals from the preceding autumn and winter were stored by the soil FT process that occurred over the TP and then released in the following spring. With positive PSON soil moisture anomalies persisting and appearing in spring, spring soil moisture anomalies changed surface diabatic heating and affected thermal forcing of the TP to the atmosphere during the summer. Additionally, the meridional temperature gradient increased on the north side of the TP, favoring the acceleration of westerlies at the TP’s north. Meanwhile, at middle latitudes, meridional winds and stationary Rossby wave train propagation weakened in the upper troposphere, thus leading to summer precipitation anomalies in EC.
Climate prediction practices and operation have demonstrated that seasonal climate prediction mainly relies on ocean information (for instance, the El Niño/La Niña phenomenon), which influences global climate variability on seasonal to interannual time scales (e.g., Barnston et al. 1997; Mokhov et al. 2011). In addition to the oceanic “signal,” soil moisture is a slowly varying factor compared to the atmosphere itself and can thus influence the atmosphere for several months or seasons (Koster et al. 2004). Spring soil moisture is usually applied to summer climate prediction as a continental signal from one leading season. This study suggests that soil moisture anomaly signals from the preceding autumn and winter can be transferred by the soil FT process to the spring. In other words, soil moisture anomalies in the spring contain signals from at least two preceding seasons, which provides a new clue for advancing seasonal climate prediction.
Remarkable spatial differences in soil moisture anomalies are due to different soil hydrothermal regimes. Previous work has shown that regions with prominent interannual variability of spring soil moisture locate in the mid-latitude transition zone where seasonal frozen ground is common and soil FT cycles commonly occur (Yang et al. 2016). Results of this study also imply that the role of soil FT process in land–atmosphere interaction might be important for climate prediction during Northern Hemisphere summers.
References
Ardilouze C, Batté L, Déqué M et al (2018) Investigating the impact of soil moisture on European summer climate in ensemble numerical experiments. Clim Dyn. https://doi.org/10.1007/s00382-018-4358-1
Bao HY, Yang K, Wang CH (2017) Characteristics of GLDAS soil-moisture data on the Tibet Plateau. Sci Cold Arid Reg 9:127–141. https://doi.org/10.3724/SP.J.1226.2017.00127
Barnston AG, Chelliah M, Goldenberg SB (1997) Documentation of a highly ENSO-related SST region in the equatorial Pacific. Atmos-Ocean 35:367–383
Beljaars ACM, Viterbo P, Miller MJ, Betts AK (1996) The anomalous rainfall over the United States during July 1993: sensitivity to land surface parameterization and soil anomalies. Mon Weather Rev 124:362–383
Bi HY, Ma JW, Zheng WJ, Zeng JY (2016) Comparison of soil moisture in GLDAS model simulations and in situ observations over the Tibetan Plateau. J Geophys Res Atmos 121:2658–2678
Blanford HF (1884) On the connexion of the Himalaya snowfall with dry winds and seasons of drought in India. Proc R Soc Lond 37:3–22
Chen LT (1997) The influence of winter–spring snow cover over Tibetan Plateau on atmospheric circulation and flood season precipitation in south China. Middle and long-term water temperature forecast corpus, vol 1. China Waterpower Press, Beijing, pp 194–195 (in Chinese)
Chen YY, Yang K, Qin J, Zhao L, Tang WJ, Han ML (2013) Evaluation of AMSR-E retrievals and GLDAS simulations against observations of a soil moisture network on the central Tibetan Plateau. J Geophys Res Atmos 118:4466–4475
Chow KC, Chan JCL, Shi X, Liu Y, Ding YH (2008) Time-lagged effects of spring Tibetan Plateau soil moisture on the monsoon over China in early summer. Int J Climatol 28:55–67
Conil S, Douville H, Tyteca S (2007) The relative influence of soil moisture and SST in climate predictability explored within ensembles of AMIP type experiments. Clim Dyn 28:125–145
Dai AG, Wigley TML (2000) Global patterns of ENSO-induced precipitation. Geophys Res Lett 27:1283–1286
Ding F, Sun ZB, Liu JL (2010) Correlations of snow depth over the Tibetan Plateau in winter and spring with precipitation in summer over China. Trans Atmos Sci 32:783–791
Dirmeyer PA, Schlosser CA, Brubaker KL (2008) Precipitation, recycling, and land memory: an integrated analysis. J Hydrometeorol 10:278–288
Diro GT, Sushama L (2017) The role of soil moisture-atmosphere interaction on future hot-spells over North America as simulated by the Canadian Regional Climate Model (CRCM5). J Clim. https://doi.org/10.1175/JCLI-D-16-0068.1
Diro GT, Sushama L, Huziy O (2017) Snow-atmosphere coupling and its impact on temperature variability and extremes over North America. Clim Dyn. https://doi.org/10.1007/s00382-017-3788-5
Findell KL, Eltahir EAB (1997) An analysis of the soil moisture-rainfall feedback, based on direct observations from Illinois. Water Resour Res 33:725–735. https://doi.org/10.1029/96WR03756
Fischer EM, Seneviratne SI, Vidale PL, Lüthi D, Schär C (2007) Soil moisture–atmosphere interactions during the 2003 European summer heat wave. J Clim 20:5081–5099. https://doi.org/10.1175/JCLI4288.1
Grimm AM, Pal JS, Giorgi F (2007) Connection between spring conditions and peak summer monsoon rainfall in South America: role of soil moisture, surface temperature, and topography in eastern Brazil. J Clim 20:5929–5945. https://doi.org/10.1175/2007JCLI1684.1
Guo W, Ma Z, Wang H (2007) Soil moisture—an important factor of seasonal precipitation prediction and its application. Clim Environ Res 12:20–28
Guo DL, Yang MX, Wang HJ (2011) Characteristics of land surface heat and water exchange under different soil freeze/thaw conditions over the central Tibetan Plateau. Hydrol Process 25:2531–2541
Hoskins B, Pearce RP (1983) Large-scale dynamical processes in the atmosphere. Academic Press, London
Hurrell JW, Holland MM, Gent PR, Ghan S, Kay JE, Kushner PJ, Lamarque JF, Large WG, Lawrence D, Lindsay K, Lipscomb WH, Long MC, Mahowald N, Marsh DR, Neale RB, Rasch P, Vavrus S, Vertenstein M, Bader D, Collins WD, Hack JJ, Kiehl J, Marshall S (2013) The community earth system model: a framework for collaborative research. Bull Am Meteorol Soc 94:1339–1360
Koster RD, Suarez MJ (1995) Relative contributions of land and ocean processes to precipitation variability. J Geophys Res 100:775–790
Koster RD, Suarez MJ (2001) Soil moisture memory in climate models. J Hydrometeorol 2:558–570
Koster RD, Suarez MJ, Higgins RW, Van den Dool HM (2003) Observational evidence that soil moisture variations affect precipitation. Geophys Res Lett 30:1241. https://doi.org/10.1029/2002GL016571
Koster RD et al (2004) Regions of strong coupling between soil moisture and precipitation. Science 305:1138–1140
Lawrence DM, Oleson KW, Flanner MG et al (2011) Parameterization improvements and functional and structural advances in version 4 of the community land model. J Adv Model Earth Syst 3:M03001
Li DX, Wang CH (2016) The relation between soil moisture over the Tibetan Plateau in spring and summer precipitation in the eastern China. J Glaciol Geocryol 38:89–99 (in Chinese)
Li RL, Bao HY, Li KC, Wang CH (2016) The memory and climate effects of global soil moisture. J Glaciol Geocryol 38:1470–1481
Ma ZG, Wei HL, Fu CB (2000) Relationship between regional soil moisture variation and climate variability over East China. Acta Meteorol Sin 58:278–287 (in Chinese)
May W, Rummukainen M, Chéruy F et al (2017) Contributions of soil moisture interactions to future precipitation changes in the GLACE-CMIP5 experiment. Clim Dyn 49:1681. https://doi.org/10.1007/s00382-016-3408-9
Meng L, Quiring SM (2010) Examining the influence of spring soil moisture anomalies on summer precipitation in the U.S. Great Plains using the Community Atmosphere Model version 3. J Geophys Res 115:D21118. https://doi.org/10.1029/2010JD014449
Meng L, Long D, Quiring SM, Shen Y (2014) Statistical analysis of the relationship between spring soil moisture and summer precipitation in East China. Int J Climatol 34:1511–1523
Mokhov II, Smirnov DA, Nakonechny PI, Kozlenko SS, Seleznev EP, Kurths J (2011) Alternating mutual influence of El Niño/Southern Oscillation and Indian monsoon. Geophys Res Lett 38:L00F04. https://doi.org/10.1029/2010GL045932
Namias J (1952) The annual course of month-to-month persistence in climatic Anomalies. Bull Am Meteorol Soc 33:279–285
Namias J (1960) Factors in the initiation, perpetuation and termination of drought. Int Assoc Sci Hydrol Publ 51:81–94
North GR, Bell TL, Cahalan RF, Moeng FJ (1982) Sampling errors in the estimation of empirical orthogonal functions. Mon Weather Rev 110:699–706
Oleson KW, Lawrence DM, Bonan GB et al (2013) Technical description of version 4.5 of the Community Land Model (CLM) (NCAR Tech. Note NCAR/TN-5031STR). National Center for Atmospheric Research, CO, Boulder, p 420
Quesada B, Vautard R, Yiou P, Hirschi M, Seneviratne SI (2012) Asymmetric European summer heat predictability from wet and dry southern winters and springs. Nat Clim Change 2:736–741
Rodell M et al (2004) The global land data assimilation system. Bull Am Meteorol Soc 85:381–394
Ropelewski CF, Halpert MS (1987) Global and regional scale precipitation patterns associated with the El Niño/Southern Oscillation. Mon Weather Rev 115:1606–1626
Seneviratne SI, Koster RD, Guo Z et al (2006) Soil moisture memory in AGCM simulations: analysis of global land-atmosphere coupling experiment (GLACE) data. J Hydrometeorol 7:1090–1112
Seneviratne SI, Corti T, Davin EL, Hirschi M, Jaeger EB, Lehner I, Orlowsky B, Teuling AJ (2010) Investigating soil moisture–climate interactions in a changing climate: A review. Earth Sci Rev 99:125–161
Takaya K, Nakamura H (2001) A formulation of a phase-independent wave-activity flux for stationary and migratory quasigeostrophic eddies on a zonally varying basic flow. J Atmos Sci 58:608–627
Vautard R, Yiou P, D’Andrea F, de Noblet N, Viovy N, Cassou C, Polcher J, Ciais P, Kageyama M, Fan Y (2007) Summertime European heat and drought waves induced by wintertime Mediterranean rainfall deficit. Geophys Res Lett 34:L07711. https://doi.org/10.1029/2006GL028001
Walker JP, Houser PR (2001) A methodology for initializing soil moisture in a global climate model: assimilation of near-surface soil moisture observations. J Geophys Res 106:11761–11774. https://doi.org/10.1029/2001JD900149
Wang CH, Cui ZQ (2018) Improvement of short-term climate prediction with indirect soil variables assimilation in China. J Clim 31:1399–1412
Wang G, Eltahir EAB (1999) Use of ENSO information in medium-and long-range forecasting of the Nile floods. J Clim 12:1726–1737
Wang CH, Yang K (2018) A new scheme for considering soil water-heat transport coupling based on Community Land Model: model description and preliminary validation. J Adv Model Earth Syst. https://doi.org/10.1002/2017MS001148
Wang B, Wu R, Fu X (2000) Pacific-East Asian teleconnection: how does ENSO affect East Asian climate? J Clim 13:1517–1536
Wang CH, Dong WJ, Wei ZG (2003) A study on relationship between freezing–thawing processes of the Qinghai-Xizang Plateau and the atmospheric circulation over East Asia. Chin J Geophys 46:438–448. https://doi.org/10.1002/cjg2.3361
Wang B, Bao Q, Hoskins B, Wu G, Liu Y (2008a) Tibetan Plateau warming and precipitation changes in East Asia. Geophys Res Lett 35:L14702. https://doi.org/10.1029/2008GL034330
Wang CH, Cheng GD, Deng AJ, Dong WJ (2008b) Numerical simulation on climate effects of freezing-thawing processes using CCM3. Sci Cold Arid Reg 1:68–79
Wang R, Li W, Liu X, Wang L (2009) Simulation of the impacts of spring soil moisture over the Tibetan Plateau on summer precipitation in China. Plateau Meteorol 28:1233–1241
Wang J, Qi L, He J, Wu Z (2016) Relationship between spring soil moisture in the Tibetan Plateau and summer precipitation in the Yangtze river basin and its possible mechanism. Chin J Geophys 59:3988–3995
Wang CH, Yang K, Li YL, Wu D, Bo Y (2017) Impacts of spatiotemporal anomalies of Tibetan Plateau snow cover on summer precipitation in eastern China. J Clim 30:885–903. https://doi.org/10.1175/JCLI-D-16-0041.1
Wei ZG, Huang RH, Dong WJ (2003) Interannual and interdecadal variations of air temperature and precipitation over the Tibetan Plateau. Chin J Atmos Sci 27:157–170
Wu TW, Qian ZA (2003) The relation between the Tibetan winter snow and the Asian summer monsoon and rainfall: an observational investigation. J Clim 16:2038–2051
Yang K, Wang CH (2018) Water storage effect of soil freeze-thaw process and its impacts on soil hydro-thermal regime variations. Agric For Meteorol 265:280–294. https://doi.org/10.1016/j.agrformet.2018.11.011
Yang K, Wang CH, Bao HY (2016) Contribution of soil moisture variability to summer precipitation in the Northern Hemisphere. J Geophys Res Atmos 121:108–124. https://doi.org/10.1002/2016JD025644
Yang K, Hu TT, Wang CH (2017) A numerical study on the relationship between the spring–winter snow cover anomalies over the northern and southern Tibetan Plateau and summer precipitation in East China. Chin J Atmos Sci 41:345–356. https://doi.org/10.3878/j.issn.1006-9895.1604.16119 (in Chinese)
Yang K, Wang CH, Li SY (2018) Improved simulation of frozen-thawing process in land surface model (CLM4.5). J Geophys Res Atmos 123:238–258. https://doi.org/10.1029/2017JD028260
Ye DZ, Gao YX (1979) Meteorology of the Qinghai-Xizang Plateau. Chinese Science Press, Beijing
Ye DZ, Wu GX (1998) The role of the heat source of the Tibetan Plateau in the general circulation. Meteorol Atmos Phys 67:181–198
Yeh TC, Wetheraid RT, Manabe S (1984) The effect of soil moisture on the short-term climate and hydrology change—a numerical experiment. Mon Weather Rev 112:474–490
Zhang RH, Zuo ZY (2011) Impact of spring soil moisture on surface energy balance and summer monsoon circulation over East Asia and precipitation in East China. J Clim 24:3309–3322
Zhang RH, Sumi A, Kimoto M (1999) A diagnostic study of the impact of El Nino on the precipitation in China. Adv Atmos Sci 16:229–241
Zuo ZY, Zhang RH (2007) The spring soil moisture and the summer rainfall in eastern China. Chin Sci Bull 52:3310. https://doi.org/10.1007/s11434-007-0442-3
Acknowledgements
This work was supported by the National Natural Science Foundation of China (91837205, 41661144017, 41801015 and 41805032). We would like to acknowledge the Meteorology Information Center of the Chinese Meteorology Administration (CMA) for providing observational data.
Author information
Authors and Affiliations
Corresponding author
Additional information
Publisher's Note
Springer Nature remains neutral with regard to jurisdictional claims in published maps and institutional affiliations.
Rights and permissions
Open Access This article is distributed under the terms of the Creative Commons Attribution 4.0 International License (http://creativecommons.org/licenses/by/4.0/), which permits unrestricted use, distribution, and reproduction in any medium, provided you give appropriate credit to the original author(s) and the source, provide a link to the Creative Commons license, and indicate if changes were made.
About this article

Cite this article
Yang, K., Wang, C. Seasonal persistence of soil moisture anomalies related to freeze–thaw over the Tibetan Plateau and prediction signal of summer precipitation in eastern China. Clim Dyn 53, 2411–2424 (2019). https://doi.org/10.1007/s00382-019-04867-1
Received:
Accepted:
Published:
Issue Date:
DOI: https://doi.org/10.1007/s00382-019-04867-1