
Abstract
Power utilities worldwide are facing enormous challenges when it comes to the distribution of electricity. With these challenges, electricity theft is regarded as the most common challenge in the electrical distribution system. Electricity theft can be meter tampering done in consumer houses and illegal connections done using hook-ups from the distribution pole grids. These electricity theft challenges have caused power utilities to reconsider customer engagements focusing on feedback, putting loss detection systems in their distribution system networks, using artificial intelligence to schedule maintenance and other asset management activities, etc. The main focus of this paper is to design a real-time power theft monitoring and detection system that is able to detect power theft in distribution systems. This proposed system utilizes smart meters consisting of an Arduino ATMega328P microcontrollers with GSM modules (Global System for Mobile Communication) used for system communication. Cloud storage is created to store the smart meter data. Simulations of the proposed system were done using Proteus Design Suite v.8.10 SP3 software. The proposed system is practically constructed for prototype measurement results. Should power imbalances be measured by the system, the authority office will receive an SMS notification as an alert for power theft detected by a specific smart metering system. The authority office will analyse the power measurements sent to the cloud storage (MATLAB Online, ThingSpeak IoT channels display), and further action will be taken.
1 Introduction
The power system network has many operational losses. Operational losses are categorized as technical and non-technical losses [1]. Technical losses mainly occur in distribution networks due to cable faults, transformers, overhead lines, and other substation equipment used to transfer/distribute electricity [2], while non-technical losses mainly occur in distribution system networks due to illegal electrification schemes, cable theft, non-payment of electricity tariffs, the selling and using illegal prepaid vouchers purchased from stolen vending machines, meters tampering, illegal electricity connections, etc. [3]. The main significant contributors to non-technical losses are meter tampering and illegal connections [3]. The issue of electricity theft (meter tampering and illegal connection) has become a serious concern for most power utilities worldwide. It has resulted in huge financial losses to the power utility and the government [4].
Recent research studies have shown that the world losses due to electricity theft are approximately US$89.3 billion annually [4]. In the USA, Progress Energy Incorporated (Inc.) has reported a 5% rise in electricity theft within a year [5]. The cost of nationwide electricity power theft in the USA alone is about $1.6 billion yearly [5]. According to the Herald Live, at least one house in every seven houses in the Nelson Mandela Bay Metro (South Africa) has its electric meter tampered with, resulting in revenue losses [4]. This electricity theft challenge is the main reason why most Electrical Departments in municipalities are struggling financially in the country. All these have a severe implication on the country’s economic growth due to the cascading problems caused, which also results in load shading that is mainly caused by electricity shortage. The monitoring and detection systems for meter tampering in consumer houses and illegal hook-up connections from distribution pole grids are commonly designed as separate systems [1]. This presents a challenge to the power utility as they need to install two systems to monitor and detect any illegal activities by each consumer. With this challenge, it is essential to design a real-time power theft monitoring and detection system that simultaneously monitors and detects illegal electricity connections from the distribution pole grids and meter tampering from household electricity consumers [1]. This will help minimize the financial losses faced by power utilities due to electricity theft and its impact on the country’s economy.
Several techniques have been developed within the power system grid to address the issue of electricity theft. The Automated Meter Reading (AMR) system was the first electronic meter [1][6]. This system would enable the utility company to remotely access the data transmitted from the consumer meter to the utility company by telephone, satellite communications, radio frequency, or power lines [7, 8]. The redevelopment of the AMR system was called Advanced Metering Infrastructure (AMI) because AMI enables ‘bidirectional’ data exchange between consumer meters and the utility company. The utility networks and home area networks are presented [8] (see Fig. 1). The home area networks use wireless communication systems and devices such as ZigBee module, wireless local area network (WLAN), WiMAX, long-term evolution (LTE), Wi-Fi, broadband power line communication (PLC), IEEE 802.16e, etc., to have a network connection on the power utility aggregation points [1][9].

Smart grid conceptual architecture [8]
Figure 1 presents a system that utilizes AMI networks for communications and System Operator (SO) to detect meter tampering unnoticed [8]. This system is designed so that AMI network schemes and the SO’s are able to obtain the total aggregated electricity consumption [8]. SO’s can also efficiently compute the electricity bill for each customer following dynamic pricing that is used for load monitoring and energy management [8]. Such systems also include the implementation of an electricity usage determiner or smart home scheduler that needs the support of a communication system associated with smart grids [9, 10]. Another example of such a system is the three-step advanced metering infrastructure (AMI) [11]. This system contains a trusted third party (TTP), local area network (LAN), and control centre (CC). The TTP phase is on the user’s side, where there are smart meters for each consumer house [11]. The digital electronic meters are designed to compute the voltage and the current product, which gives instantaneous power in watts [12, 13]. For the power utility company to identify meter tampering, the electricity theft self-detector smart meters are installed in each house to monitor the electricity usage of each consumer [13]. These systems can only detect meter tampering and monitor energy data usage but cannot address illegal connections from the distribution pole grids.
Figure 2 presents a smart prepaid energy metering system to control electricity theft [14] (see Fig. 2). With this system, the power utility monitors the consumer’s power usage by connecting the server and the consumer energy meter through a network. All this is done using GSM technologies, and the power utility is connected to the GSM modem [14]. The consumer energy meter consists of an ATMega32 microcontroller, energy measuring chip (ADE7751), GSM module (Siemens A62 mobile phone), MAX232, potential transformers, current transformers, a relay, and LCD [14]. Other related systems include a system that uses a circuit breaker with a ZigBee module and a current transformer placed at each consumer terminal to measure the total current consumed by the electricity consumers [15, 16]. Some smart meters are built using AVR microcontrollers and are different from most ordinary single-phase smart meters. They use two current transducers to measure active power in both live and neutral wires [17]. Other systems also feature theft detection and a notification system enabling the consumer to access the smart electric meter and power usage monitoring remotely using the internet [18, 19]. This could be easily done with LoRaWAN technology. In contrast, other systems are designed consisting of four main modules, namely controlling station (CS), transmission line sensor node (TLSN), wireless transformer sensor node (WTSN), and wireless consumer sensor node (WCSN) [19, 20].

Smart prepaid energy metering system to control electricity theft [14]
Figure 3 presents an Internet of Things (IoT)-based power theft detection system build consisting of a 32-bit RISC ARM processor core licensed by AMR holdings [21] (see Fig. 3). With ARM microprocessor and IoT, the power usage readings from the voltage divider are captured, and the information is easily transmitted from one point to another using the internet [21]. The ARM microprocessor receives captured electric data from the measuring device. It then sends the captured electric data for display to the input of the LCD so that the consumer is able to see how much is being consumed by the load. The ARM processor has an inbuilt ADC, which converts AC signal into binary (digital signal) [21]. Microcontrollers are used as an engine of the system to compare the balances, forward the captured data, and link the communication system of the microgrid system and the smart metering system [22]. The GSM module sends an SMS when power theft has been detected, and a power line fault is detected from the transmission lines [22, 23]. IoT-based systems are designed to send the data collected to the cloud storage (i.e., Speak-Software using GSM modules) [24, 25]. The power theft detected and captured electric data of the consumer is also kept at the Speak-Software [25].
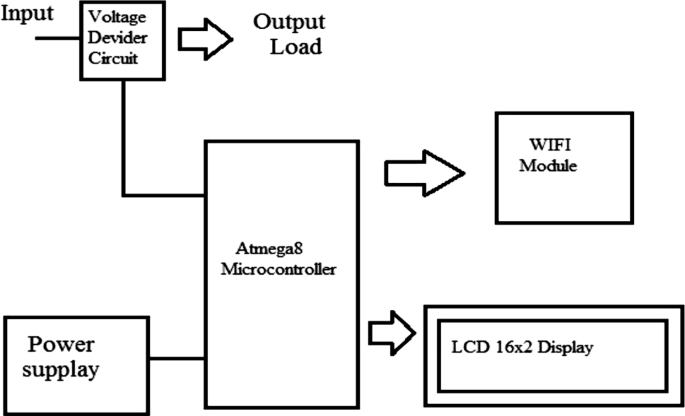
Diagram of an IoT-based power theft detection [21]
Other related systems include a monitoring system that utilizes an electro-optical sensor incorporated into a smart energy meter to detect when the meter cover is opened [26]. Another system is a detection system consisting of resistors, a Light Dependent Resistor (LDR), and a comparator [26, 27]. Another example is a cost-effective electricity theft detection and prevention system based on IoT technology [28]. Here, the IoT concept helps by connecting the smart energy meter with the utility through the internet, such as the internet of things (IoT) based tamper prevention system for electricity meters (IoTETPS) [28, 29]. Most IoT-based smart meters are designed to transmit the recorded energy usage data through network channels such as radio frequency (RF), broadband over power lines (BPL), and public networks [30]. This recorded data is transferred to the utility central meter data management system (MDMS) for data analysis [29, 30]. This includes a smart energy metering (SEM) system that uses Bluetooth technology to receive and transmit serial data across the network communication platforms [31]. These new systems also incorporate security through PLC applications and IoT’s online metering infrastructure system [19]. With cloud storage (ThingSpeak IoT, channels display), the parameters are displayed graphically and in digital format [32]. At every interval, the measured and captured electric data is received and stored in one excel sheet, and the power utility will review the sheet to identify measured power imbalances [32, 33]. So far, all the systems presented can only detect meter tampering accurately but cannot address illegal connections from the distribution pole grids.
Figure 4 presents an IoT-based power theft analyser and detection system [32] (see Fig. 4). The system relies on the data transferring between the monitoring units (observer meters) installed on each distribution transformer and/or a node that supplies power to consumer houses. Each section of a monitoring unit has an IoT smart energy meter installed to monitor that particular section’s parameters [32]. Each observer meter (master unit) measures and monitors the electric data distributed in the section. With the use of the ThingSpeak website (cloud storage), the parameters are displayed graphically and in digital format, and the power utility will review the graphic display to identify measured power imbalances. Whenever an illegal consumer hooks up directly from the distribution feeders of the microgrid system, there will be power discrepancies on the measured and captured electric flow between the master units of two paired sections [32]. The power utility will further analyse it to determine whether there was a possible illegal connection identified or not. The illegal connection is identified by comparing the power measured and reported by two different paired sections. However, this system does not make the identified illegal connection easily tracible with an exact location of electricity theft.

Diagram of an IoT-based power theft analyser and detection
Figure 5 shows a smart metering system that relies on the observer meter on the distribution pole node to determine the discrepancies of the power usage received from both the Home-1 smart meter and Home-2 smart meter [34]. Should the total sum of power usage measured on both homes be below the power measured by an observer meter, then electricity theft is detected. An observer meter will then disclose and tell its location and take a picture of an area for clearance to the power utility [34]. Another similar system includes an IoT-based communication system consisting of the current sensor, ZigBee module, Arduino Nano, Node MCU, and the GSM technology device [35, 36]. In addition, including systems designed consisting of a voltage transformer, current transformer, PIC microcontroller, and a deferential relay [37]. The PIC microcontroller built on with ADC and RISC architecture receives the measured values and converts the received analog values to digital values [37, 38].

Architecture of the smart metering system [34]
This includes smart meters designed consisting of a low trap installed to prevent the injected high-frequency signal from affecting or damaging the electronic components and other devices like home appliances connected to the power system [39]. Such systems use wireless communication protocols. These smart metering systems may use SparkMeter, which communicates using the IEEE 802.4 mesh network installed on the distribution pole nodes as a system network gateway to the utility [40]. These network gateways are responsible for low-latency management tasks and on-site data logging. The received data from the cloud storage is run through a SparkMeter software that has an Intel NUC mini-PC connected to an 802.15.4 USB node and the GSM/GPRS Moxa modem of the network gateways before the local interface receives it through 802.11 network protocol [40]. All the systems presented in these two last paragraphs are part of the Double Metering System, which this paper proposes as a solution but focusing on both issues of illegal connections and meter tampering using one system.
Due to data manipulation when distributing data wirelessly or through the internet, secure ways are recommended for the safe transmission of captured electric data and data storage. Figure 6 presents a cyber defense framework of the AMI communication networks of the electrical distribution grid and distributed denial of service (DDoS) attack [41]. This AMI network system features a hierarchical communication relation including wide area networks (WAN), neighbour area networks (NAN), and home area networks (HAN) [41] (see Fig. 6). AMI communication network systems can adopt such wireless communication platforms, namely: long-term evolution (LTE), wireless local area network (WLAN), ZigBee module, optical fibre, power line carrier (PLC), etc. [41]. Many network protocols are featured to meet AMI communication requirements, including IED 61,107/62056, open smart grid protocol (OSGP), and ANSI C12.18/19/21. To build a scalable communication infrastructure of AMI, an internet protocol suite (IPS) will be a suitable option [41]. The AMI system is vulnerable to potential cyber threats, such as connection-based attacks exploit the vulnerabilities in existing communication media and protocols, including wireless scrambling, message modification, eavesdropping, RF jamming, and injection [41].

DDoS attack within AMI communication network [41]
It is clear from the literature review that attempts to address the issue of electricity theft (meter tampering and illegal connections) have been made [1]. However, both issues of electricity theft must be addressed simultaneously using one system. The proposed real-time power theft monitoring and detection system is designed to identify, trace, and locate any attempt of electricity theft in the power system grid [1]. This proposed system is designed using smart meters installed on each distribution pole grid/node and each consumer house. Each smart meter consists of a current sensor, voltage sensor, Arduino ATMega328P microcontroller, and a GSM module.
2 Proposed system strategic capability
First, let’s discuss the issue of harmonics. It should be noted that the proposed system discusses the features that can be added to the existing smart electric meter and observer meters capable of accommodating THD (total harmonic distortion) measuring, including wireless communication, self-determining power consumption, or power distribution. The features added by the proposed system focus on showing how electricity theft based on illegal connections from the pole grids and meter tampering from consumers can be accurately detected using the proposed strategic system.
Below are ways to reduce the effect of harmonics in the power system circuits [42].
The following are only two possible ways for this.
-
The installation of filters helps to reduce the harmonics.
-
The replacement of a standard transformer with a high K-factor rated transformer that can handle the distortion.
K-factor-rated transformers are designed to handle a degree of harmonic load currents without overheating [42]. They have a K-rating number of the transformer (1, 4, 9, 13, 20) that indicates the amount of harmonic current the transformer can handle [42].
K-Factor 1: Motors, Motor Generators, Resistance Heating, Incandescent Lighting (without solid-state drives) [42].
K-Factor 4: Induction Heaters, HID Lighting, Welders, PLC and solid-state controls, UPS with optional input filtering [42].
K-Factor 13: UPS without optional input filtering, Schools and Classroom facilities, Multiple receptacle circuits in health care facilities, Production or assembly line equipment [42].
K-Factor 20: Circuits with exclusive data processing equipment, SCR Variable Speed Drives, Critical care facilities, and Hospital operating rooms [42].
Active power is the actual power transferred to the load, such as electric consumers, induction motors, generators, and transformers, and dissipated in the circuit [43]. Reactive power represents that the energy is first stored and then released in an electrostatic field or magnetic field in the case of capacitor and inductor, respectively [43]. Reactive power is commonly regarded as wasted power or power losses, as shown in Fig. 7. Apparent power is the product of voltage and current (i.e., RMS voltage and RMS current) [43]. Suppose the power utility installs a K-factor-rated transformer from the distribution grid supplying the consumers and installs the observer meter after the transformer outputs. They would have covered harmonics effects because they would measure apparent power or active power, assuming that no reactive power is experienced in the grid. Therefore, no power factor leading or lagging, and the value of the apparent power is equal to the value of the active power. Therefore, no distribution losses were encountered.

Analysing Apparent Power to Active Power and Reactive Power [43]
The proposed system utilizes current sensors to measure a varying current flow and manage the effect of harmonics. The self-designed filtered voltage sensor was used; this is proven in Fig. 20 as the voltage measuring is always stable; this was done to achieve accurate power distributed and received between the nodes and the consumers. In addition, it should be noted that the technical power losses are calculated using the formula P = I2R or V2/R but not the used power consumption formula P = VI [44]. Therefore, to determine the real technical losses, the mentioned formulas must be added to determine the technical losses, or the use of alternative methods featured within smart meters to determine them. It should be remembered that when applying V2/R, the voltage to consider is not the line-to-ground voltage or line-to-line voltage but the voltage drop across the line [44]. In case of no load, the voltage drop across the line is unmeasurable, and we can only consider the line resistance and the current flowing. So, the formula P = I2R should be used in this regard [44].
3 Proposed system design
Figure 8 presents a block diagram of a proposed real-time power theft monitoring and detection system. As stated, each smart meter consists of a current sensor, voltage sensor, Arduino ATMega328P microcontroller, and a GSM module. This system is designed to work in a combination of two-by-two continuous communication systems using feedback lines for accurate power measurement results. The main smart meter from the distribution transformer (main observer meter) communicates with the distribution pole grid 1 smart meter (observer meter) to measure power distributed from the distribution transformer against the power received by pole grid 1. The same applies with pole grid 1 to pole grid/node 2. The smart meter for distribution pole grid 1 (observer meter) communicates with the distribution pole grid/node 2 smart meter (observer meter). This includes the distribution pole node smart meter connected to the supply of each consumer house also communicates with the consumer house smart meter to measure power distributed from the pole node against the power received by each consumer house.

Flowchart description of the proposed system
The following should be noted with the proposed system. As shown in Fig. 10, the proposed smart metering system is designed so that the feedback line between pole grid 1 smart meter and pole grid 2 smart meter is for the smart meter in pole 1 to read the current reading received in pole 2 current sensor. This is achieved without direct communication with the smart meter in pole 2 and will help reduce miscommunications and error data captured, which may massively affect the system because of one interrupted smart meter. With that said, the smart meter in pole grid 1 measures a current supplied from a current sensor in pole 1 and the current received by a current sensor in pole 2 without direct communication with the pole 2 smart meter as structured in Fig. 10. The same applies to the consumer smart metering system.
The proposed smart metering system is mainly designed to focus on the distribution network system starting from the distribution transformer (delta-star step-down transformer) receiving a Medium Voltage (MV) 11 kV three-wire supply system from the substation. It then stepped down to Low Voltage (LV) 400 V three-phase four-wire system (with 230 V single-phase). From the distribution transformer to each distribution pole grid, the proposed smart metering system can calculate the power distributed in three-phase or single-phase. With the simulated and implemented prototype design system, a single-phase (230 V) smart metering system is designed for system-accurate functionality testing. Therefore, a single-phase smart metering system is used from distribution pole grid number one to distribution pole grid number two, including two single-phase smart meters in consumer houses.
With that said, should a three-phase supply be used from the distribution transformer to the distribution pole grids, the authority would install the three-phase smart metering system in both distribution pole grids. In the distribution pole grid number one three-phase smart metering system, the current transformer (CT) would measure current flow from each of the three lines (L1, L2, and L3) and combine all three currents to get a total current. It will then calibrate it with the voltage transformer (VT) reading in all three lines to determine the three-phase power distributed from distribution pole grid one to distribution pole grid two. The distribution pole grid number two three-phase smart metering system supplying three consumer houses from each of the three lines (L1, L2, and L3) would measure the current reading of line 1 supplying consumer house 1. These include the current reading of line 2 supplying consumer house 2 and the current reading in line 3 supplying consumer house 3. Then those readings would be determined separately by the distribution pole grid number two smart metering system to capture the power supplied to each consumer house. It will also combine the three power distributed readings to determine the total three-phase power consumption from the distribution pole grid number two.
From the block diagram in Fig. 8, the proposed system utilizes the following methods to accurately detect power theft attacks on the distribution feeders and consumer smart meters. The proposed system utilizes both the current and voltage sensors to measure the current readings and voltage readings, respectively, to produce the power readings measured distributed from the distribution pole grids/nodes and power consumption measured in consumer houses.
Distribution feeders’ section (detection of illegal connections): Should the power distributed by the main observer meter (from the distribution transformer smart metering system) be higher than the power received by distribution pole grid 1 smart metering system. Therefore, an illegal connection is detected between the distribution transformer and distribution pole grid 1. In addition, the power losses are known as they are measured by the system and sent to the cloud storage via GSM communication technology. The same implies if the power measured distributed from the distribution pole grid 1 smart metering system is higher than the power received by the distribution pole grid/node 2 smart metering system. An illegal connection is detected and identified between the distribution pole grid 1 and distribution pole grid 2. In addition, the power differences measured between both distribution pole grids are sent to the cloud storage for review by the authority office to issue fines to the found offers and recover revenue losses due to power theft detected.
Consumer houses section (detection of meter tampering): If consumer house F131 tampers with its smart meter to steal electricity, the proposed system can easily detect such power theft attempts. Therefore, should the power measured specifically supplying consumer house F131 from the pole node 2 smart metering system be higher than the measured power consumed by house F131 smart meter, then meter tampering is detected, and the power losses are known. They are sent to the cloud storage by the smart metering system. Again, should the power measured specifically supplying consumer house F132 from the pole node 2 smart metering system be higher than the power consumed by house F132 smart meter, then meter tampering is detected and reported to the authority office.
Authority office (side view through cloud storage): The authority office is notified with SMS alerts by the proposed system whenever a specific smart metering system detects power theft because of power imbalances measured and compared by the system. This allows the authority office to specifically review the power differences recorded on the cloud storage (MATLAB Online, ThingSpeak IoT channels display) by that particular smart metering system. In contrast, this will quickly result in the arrest of the found offenders and promptly recover the revenue losses resulting from power theft detected.
3.1 The block diagram of the power supply
Figure 9 presents a block diagram of a power supply ‘rectifier type of converter’ (AC-DC) to power an electronic circuit in each smart electric meter of the proposed real-time power theft monitoring and detection system [1].

Block diagram of (AC-DC) power supply
The power supply consists of a step-down transformer (230 V AC to 18 V AC with 6 VA). With a full-bridge (four diodes–1N4007), the step-down transformer output (18 V AC) is converted from AC to DC output. The DC output is smoothen using filter capacitors, while regulator (L7812) produces a fixed output of 12 V DC, then regulator (L7805) produces a fixed output of 5 V DC [1]. A 12 V DC output supplies the electronic circuit in each smart meter. The Arduino ATMega328P microcontrollers receive 5 V DC input from a parallel-connected 7805 voltage regulators while operating with 5 V DC. The 5 V DC output is also used to supply the GSM module and control a 5 V DC Relay Triggering Circuit, power LCD 2004 20 × 4 with blue backlight connected parallel with I2C serial, voltage sensors, and the current sensors.
With the proposed system, voltage sensors and current sensors are the only measuring instruments of the system. In Fig. 10, pole grid 1 smart metering system consists of an Arduino ATMega328P microcontroller which collects the voltage measured from the voltage sensor of pole grid 1 and the current measured from the current sensor of pole grid 1. In addition, the Arduino ATMega328P microcontroller will then calibrate those readings to produce power readings to be sent to the cloud storage via a GSM technology device. Arduino ATMega328P microcontroller also collects the current measured from the current sensor of pole grid/node 2 through ‘feedback line’ with a voltage measured from the voltage sensor of pole grid 1 to determine power differences measured between the pole grids. Those power measurements are then sent to the cloud storage by the proposed double metering system for the authority office to access the electric data captured and stored online.

Detailed structure of the proposed system
3.2 The schematic diagram of the proposed system
Figure 11 presents a schematic diagram of the proposed real-time power theft monitoring and detection system with double connected data capture system that addresses both issues of meter tampering and illegal connections using one system. The schematic below includes smart meters for distribution pole grid 1 and distribution pole grid/node 2. Two consumer houses—houses F131 and F132—are presented supplied from the distribution pole node 2. Each consumer house has a smart meter to measure power consumption in the house. These circuit arrangements also included switches used to tamper with each consumer house to show accurate meter tampering detection of the system. In addition, including the switch used to tap on the distribution feeders to show how accurate the system can be to detect illegal connections tapped between the distribution pole grids. It should be noted that when designing and implementing real-time smart electric meters, it is recommended that microcontrollers such as devices like AVR/PIC microcontrollers will be applicable. In addition, GSM devices may have future challenges such as a change in SIM card sizes or network disturbances. Therefore, it will be beneficial if communication systems such as Bluetooth, Wi-Fi, ZigBee module, LTE, IoT (i.e., 5G network), etc., are used as the network interface.

The circuit diagram for simulating the proposed real-time power theft monitoring and detection system
The proposed real-time power theft monitoring and detection system is designed consisting of devices such as Arduino ATMega328P microcontrollers, Liquid Crystal Display (LCD), GSM module, and other items. The other items include current sensors and voltage sensors used to measure power distributed and/or power received by each point of the microgrid system. LCDs of the proposed system are parallel-connected with a remote expander which uses the two-line bidirectional bus (I2C). This I2C is an 8-bit input/output (I/O) powered with 5 V DC. The proposed system uses the LCDs to display power readings and meter status in terms of balanced (meter Ok) or imbalanced (fault detected). GSM module is used to send SMS notifications to alert the authority office if the system measures power imbalances. The combination of Arduino ATMega328P microcontroller with GSM device allows wirelessly transfer of captured electric data from each smart meter to the cloud storage (MATLAB Online, ThingSpeak IoT channels display). In consumer houses, these smart meters disconnect consumer load using Relay Triggering Circuit, which operates by receiving a command from Arduino ATMega328P microcontroller when there is a power imbalance measured.
3.3 System techniques used in detecting power theft
The proposed system utilizes the following methods to detect power theft attacks on the distribution feeders and consumer smart meters. The Arduino ATMega328P microcontroller on each smart meter is programmed to read the measured and captured data from the voltage and current sensors every minute (one minute). When the electric data captured is received from the measuring instruments of the system, the Arduino ATMega328P microcontroller calibrates the current readings and voltage readings to produce the power consumption. Each smart meter’s microcontroller does this by continuously measuring the instantaneous voltage (in volts) multiplied by the instantaneous current (in amperes), which are calibrated in the software installed in the controller to produce the instantaneous electrical power (in kilowatts) [1]. The current measurements are calibrated using an (Alternating Current (AC) or Direct Current (DC) sensor) ‘ACS712 sensor’ with a ratio of 1A equal to 100 mA [1]. The voltage measurements are calibrated using a self-designed voltage sensor ‘AC/DC sensor’ (consisting of a freewheel ‘1N4007’ diode to produce a DC output voltage, while the parallel-connected resistors reduce the output DC voltage) [1]. In contrast, parallel ceramic capacitors are used to keep a DC voltage stable before a microcontroller reads it. The pic resolution of step size is calculated as:
where Vref = reference voltage, 2n = for a 10-bit analog-to-digital converter (ADC) is equal to 1024.
If the microcontroller reads a Vread, then
where VPIC = RMS voltage of the measured voltage. Vread = Digital value read from the sensor.
where Iactual = actual RMS current. mVperAmp = Millivolts per amperage.
The pic resolution calculation is the operating voltage (5 V DC) for the voltage sensor, Arduino ATMega328P microcontroller, and the current sensor which is converted to a digital signal (ADC) for a microcontroller reading. Since the value determined by the microcontroller (from a voltage sensor) is a digital value, the VPIC calculation is used to determine the actual RMS voltage converted from the digital value. Hence, the value determined by the microcontroller (from a current sensor) is also a digital value; therefore, the IActual calculation is used to determine the actual RMS current converted from the digital value.
3.4 Simulation results (Software module)
Figure 12 presents a scenario for consumer house F131: The circuit arrangement is that S1 (Switch-1) short-circuits the current sensor in the house so that the smart meter will read fewer power readings. Consumer house F131 load draws the portion of the current that is not measured by the current sensor in the house. As a result, there is an imbalance between the power measured from the distribution pole node smart metering system supplying house F131 and the power measured at consumer house F131 since the smart meter in the consumer house is bypassed. Possible meter tampering is detected because M1 = 2060.69W and M2 = 1839.90W are different. Therefore, the power losses determined (power differences) to issue fines are (M1 – M2 = 220.79W). With the GSM technology device, a possible electricity theft incident in the consumer house F131 is reported by sending an SMS notification to the power utility. The captured data is sent to the cloud storage. The SMS notification will have the specific consumer smart metering system details and the pole grid/node where the incident happened.

Possible power theft detection in house F131 after meter tampering
Figure 13 shows how the proposed system displays results when possible power theft is detected on the distribution pole grid/node or between the distribution pole grids/nodes. In this simulation, a hypothetical scenario of an illegal connection is done between the distribution pole grids/nodes by activating switch 3 (S3) connected between distribution pole grid 1 smart metering system and the distribution pole grid/node 2 smart metering system. The distribution pole grid 1 smart metering system measured M11 = 3786.07W the power distributed from pole grid 1 to pole grid/node 2, and through the feedback line, the power received by pole node 2 smart metering system is M12 = 2657.53W. Then, the power differences measured are (M11 – M12 = 1128.54W). Therefore, a possible electricity theft is detected between the distribution pole grid 1 and the distribution pole grid/node 2 since the power distribution is not balanced. With the GSM technology device, a possible electricity theft incident detected between pole grid 1 and pole node 2 is reported to the power utility by sending an SMS notification with specific pole grid smart metering system details where the incident happened.

Possible power theft detection between the distribution pole grids after illegal connection
3.5 Cloud storage (MATLAB Online, ThingSpeak IoT)
The proposed system features an internet of things (IoT) technology. This double metering system wirelessly auto-sends the captured electric data to the cloud storage and auto-generates Short Messaging System (SMS) to inform the authority office whenever power imbalances occur between the utility pole grids/nodes. This includes respective consumer houses supplied. This system utilizes Arduino ATMega328P microcontrollers programmed to send the captured electric data through GSM technology devices that use the Vodacom internet connection to transmit this captured electric data to the cloud storage. The created cloud storage is (MATLAB Online, ThingSpeak IoT channels display). As this system is based on IoT, all the power measured using pole grids smart metering systems and consumers’ smart metering systems can be seen and monitored using an Android phone or a web portal. The authority office can easily access the stored data online using a computer or a smartphone. With Fig. 14, a computer (two laptops) is used to access MATLAB Online account; channels display IoT project visualization where the power readings from the system are directed to store measured electric data.

Accessing cloud storage (MATLAB Online, ThingSpeak IoT)
3.6 Prototype results (Hardware module)
Figure 15 presents a whole circuit of the proposed real-time power theft monitoring and detection system with double connected data capture system ready for testing. The project implementation includes plugs used for loads testing, tampering within consumer smart meters (meter tampering), and tampering between distribution pole grids (illegal connections). The following are the project implementation specifications:
-
Distribution pole grid 1 smart metering set: (bottom right; M11—pole 1 power measurement, and M12—pole 2 feedback power measurement).
-
Distribution pole grid/node 2 smart metering set (bottom left; M22—pole 2 power measurement, M2A—house F131 power supplied measured from the pole node, and M2B—house F132 power supplied measured from the pole node).
-
Consumer house F131 smart metering set: (top right; M1A—house F131 power measured and M2A—pole 2 to house F131 ‘feedback’ of power measured).
-
Consumer house F132 smart metering set: (top left; M1B—house F132 power measured and M2B—pole 2 to house F132 ‘feedback’ of the power measured).

System implementation and system functionality tests
It should be noted that the software results produced 100% (power measurement results accuracy) in comparison and power differences measured by the system. For hardware results, due to power losses such as open circuits in plugs and unstable voltage and the flowing current in the implemented system for testing. The system is set to neglect those readings, and the threshold of power differences allowed is ± ≤ 200W. Therefore, all these power differences permitted on the hardware module produced just over 95% (power measurement results accuracy). Therefore, any value below ± 200W in both the software module and hardware module is identified as under normal operation mode.
Figure 16 shows how possible electricity theft is detected in consumer houses when an illegal connection is connected from the distribution pole node direct to the consumer load. In Fig. 16, both consumer houses F131 and F132 smart meters are meter tampered. The power differences are calculated using port A of pole grid/node 2 power measured, and port B of pole grid/node 2 power measured, respectively. The GSM modules of each consumer house and smart metering systems have generated SMS notifications to alert the authority office of detected meter tamping in both consumer houses. With IoT technology applications (cloud storage), the power measurements captured are analysed to issue a fine against the found offenders. In Fig. 13, meter tampering is detected at consumer house F131 (house A) since the feedback power read from port A of pole node 2 is M2A = 1378.98W, while the measured power consumed at house F131 is M1A = 30.94W. Then, the power differences measured are (M2A – M1A = 1348.04W). Consumer house F132 (house B) is also meter tampered, and the electric theft is detected since the feedback power read from port B of pole node 2 is M2B = 1374.56W, while the measured power consumed at house F132 is M1B = 35.36W. Then, the power differences measured are (M2B – M1B = 1339.20W).

Possible meter tampering detected in house F131 and house F132
Figure 17 shows the snapshots of the received SMS notifications to the officials (authority office). The first SMS notification informs the authority office that possible meter tampering at consumer house F131 has been identified. The second SMS notification also informs the authority office that possible meter tampering at consumer house F132 has been identified. On the cloud storage, the measured values of power distributed and losses are displayed for further analysis by the authority office to issue fines and immediately recover known revenue losses resulting from the incidents.

SMS alerts for houses (meter tampering) and cloud storage results
The information displayed on the cloud ‘IoT’ storage in Fig. 17 has the following data presented in Table 1. Table 1 consists of power measurement results for consumer houses—F131 and F132, including their power differences (meter tampering) measured between the pole node 2 of port A to consumer house F131 and pole node 2 of port B to consumer house F132.
Therefore, consumer house F131, at times 19:02:20 until 19:03:24, the power losses resulting from meter tampering detected between port A of pole node 2 and house F131 is 1348.04W. For consumer house F132, at times 19:01:46 until 19:02:50, the power losses resulting from meter tampering detected between port B of pole node 2 and house F132 is 1339.20W.
Therefore, the final power losses determined by the authority office when issuing fines are as follows:
3.6.1 For consumer house F131: final power losses determined to issue fines are as follows
where T(total duration) – is the time duration it lasted. t(begin)—the time it begins at. t(ended—the time it ended at.
where P(Pt losses)—total power losses resulted from meter tampering or illegal connection detected.
P(measured losses)—the power measured at that time.
T(total duration)—the time duration it lasted.
3.6.2 For consumer house F132: final power losses determined to issue fines are as follows
Figure 18 shows how possible power theft is detected between and/or on the distribution pole grids when there is an illegal connection on the power system grid. In Fig. 18, the distribution pole grid 1 smart metering system had measured (M11 = 2894.97W), while the power received at the distribution pole grid/node 2 through the feedback line is (M12 = 1644.16W). Then, the power differences measured are (M11 – M12 = 1250.81W). Therefore, a possible illegal connection is detected between the distribution pole grid 1 and distribution pole grid/node 2 since the power distribution is not balanced. The authority office is notified with an SMS notification containing the exact location where the incident happened. With the use of Arduino ATMega328P microcontroller and a GSM module, the power measured distributed from pole grid 1 and power differences measured between pole grid 1 and pole node 2 are send to cloud storage for review and record purposes.

Possible electricity theft detection between the distribution pole grids after illegal connection
Figure 19 shows a received SMS notification to the officials (authority office). It informs the authority office that an illegal connection between the distribution pole grid 1 and the distribution pole grid/node 2 has been identified. On the cloud storage, the measured values of power distributed and losses are displayed for further analysis by the authority office to issue fines and immediately recover known revenue losses resulting from the incident.

SMS notification for pole grid 1 (illegal connection identified) and cloud storage results
The information displayed on the cloud ‘IoT’ storage in Fig. 19 has the following data presented in Table 2. The table below consists of power measurement results measured distributed at pole grid 1 and power differences (illegal connections) measured between distribution pole grid 1 and distribution pole grid/node 2.
Therefore, at times 18:27:44 until 18:29:13, the power losses resulting from illegal connections between the distribution pole grid 1 and the distribution pole node 2 is 1250.81W.
Therefore, the final losses determined to issue fines are as follows:
3.7 Cloud storage-based results captured between 14h30 and 15h30 on 18 October 2021
Below are cloud storage-based test results captured between 14h30 and 15h30 on 18 October 2021. It should be noted that the authority office will only use cloud storage-based results to monitor power demand from the electricity consumers and monitor electricity theft and issue fines against the found offenders. Therefore, the captured power readings are recorded on the cloud storage (MATLAB—ThingSpeak) and are viewed by the authority office. Here, only pole grid/node 2 cloud storage results presented in the graphic display are analysed. In addition, calculations to issue fines to the found offenders are also presented and interpreted. Therefore, analysis of big data (power measurement results captured and recorded on the cloud storage in the space of one hour) are interpreted using tables and calculations as presented below.
Figure 20 shows a datasheet (graphic display) of captured electric data in the space of 1 h between 14h30 and 15h30 on 18 October 2021. These results are displayed on the cloud storage (MATLAB Online, ThingSpeak Internet of Things channels display). As shown below, datasheet 1 displays power measured distributed at pole node 2, while datasheet 2 displays a voltage measured at its peak voltage.

Pole 2 power demand measured, and the voltage stability measured
Table 3 shows the results captured by the proposed system and recorded on cloud storage in the space of 1 h. The table below shows results of power measured received and distributed from pole node 2 in the space of one hour and the voltage measurements captured at its peak-maximum voltage above 230 V. Standard single-phase voltage—230 V, the peak voltage measured is voltage: 232 V, Date: 18 October 2021, time: at all times as displayed in Fig. 20.
Figure 21 shows a datasheet (graphic display) of captured electric data displayed on the cloud storage (MATLAB Online, ThingSpeak Internet of Things channels display). As shown below, datasheet 1 displays power supplied from pole grid/node 2 of port A to consumer house A (F131), while datasheet 2 displays power supplied from pole grid/node 2 of port B to consumer house B (F132).

House F131 (A) & house F132 (B), power distributed from the pole node
Figure 22 shows a datasheet of captured electric data displayed on the cloud storage. As shown below, datasheet 1 displays the total power measured supplying both consumer house A and consumer house B from pole grid/node 2, while datasheet 2 displays power differences measured at pole node 2.

Pole 2 sum of power distributed to houses and power difference measured
Figure 23 shows how to read the power measured and captured results online sent by the smart metering system to the created cloud storage. The captured results are accessible online on the created cloud storage (MATLAB ThingSpeak Internet of Things channels display).

Pole grid/node 2 power measurements (results display)
Table 4 shows the results captured by the proposed system and recorded on cloud storage in the space of 1 h. The table below shows the total power measured supplying both consumer house A and consumer house B from pole grid/node 2, while the table below also shows the results of power differences measured at pole node 2.
Using Table 4, to determine the power losses (illegal connections) occurred on the distribution pole grid/node 2 at times (15:09:23) and (15:15:03), the following calculations are done:
3.7.1 At time (15:09:23), the final power losses determined to issue fines are as follows
3.7.2 At time (15:15:03), the final power losses determined to issue fines are as follows
Therefore, the measured power losses at pole grid/node 2 are caused by illegal connections and are detected and measured by the pole grid/node smart metering system at pole node 2, and the revenue losses are known. The measured power losses are 1157.99W and 1339.20W, highlighted in Table 4. The calculations carried out are used by the power utility (authority office) when issuing fines to the found offenders to recover power theft revenue losses.
4 Conclusion
Most power utilities worldwide suffer severe revenue losses due to the issue of power theft, mainly meter tampering and illegal connections. The proposed real-time power theft monitoring and detection system with a double metering system showed good simulation results to identify if there is meter tampering and illegal connections in the power system network [1]. At the same time, the hardware project showed how the smart electric meters of the proposed double metering system can be practically implemented in the distribution system network. The hardware project also showed how the proposed system can practically monitor and detect any illegal electricity connections on the distribution feeders and meter tampering when a consumer manipulates its smart electric meter. It further showed how the received power consumption data is displayed when read from the cloud storage using a computer or a smartphone.
Therefore, it is expected that the proposed system will play a significant role in countries such as South Africa in detecting or alleviating power theft. Including revenue recovery by the municipalities of the different cities or the power utility [1]. The benefits of implementing the proposed system are reducing asset loss and improving revenue, increasing the visibility of the power network, reducing line losses (mainly Non-Technical Losses). Before practical implementation, the system was designed on Proteus Design Suite v.8.10 SP3 software. This system was verified in the software simulation results and hardware prototype results as presented in this paper, including SMS notifications and cloud storage results analysis.
4.1 Economic feasibility
Any utility company that will consider implementing the proposed system can expect the elimination of power theft on their distribution system networks. With this proposed system, the authority office is notified with an SMS alert of where the theft is detected; this reduces data analysis time and leads to the quick arrest of the found offenders with known power losses. Nevertheless, the implementation of this system by any power utility will be costly as an extensive smart metering system will need to be installed on each pole grid and each consumer house for accurate power differences and power measurement results determined by the proposed system. In contrast, it is estimated that the power utility that would have adopted this advanced system can expect cost recovery within five years and start making a profit as power theft will be eliminated in their grid. The implementation of this system can be easily done in block mode (first metro, municipality, or town); if the implementation has an impact and revenues start increasing, they will shift to the next block until the system is fully installed in the whole region/country.
References
Zulu CL, Dzobo O (2021) Design of electric meter with double connected data capture system for energy theft monitoring, 2021 IEEE AFRICON, 2021, pp. 1–6. https://doi.org/10.1109/AFRICON51333.2021.9570859
Browsed; https://www.westernpower.co.uk/smarter-networks/losses/what-causes-losses
Tarannu M, Sharma D, Sing D (2017) A survey of monitoring and controlling power theft problem in local area. Int. J. Adv. Res. Ideas Innov. Technol. 3(5):401–405
Nicholas N (2017) Analysis: electricity theft in South Africa, June 27, 2017. [Online]. Available: https://www.smart-energy.com/features-analysis/electricity-theft-south-africa/
Preston R (2009) Electricity thefts on the rise, July 7, 2009. [Online]. Available: https://www.wtsp.com/article/news/local/electricity-thefts-on-the-rise/67-391066172
Foudeh HA and Mokhtar AS (2015) automated meter reading and advanced metering infrastructure projects,In: 9th jordanian international electrical and electronics engineering conference (JIEEEC), pp. 1–6, 12–14
Živic NS, O. Ur-Rehman and C. Ruland (2015) Evolution of smart metering systems, Telecommunications Forum Telfor (TELFOR), 23rd, pp. 635–638,
Owens RL, Mahmoud MN, Bruce J, Talbert D, Hasan S. R, G. Radman (2006) Electricity theft detection with privacy preservation for Smart grid ami networks using machine learning, Tennessee Technological University
Liu Y, Hu S, Li X, Paudyal S, Wang Z, Fuhrmann D (2016) Analysis and detection of cyberattacks in smart home cyber-physical energy Systems, Michigan Technological University
Yao D, Wen M, Liang X, Fu Z, Zhang K, Yang B (2019) Energy theft detection with energy privacy preservation in the smart grid. IEEE Int Things J 6(5):7659–7669
Ndinechi MC, Ogungbenro OA, Okafor KC (2011) Digital metering system: a better alternative for electromechanical energy meter in Nigeria. Int. J. Acad. Res. - IJAR 3(5):189–194
Ďaďo S, Vedral J (1981) Analogové a číslicové měřicí přístroje II. Textbook of CTU, Prague, (In Czech)
Zhou Y, Hu S, Paudyal S, Wang Z, Sun Y, Fuhrmann D (2017) Strategic energy theft detection in smart energy cyber-physical systems and data centers, Michigan Technological University
Mohammad N, Barua A, Arafat MA (2013) A smart prepaid energy metering system to control electricity theft, Proc. 2013 Int. Conf. Power, Energy Control. ICPEC 2013, pp. 562–565
Kumar R, Arora S, Singh S, Tomar A (2017) Design of intelligent electricity-theft monitoring system using MATLAB. Int. J. Sci. Eng. Res. - IJSER [Online]. Available: http://www.ijser.org.
Thangalakshmi S (2015) Power theft prevention in distribution system using smart devices. Int J Appl Eng Res 10:30841–30845
Atmel EUP (2013) Atmel AVR465 : Single-phase power / energy meter with tamper Detection. Atmel Corporation, San Jose, USA, p. 45 [Online]. Available: http://www.atmel.com
Loyola MCB, Bueno JB, Leon RDD (2019) Internet-based electric meter with theft detection, theft notification and consumption monitoring for residential power lines using wireless network technology. Int J Electr Electron Eng Telecommun 8(5238–246):2
Mohammad SS, Dar AA (2018) Electricity theft prevention in distribution system with distribution generation. Int J Adv Res Sci Eng 7(4):513–524
Patil SA (2017) Wireless technology for power theft monitoring. Int J Sci Res 1:2–3
Shinde PS, Maskar S, Pise A, Salunkh S (2019) IoT based Power Theft Detection. J Opt Commun Electron 5(1):19–23
Deepa S, Haritha D, Kabilan P, KarthickRaja G, Karthikeswari V (2018) Power theft identification system using IoT. Int J Pure Appl Math - IJPAM 118(20):417–420
Pawade A, Shaikh N, Chowdhri B, Shariq A (2015) Power theft detection using wireless system: a distributed approach for power theft prevention. Int J Student Res Technol Manag - IJSRTM 1:58–64
Kamble P, Prof SK, Biradar, (2018) IoT based energy meter system to identify power theft. Int J Sci Technol Eng - IJSTE 4(12):128–132
Kumaran K, Ananthi N, Saranya G, Priyadharchini S, Thiviyabala T, Vaishnavi K (2021) Power theft detection and alert system using IoT, Turkish. J Comput Math Educ - TJCME 12(10):1135–1139
Asogwa TC, Isizoh AN, Nwobodo HN, Okide SO (2014) Automatic power theft locator. Int J Innov Sci Eng Technol. 1:375–384
Sai SG, Priyamvadaa R, Savita SM (2017) Wireless power theft monitoring system. Int J Res 5:118–123
Ogu RE and Chukwudebe GA,(2017) Development of a cost-effective electricity theft detection and prevention system based on IoT Technology, IEEE 3rd Int. Conf. Electro-Technolofy por Natl. Dev., pp. 756–760
Sekhar VS, Puviarasi R (2018) Design of GSM based power theft detection and load control. Int J Pure Appl Math 119:2697–2703
Ogu RE, Chukwudebe GA, Ezenugu IA (2016) An IoT based tamper prevention system for electricity meter. Am J Eng Res - AJER 5:347–353
Singh M, Kumari A, Goyal V, Kumar P (2019) Energy theft detection by smart energy meter using WSN in real time. Int J Eng Res Technol 8:95–98
Gawas MA, Gavade RP, Wale PP, Mujawar SJ, Mali PS (2020) IoT things based power theft analyzer and detection. Int J Eng Res Technol - IJERT 9(6):758–760. https://doi.org/10.17577/ijertv9is060546
Shahid MB, Shahid MO, Tariq H, Saleem S (2019) Design and development of an efficient power theft detection and prevention system through consumer load profiling, 1st Int. Conf Electr Commun Comput Eng ICECCE 2019:24–25. https://doi.org/10.1109/ICECCE47252.2019.8940644
N. K. Mucheli et al (2019) Smart Power Theft Detection System, in: Proc. 3rd Int. Conf. 2019 Devices Integr. Circuit, DevIC 2019, pp. 302–305. https://doi.org/10.1109/DEVIC.2019.8783395
Sirisha BL (2020) Minimizing electricity theft using IoT, SAMRIDDHI A. J Phys Sci Eng Technol - AJPSET 12(3):49–52. https://doi.org/10.18090/samriddhi.v12iS3.11
Patil S, Pawaskar G, Patil K (2013) Electrical power theft detection and wireless meter reading. Int J Innov Res Sci Eng Technol. 2(4):1114–1119
Prashanthi GL, Prasad KV (2014) Wireless power meter monitoring with power theft detection and intimation system using gsm and zigbee networks, IOSR. J Electron Commun Eng - IOSR-JECE 9(6):04–08. https://doi.org/10.9790/2834-09610408
M. Lydia, G. E. P. Kumar, and Y. Levron,(2019) Detection of Electricity Theft based on Compressed Sensing, 2019 5th Int. Conf. Adv. Comput. Commun. Syst. ICACCS 2019, no. Icaccs, pp. 995–1000, https://doi.org/10.1109/ICACCS.2019.8728396
Gupta AK, Mukherjee A, Routray A, Biswas R (2017) A novel power theft detection algorithm for low voltage distribution network. Proc. IECON 2017 - 43rd Annu. Conf. IEEE Ind. Electron. Soc, pp 3603–3608. https://doi.org/10.1109/IECON.2017.8216611
Buevich MA (2018) A system architecture for energy theft detection and localization in microgrids, Carnegie Mellon University
Guo Y, Dr. Ten C.-W, Dr. Hu S, Dr. Feng Z, Dr. Wang C, Dr. Fuhrmann DR (2015) Cyber Defense Framework for Electrical Distribution Grid, Michigan Technological University
Browsed;https://www.fluke.com/en/learn/blog/power-quality/how-to-find-harmonics-in-electrical-systems. https://www.rexpowermagnetics.com/products/dry-type-low-voltage-transformers/k-rated-transformers.html\.
Browsed; https://www.electricaltechnology.org/2013/07/active-reactive-apparent-and-complex.html
Acknowledgements
The authors of this paper would like to thank StudyTrust and the National Research Foundation of South Africa (NRF) for sponsoring this research study.
Author information
Authors and Affiliations
Corresponding author
Ethics declarations
Conflict of interest
The authors of this paper declare that this submission has no conflict of interest.
Additional information
Publisher's Note
Springer Nature remains neutral with regard to jurisdictional claims in published maps and institutional affiliations.
Rights and permissions
Open Access This article is licensed under a Creative Commons Attribution 4.0 International License, which permits use, sharing, adaptation, distribution and reproduction in any medium or format, as long as you give appropriate credit to the original author(s) and the source, provide a link to the Creative Commons licence, and indicate if changes were made. The images or other third party material in this article are included in the article's Creative Commons licence, unless indicated otherwise in a credit line to the material. If material is not included in the article's Creative Commons licence and your intended use is not permitted by statutory regulation or exceeds the permitted use, you will need to obtain permission directly from the copyright holder. To view a copy of this licence, visit http://creativecommons.org/licenses/by/4.0/.
About this article

Cite this article
Zulu, C.L., Dzobo, O. Real-time power theft monitoring and detection system with double connected data capture system. Electr Eng 105, 3065–3083 (2023). https://doi.org/10.1007/s00202-023-01825-3
Received:
Accepted:
Published:
Issue Date:
DOI: https://doi.org/10.1007/s00202-023-01825-3