
Abstract
In the beginning of mutation research, mutations could only be detected indirectly through the analysis of the phenotypic alterations that they caused. The detection of mutations at the DNA level became possible with the development of sequencing methods. Nowadays, there are many different methods and strategies that have been created for mutation detection, both in natural and mutagenised populations. The strategies differ in accuracy and sensitivity, as well as in the laboratory facilities, time, costs and efforts that are required. The majority of them involve the pooling of DNA samples and the amplification of a gene (fragment) of interest followed by heteroduplex formation. One of the popular strategies for mutation identification takes advantage of the specific endonuclease (e.g. CEL I) that recognises and cuts heteroduplexes precisely at the 3′ position of the mismatch site. The cleaved fragments are usually visualised through electrophoresis in a polyacrylamide gel using LI-COR sequencers, but agarose electrophoresis may also be used for this purpose, although with less sensitivity. A different mutation identification strategy, which is based on the high-resolution melting (HRM) technique, may be the method of choice when working with a short gene or a gene fragment whose length optimally does not exceed 400 bp.
You have full access to this open access chapter, Download chapter PDF
Keywords
1 Mutation Detection Using Mismatch Cleavage
1.1 Introduction
Mutations can occur spontaneously due to errors in DNA replication, or they can be induced by physical or chemical mutagenic agents, such as gamma rays, X-rays, alkylating agents (e.g. EMS, MNU) or sodium azide (for further information, see Chaps. 1–3 and 6). Both spontaneous and induced mutations can lead to the development of new alleles that can alter the phenotype of an individual. Only mutations that occur in the germ line cells that give rise to the germ line and production of gametes will be inherited. Some mutations may have a positive influence on the agronomic traits of plants and therefore may be important for breeding. Mutations can also be used in basic research for the analysis of gene function. Recent developments in the sequencing of the genomes of many important crop plants, among them was barley, have greatly facilitated the selection of a gene or its fragment for mutational analysis (IBGSC et al. 2012).
Many different methods for mutation detection in the gene of interest have been developed (reviewed by Shu et al. 2012). Among them are techniques such as single-strand conformation polymorphism (SSCP) (Hestekin and Barron 2006), denaturing high-performance liquid chromatography (DHPLC) (McCallum et al. 2000), temperature/denaturing gradient gel electrophoresis (TGGE/DGGE) (Hestekin and Barron 2006), conformation-sensitive gel/capillary electrophoresis (CSGE/CSCE) (Gady et al. 2009), high-resolution melting (HRM) (Gundry et al. 2003), mismatch cleavage (Colbert et al. 2001; Till et al. 2006a) and matrix-assisted laser desorption/ionization time of flight mass spectrometry (MALDI-TOF) (Chawade et al. 2010). The improvement of new molecular techniques and increased knowledge of gene sequences has led to the invention of Targeting Induced Local Lesions IN Genomes (TILLING)—a reverse genetics method that combines the creation of a mutated population through classical mutagenesis with rapid and high-throughput screening for individuals that carry mutations in the desired genes (McCallum et al. 2000). The application of the TILLING strategy in the functional genomics and breeding programmes of different crops has recently been reviewed by Kurowska et al. (2011) and Wang et al. (2012). The most common method for mutation detection in TILLING is mismatch cleavage using CEL I endonuclease followed by electrophoresis in a polyacrylamide gel. Recently, due to the rapid development of next-generation sequencing technologies, TILLING by sequencing seems to be a modern strategy that will take the lead in mutation detection in the future (see Chap. 20).
1.1.1 Mismatch Cleavage
Mutation detection based on mismatch cleavage takes advantage of the specific endonuclease activity of some enzymes. The most frequently used enzyme is CEL I, which specifically recognises and cuts heteroduplexes.
PCR reactions are usually performed on five- to eightfold pools of the template DNA, and afterwards the amplified samples undergo denaturation and slow renaturation. Heteroduplexes (DNA fragments that have a mismatch) only appear in the pools that contain DNA with a mutation in the fragment that is being analysed (Fig. 18.1).

Heteroduplex formation. PCR products are denatured, which leads to separation into single DNA strands, and then slow renaturation leads to the rebinding of single strands into a two-stranded form. Heteroduplexes are formed when a single-stranded fragment with a mutation complements a wild-type single-stranded fragment, thus creating a mismatch in the mutation position
CEL I is then added to each sample in order to cut the heteroduplexes at the 3′ position of the mismatch. As the result of digestion, additional shorter fragments are produced, which indicates the potential presence of a mutation in the DNA from the pool that is being analysed. The products can be visualised in two ways: (1) on polyacrylamide gels in a LI-COR sequencer (when labelled primers are used for PCR reaction) or (2) directly on agarose or polyacrylamide gels (when unlabelled primers are used for PCR reaction). For LI-COR analysis, differently labelled primers for PCR reaction must be used. A forward primer should be labelled with IRDye 700, whereas a reverse primer with IRDye 800. After PCR reaction and CEL I digestion, samples must be purified. Polyacrylamide electrophoresis in a LI-COR sequencer allows very sensitive detection of mutations. The PCR products of the entire length are visible in both channels of the LI-COR (700 and 800 nm), whereas in the case of pools that contain DNA with mutation, one of the cleaved fragments is visible in the 700 nm channel, and the other is visible in the 800 nm channel. The sum of the lengths of the cleaved fragments should equal that of the amplified, uncleaved PCR product (Fig. 18.2). The visualisation of products through agarose gel electrophoresis is much cheaper, because labelled primers and an expensive LI-COR sequencer are not required, and it is less time consuming as the step of the purification of products is not required. However, the sensitivity of mutation detection using the agarose gel is lower. To obtain better resolution of unlabelled fragments, polyacrylamide gels may be used instead of the agarose gels (Uauy et al. 2009).

A simplified scheme of mismatch cleavage (a) and the visualisation of products on a polyacrylamide gel using a LI-COR sequencer (b). Blue asterisk indicates a forward primer labelled with IRDye 700; green asterisk indicates a reverse primer labelled with IRDye 800. I, a pool containing DNA without a mutation in the amplified gene; II, a pool containing DNA with a mutation in the amplified gene
CEL I, isolated from celery, is the most common endonuclease used for heteroduplex digestion and mutation detection (Wienholds et al. 2003; Till et al. 2006b; Gottwald et al. 2009). It was found that a high-quality pure enzyme is not required for mismatch cleavage. Till and co-workers (2004) developed a protocol for the isolation of a crude celery juice extract (CJE), which may also be used efficiently for mismatch cleavage. There are also some reports that have shown the usage of other specific endonucleases for mutation detection, for example, ENDO I, which was isolated from Arabidopsis thaliana (Triques et al. 2007, 2008; Minoia et al. 2010) or nucleases isolated from mung bean sprouts and Aspergillus (Till et al. 2004). In this part of the chapter, we present the protocols for high-throughput mutation detection in diploid species that is based on mismatch cleavage using celery juice extract. Visualisation of the products is based either on a polyacrylamide gel in a LI-COR sequencer or on a standard agarose gel system.
1.2 Materials
1.2.1 Mutation Detection Using Mismatch Cleavage and Polyacrylamide Electrophoresis in LI-COR
-
1.
DNA isolated from M2 plants from a TILLING population
Genomic DNA is extracted from the green leaves of M2 plants. For DNA isolation the micro-CTAB (hexadecyltrimethylammonium bromide) method (Doyle and Doyle 1987) with modifications (Department of Genetics, University of Silesia) may be used. It is recommended to measure the concentration and quality of DNA using a spectrophotometer (e.g. UV/Vis NanoDrop ND-1000). A value of the 260/280 nm absorbance ratio between 1.8 and 2.0 indicates high-quality DNA. DNA should be diluted to a concentration of 100 ng/μl (see Note 1).
-
2.
PCR reagents (see Note 2):
-
Specific primers that enable the amplification of the gene of interest or its fragment—unlabelled and labelled (a forward primer labelled with IRDye 700, a reverse primer labelled with IRDye 800) (for detailed information about primer design for TILLING see Chap. 17)
-
dNTPs
-
Taq polymerase
-
Reaction buffer for Taq polymerase containing magnesium ions
-
Sterile, deionised water
-
-
3.
CJE (celery juice extract) containing CEL I endonuclease—for an enzyme isolation protocol, see Chap. 15
-
4.
96 % ethanol with 1 % sodium acetate
-
5.
70 % ethanol
-
6.
STOP buffer containing 5 % bromophenol blue/xylene cyanol, 40 % formamide and 1 % EDTA
-
7.
Polyacrylamide gel premix containing (for 1 l) 420 g of urea, 200 ml of 30 % acrylamide/bisacrylamide (in ratio 29:1), 100 ml 10×TBE, and sterile deionised water (up to 1 l)
-
8.
10 % APS (ammonium persulphate)
-
9.
N,N,N′,N′-tetramethylethane-1,2-diamine (TEMED)
-
10.
Electrophoresis buffer—1×TBE (tris, boric acid, EDTA)
-
11.
Labelled size marker (e.g. 50–1500 bp sizing standard IRDye 700® and IRDye 800® from LI-COR Biosciences)
-
12.
Equipment needed:
-
Thermal cycler (e.g. Biometra)
-
Centrifuge for plates (allows spinning at 4000 rpm)
-
LI-COR 4300 S DNA analyser
-
1.2.2 Mutation Detection Using Mismatch Cleavage and Agarose Electrophoresis
-
1.
DNA isolated from the plants that are being tested (as in A2.1 point 1)
-
2.
PCR reagents (see Note 2):
-
Specific primers that enable the amplification of the gene of interest or its fragment—unlabelled (for detailed information about primer design for TILLING, see Chap. 17)
-
dNTPs
-
Taq polymerase
-
Reaction buffer for Taq polymerase containing magnesium ions
-
Sterile, deionised water
-
-
3.
CJE (celery juice extract) containing CEL I endonuclease
-
4.
Agarose, DNA stain (e.g. ethidium bromide) and 0.5×TBE (tris, boric acid, EDTA)
-
5.
Size marker for agarose gel
-
6.
Equipment:
-
Thermal cycler (e.g. Biometra)
-
Agarose electrophoresis unit
-
UV lamp (e.g. Vilber Lourmat)
-
1.3 Methods
1.3.1 Mutation Detection Using CJE and the Visualisation of Products in LI-COR Sequencer
1.3.1.1 Sample Pooling and PCR Amplification
-
1.
Prepare eightfold DNA pools that will serve as the template for PCR reactions (Fig. 18.3).
-
2.
Perform the PCR reaction (in a 20 μl volume) in 96-well plates in a thermal cycler to amplify the gene of interest or its fragment (see Notes 2, 3 and 4). Use eightfold DNA pools as the templates (for primer design see Chap. 17).

Strategy of DNA pooling in 96-well plates
An example of the PCR reaction mix (should be optimised individually for each pair of primers and the type of polymerase used):
ddH2O | 14.4 μl |
10 × buffer B for colour Taq polymerase | 2 μl |
dNTPs (5 mM, Promega) | 0.8 μl |
Primer F (10 μM, labelled) (see Note 3) | 0.4 μl |
Primer R (10 μM, labelled) (see Note 3) | 0.4 μl |
Color Taq polymerase (2 U/μl, EURx) | 0.5 μl |
Eightfold DNA pool (100 ng/μl) | 1.5 μl |
20 μl |
An example of PCR conditions (should be optimised individually for each pair of primers and the type of polymerase used):
Initial denaturation | Temp. 95 °C 5 min | |
Denaturation | Temp. 95 °C 45 s |
|
Annealing | Temp. 65 °C 30 s | |
Elongation | Temp. 72 °C 45 s | |
Final elongation | Temp. 72 °C 5 min | |
Pause | Temp. 15 °C ∞ | |
 × 37
× 371.3.1.2 Endonuclease Digestion and Ethanol Purification of Products
-
1.
Perform homo- and heteroduplex formation using a thermal cycler:
Temp. 95 °C | 3 min |
Temp. 70 °C | 20 s—repeat this step 70 times—each time decrease temperature 0.3 °C |
Temp. 8 °C | ∞ |
-
2.
Add 20 μl of 0.1×CJE (see Note 5) to each sample in a plate, vortex.
-
3.
Incubate the plate at 45 °C for 15 min.
-
4.
Add 60 μl of 96 % ethanol with 1 % sodium acetate to each sample, vortex.
-
5.
Centrifuge the plate at 4000 rpm in 4 °C for 20 min.
-
6.
Remove ethanol by turning the plate upside down on a paper towel.
-
7.
Add 30 μl of 70 % ethanol to the remaining pellets.
-
8.
Centrifuge plate at 4000 rpm at 4 °C for 10 min.
-
9.
Remove ethanol by turning the plate upside down on a paper towel.
-
10.
Incubate the plate (uncovered) in an open thermal cycler at 80 °C until the samples are completely dry (~15 min).
-
11.
Add 3 μl of STOP buffer to each sample.
Samples should be stored at 4 °C (for a longer period of time at −20 °C) and protected from light.
1.3.1.3 Electrophoresis in a 6 % Denaturing Polyacrylamide Gel Using a LI-COR Sequencer
-
1.
Add 15 μl of TEMED and 150 μl of 10 % APS to 20 ml of polyacrylamide gel premix.
-
2.
Pour the gel between thoroughly cleaned glasses that are separated by 0.2 mm splicers and insert the comb in order to set a brow of the gel—polymerisation of the gel takes around 1 h.
-
3.
Remove the comb and clean the brow of the gel and the outside part of the glasses from the rest of the polyacrylamide (see Note 6). Put the comb into the gel in order to create pockets.
-
4.
Put the gel in holders into the LI-COR sequencer in a 1×TBE running buffer.
-
5.
Run pre-electrophoresis under the conditions of 1300 V, 30 W, 30 mA and 45 °C for 15 min.
-
6.
Load 1–1.5 μl of each sample onto the gel. Samples need to be denatured in 95 °C for 5 min prior to loading. Remember to load a labelled size marker.
-
7.
Run electrophoresis under the conditions: 1300 V, 30 W, and 30 mA with a medium speed of laser scanning in two channels (700 and 800 nm). Depending on the length of the product, electrophoresis can take 3–5 h.
-
8.
When the electrophoresis is finished, analyse the images from the LI-COR 700 nm and 800 nm channels in order to choose the pools (positive bulks) with the DNA that carries a potential mutation, which would be indicated by additional bands (Fig. 18.4).

An example of polyacrylamide gel analysis, indicating two positive bulks—lane 10 and lane 12. SM size marker
1.3.1.4 Identification of the Particular M2 Individual that Is Carrying a Mutation
-
1.
Prepare DNA templates by mixing the DNA of individual M2 plant from the positive bulk with the wild-type DNA. For simplification, this template is hereby referred to as twofold DNA pool in the protocol.
-
2.
Perform PCR amplification as in A3.1.1 point 2, but using twofold DNA pools as templates.
-
3.
Perform all steps from A3.1.2 and A3.1.3.
The analysis of image of the gel enables the positive twofold pools to be identified (indicated by additional bands) and therefore enables the particular plants that carry a potential mutation to be identified.
-
4.
Confirm any potential mutation by sequencing the analysed fragment from the M2 individuals that were identified.
1.3.2 Mutation Detection Using CJE and Visualisation of Products on Agarose Gel
1.3.2.1 Sample Pooling and PCR Amplification
-
1.
Pool samples as indicated in A3.1.1 step 1 (or use pools containing DNA of a lower number of individuals—see Note 7).
-
2.
Perform PCR reaction as indicated in A3.1.1 step 2, but only using unlabelled primers.
1.3.2.2 Endonuclease Digestion and Visualisation of Products
-
1.
Perform homo- and heteroduplex formation as indicated in A3.1.2 step 1.
-
2.
Add 20 μl of 5×CJE (see Note 7) to each sample, vortex.
-
3.
Immediately after endonuclease digestion, load samples (total volume—40 μl) on 2–3 % agarose gel and run electrophoresis under 100 V. Remember to add DNA stain, e.g. ethidium bromide, to the agarose gel before sample loading and to load the size marker. The duration of electrophoresis depends on the length of the amplicons.
-
4.
Analyse the picture of the gel taken under a UV lamp in order to identify positive bulks (Fig. 18.5).

An example of agarose gel analysis. A positive bulk is shown in lane 7
1.3.2.3 Identification of a Particular M2 Individual that Carries a Mutation
-
1.
Prepare twofold DNA pools containing the DNA of each M2 plant from the positive bulk individually mixed with the wild-type DNA.
-
2.
Perform PCR amplification as in A3.1.1 step 2, but using twofold DNA pools as the templates and unlabelled primers.
-
3.
Perform all of the steps from A3.2.2.
The analysis of the image of the gel enables positive twofold bulks to be identified (indicated by additional bands) and therefore enables particular plants that carry a potential mutation to be identified.
-
4.
Confirm the potential mutation by sequencing the analysed fragment from the M2 individuals that were identified.
1.4 Notes
-
1.
The concentration of DNA required for good PCR amplification may vary depending on many factors, such as the genome size of the species of interests or type of polymerase used. Optimisation of the DNA concentration for PCR may be needed.
-
2.
To increase PCR performance, additional reagents may be added, such as bovine serum albumin (BSA) or dimethyl sulfoxide (DMSO).
-
3.
The length of the PCR amplicon should not exceed 1500 bp. The elongation time during PCR depends on the length of the amplicon (for 1000 bp ~1 min).
-
4.
In order to improve the PCR performance, a mixture of labelled and unlabelled primers can be used at a ratio of 3*:2:4*:1 (*labelled forward primer, unlabelled forward primer, *labelled reverse primer, and unlabelled reverse primer, respectively).
-
5.
The concentration 1×CJE is the concentration of the celery juice extract that is required in order to detect a mutation in a twofold DNA pool on an agarose gel. The optimal CJE concentration used for mutation detection through LI-COR system (usually 0.1×CJE) and duration of digest should be optimised under particular laboratory conditions.
-
6.
Glasses need to be absolutely clean so that the laser can easily read the signal of fluorescence through them. Use deionised water to clean them.
-
7.
Mutation detection using agarose gels is less sensitive. The 0.1× concentration of CJE (used for detection with a LI-COR sequencer) is not sufficient to detect mutations using agarose gels. Instead, 1×CJE should be used to detect a mutation in twofold DNA pools, whereas 5×CJE may enable the detection of mutations in eightfold DNA pools (Fig. 18.6). In the event that fragments are difficult to see, the number of M2 individuals used in a pool may need to be reduced to increase the strength of additional bands that indicate potential mutations (Fig. 18.6).

Mutation detection on agarose gel. The different concentrations of CJE that were used indicated that 5×CJE is sufficient for analysing eightfold DNA pools
2 Mutation Detection Using High-Resolution Melting
2.1 Introduction
High-resolution melting (HRM) is a non-enzymatic technique that was applied for the first time to analyse polymorphisms in three human genes: HTR2A, β-globin and cystic fibrosis (Gundry et al. 2003). HRM has many advantages over other methods for mutation detection. It is “a closed-tube” system that requires standard PCR reagents that are supplemented only with new generation of saturating fluorescent dsDNA dyes, e.g. EvaGreen (Biotium Inc., Hayward, CA, USA), LightCycler® 480 ResoLight Dye (Roche Diagnostics, GmbH, Mannheim, Germany) or LCGreen Plus (BioFire Defense, Salt Lake City, UT, USA). These dyes only interact with dsDNA, and therefore, 100 % of fluorescence is observed only in this case. Because the fluorescent dye is present during PCR and high-resolution melting, both an increasing amount of the PCR product and changes of the fluorescence during melting can be observed. In the HRM method, there is no need for the further processing of PCR products (e.g. cleavage with CEL I enzyme, purification, gel electrophoresis and visual analysis) which is time consuming and increases the risk of contamination. The melting process is fast, and an analysis can be made in a few minutes (Li et al. 2011). These advantages have made HRM a powerful tool for many applications—in the diagnosis of human diseases (Ezgu et al. 2014) and mutation scanning in humans (e.g. BRCA1 and BRCA2 genes, Hondow et al. 2011). This method has also been used to detect mutations (single-nucleotide polymorphisms, SNPs and small insertions/deletions, InDels) in plant genetic studies, including TILLING in Lycopersicon esculentum (Gady et al. 2009), Oryzias latipes (Ishikawa et al. 2010), Triticum aestivum (Botticella et al. 2011), Brassica rapa (Lochlainn et al. 2011) and genetic mapping in Hordeum vulgare (Lehmensiek et al. 2008), Zea mays (Li et al. 2010) and Oryza sativa (Li et al. 2011). HRM has also been used for the identification of transgenic plants (Milner et al. 2014) and the detection of DNA methylation (Wojdacz and Dobrovic 2007).
In the HRM method, the amplification of a selected sequence by PCR in the presence of fluorescent dsDNA dyes, the formation of homo- and heteroduplexes and the monitoring of fluorescence changes are performed using one HRM instrument (e.g. Light Cycler® 480 II). After PCR (Fig. 18.7a), a brief denaturation followed by the rapid reannealing of the amplicons takes place (Fig. 18.7b). In the case of homozygous samples, only homoduplex DNA fragments are present, whereas in the case of heterozygous samples or pools containing a mutation (in the homo- or heterozygous stage), four DNA duplexes are formed—two homoduplexes and two heteroduplexes. An increasing temperature causes DNA melting and the release of the fluorescent dye (Fig. 18.7c). The change in the fluorescence of the saturating fluorescent dye during temperature increasing is monitored using an HRM instrument in real time (e.g. Light Cycler® 480 II), so the entire process can be observed as a characteristic melting profile (Gady et al. 2009; Li et al. 2011) (Fig. 18.7d).

Scheme of the HRM method. (a) Products after PCR, saturated with intercalating fluorescent dye—green oval. (b) Formation of homo- and heteroduplexes. (c) Increasing temperature causes DNA melting and release of the fluorescent dye. (d) Normalised melting curves for all of the samples that were analysed. In this example, 40 samples were analysed, i.e. 39 homozygous (blue) and one heterozygous (purple)
A change in the DNA sequence, e.g. a SNP, is easily detected because of the formation of the heteroduplexes for which an altered melting profile is observed. Because heteroduplexes are less stable than homoduplexes, a loss of fluorescence is observed at lower temperatures than for homoduplexes (Ishikawa et al. 2010; Hondow et al. 2011; Martino et al. 2010). Differences between homozygous samples can be observed as a shift in melting temperature, whereas changes in the shape of the melting curves (which are composites of the homo- and heteroduplex) demonstrate different heterozygous samples (Gundry et al. 2003). Although it is possible to distinguish homozygous mutations from the wild type, sample pooling facilitates the detection of homozygous changes due to the mismatch production between the homozygous mutant and wild-type DNA.
The standard TILLING method with CEL I cleavage is more sensitive for detecting a heterozygous mutation in pooled samples (eightfold) than HRM. Usually up to fivefold pools are used in HRM (Gady et al. 2009; Li et al. 2010), although up to 12-fold pools were used for SNP detection in peach cultivars (Chen and Wilde 2011). The differences in the pooling sizes for which the correct mutation detection is possible are probably due to the different instruments that are used in different studies or in the genome size of the species that is being studied (Chen and Wilde 2011).
In contrast to traditional TILLING with CEL I cleavage in which larger amplicons (up to 1500 bp) can be analysed, HRM is the most sensitive for smaller amplicons (100–400 bp), although PCR products up to 1000 bp have also been analysed. A change of one nucleotide in a 100 bp product affects the melting behaviour more than in 400 bp. In the case of longer (>500 bp) amplicons, there is a possibility that such a product will contain more than one melting domain, and as a result, complex melting curves are produced, and therefore the analyses are much more difficult (Reed and Wittwer 2004). However, melting curves of such a long PCR product can be predicted using uMelt, a web-based application (http://www.dna.utah.edu/umelt/umelt.html).
In this part of the chapter, we present the protocol for high-throughput mutation detection in diploid species using HRM.
2.2 Materials
2.2.1 Mutation Detection Using the HRM Technique
-
1.
DNA isolated from the plants that were tested (as in A2.1 step 1), which were diluted to a 30 ng/μl concentration (see Note 1)
-
2.
Reagent:
-
A ready-made component kit containing High-Resolution Melting Master Mix Version 06 (Roche Cat. No. 04909631001)
-
Primers (for the appropriate designing of primers see Chap. 17 and Notes 2–5)
-
-
3.
Equipment
-
LightCycler® 480 II instrument connected to a computer with LightCycler® 480 Gene Scanning Software Version 1.5.0 SP4 software installed (Roche Diagnostics, GmbH, Mannheim, Germany) (see Note 6)
-
2.3 Methods
2.3.1 Mutation Identification Using the HRM Technique
2.3.1.1 Reaction Preparation and Temperature Cycling
-
1.
Prepare fourfold DNA pools, which will serve as the template for the PCR reactions. DNA from each of four M2 individuals should be mixed in equal amounts.
-
2.
Prepare samples for PCR on a 96-well plate.
PCR components per one sample (20 μl)
Master mix, 2× conc. | 10 μl |
Magnesium chloride solution (25 mM) | 1.6 μl |
Forward/reverse primer mix (4 μM) (see Note 3) | 2.0 μl |
Water, PCR-grade | 4.4 μl |
Fourfold DNA pool (30 ng/μl) | 2.0 μl |
-
3.
Secure samples against evaporation using a foil seal. Avoid putting fingerprints on the foil seal.
-
4.
Before placing the plate into the instrument, spin the plate at 2129 g at 4 °C for 2 min.
-
5.
Place the plate into the LightCycler®.
-
6.
Conduct the reaction using the cycling parameters (optimised individually for each pair of primers):
-
Pre-incubation (initial denaturation):
95 °C for 10 min
-
Amplification (number of steps see Note 7):
-
Denaturation: 95 °C for 10 s
-
Annealing temperature specific to the primer pair for 15 s (see Note 8)
-
Elongation: 72 °C for 10–20 s (see Note 9) with single fluorescence acquisition (see Note 10)
-
-
High-resolution melting:
-
Formation of homo- and heteroduplexes:
95 °C for 1 min
40 °C for 1 min
-
Melting interval (increasing temperature and release of fluorescent dye):
65–95 °C, with continuous fluorescence acquisition (see Note 11)
-
-
2.3.1.2 Analysis of the Results by Gene Scanning
Data analysis can be performed using the LightCycler® 480 Gene Scanning Software Version 1.5.0 SP4 (Roche Diagnostics, GmbH, Mannheim, Germany), which allows the analysis of any differences between the homo- and heterozygous probes. Prior to an analysis, the crossing points for all of the curves should be checked (see Note 12).
-
1.
Mark the stable pre-melt (initial fluorescence, when all DNA samples are double stranded and have 100 % fluorescence) and post-melt (final fluorescence, when all of the amplicons are single stranded and fluorescence is 0 %) regions of all of the samples (Fig. 18.8a). This process permits the elimination of differences in the background fluorescence and the detection of minor differences in the melting profile (see Note 13). In this step, the software algorithm groups the melting curves into clusters according to their similarity (Fig. 18.8b). After the calculation by the software, each group (i.e. genotype) is indicated as a different colour (Fig. 18.8c).
-
2.
Select a reference curve. A sample with a known genotype should be chosen as a reference (usually a sample containing homozygous DNA). This step allows the normalised curves to be subtracted from the base curve and a plot of similar curves that represent the same genotypes to be obtained (Fig. 18.9). In this figure, the differences in the relative fluorescence signal are seen for two groups of curves—the purple curve represents the pool containing DNA that has a mutation, and the blue curves represent the DNA pools that have no mutation.
-
3.
In the next step, create the difference plots for single DNA pools. A difference plot that shows a slight relative difference of fluorescence between a reference sample (the horizontal blue line) and a DNA pool (a blue curve) is presented in Fig. 18.10a. The slight difference in fluorescence (value of ~4.4) indicates that the DNA pool does not contain any mutation. In Fig. 18.10b, the difference in fluorescence between the reference sample (the horizontal blue line) and the fourfold DNA pool (represented by a purple curve) is significant (value of ~29), which indicates that the pool contains DNA with a mutation. In Fig. 18.10c, two curves are seen—the purple one represents a pool that contains a mutation, and the blue one represents a DNA pool without mutation. The differences between these two curves are clearly visible.
Fig. 18.8 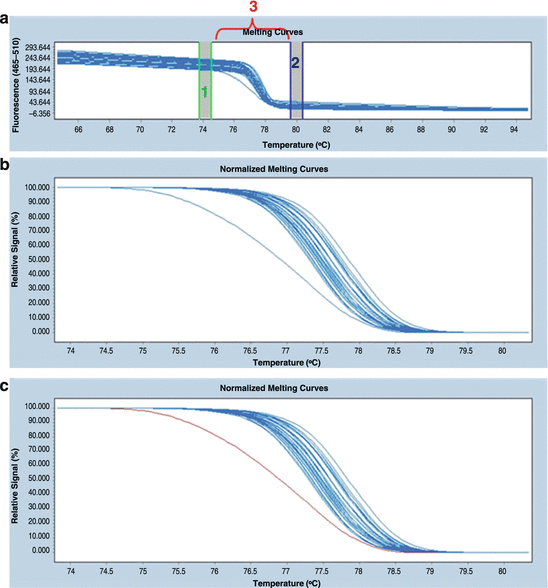
Normalisation of the raw melting curves. (a) The graph presents the pre- and post-melting regions. The area between the vertical green lines defines the pre-melt region (1), whereas the blue lines define the post-melt region (2). The region that was designated for analysis (3) is located between the pre-melt and post-melt areas. (b) The graph presents the correlation between fluorescence change and the temperature. Differences between the genotypes are visible. (c) After the calculation two groups as indicated by different colours (blue and purple) can be seen
Fig. 18.9 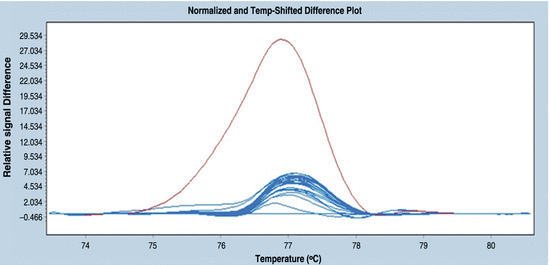
An example of a difference plot. Normalised difference plot for 40 (in this case all of the samples that were analysed) fourfold pools, the wild types are indicated in blue, and the pool containing a mutation is indicated in purple. The wild type was selected as the base curve (blue horizontal line)
Fig. 18.10 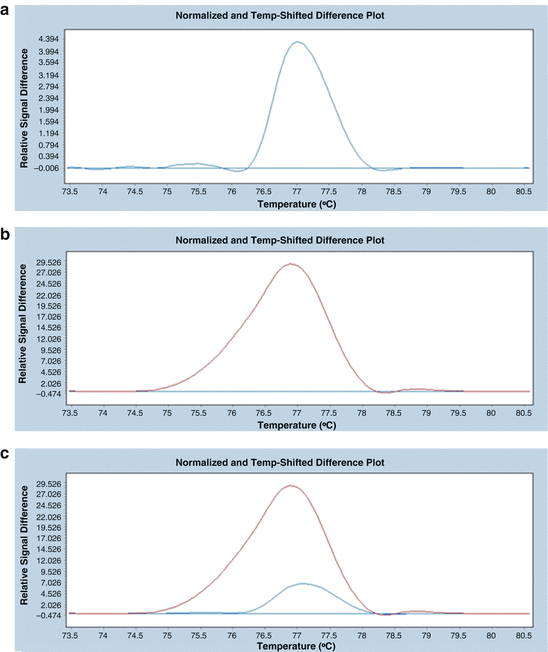
An example of a difference plot. In each case, the reference sample is indicated as a horizontal blue line. (a) A normalised difference plot for a single fourfold DNA pool without a mutation (blue). (b) A normalised difference plot for a fourfold DNA pool that contains DNA with a mutation (purple). (c) A normalised difference plot for two fourfold pools—a pool without a mutation (blue) and a DNA pool containing a mutation (purple)


2.3.1.3 Identification of a Particular M2 Individual Carrying a Mutation
-
1.
Prepare twofold DNA pools containing the DNA of each plant from the positive pool (pool with mutation) mixed with the wild-type DNA.
-
2.
Perform PCR amplification as in B3.3.2, but using twofold DNA pools as the templates.
-
3.
In order to indicate potential mutants, perform an analysis of the results according to the instructions that are attached to the LightCycler® 480 Gene Scanning Software.
-
4.
Confirm a potential mutation by sequencing the fragment being analysed for the identified M2 individuals.
2.4 Notes
-
1.
In order to avoid reaction-to-reaction variability, use the same procedure to extract the DNA from every sample. Moreover, the variability can be also reduced by using a nested (two-round) PCR for amplicon production. This is often an essential step in polyploid species as there may be insufficient polymorphism between homoeologues to generate specific primers (Botticella et al. 2011).
-
2.
Use a relatively low primer concentration to avoid dimerisation of the primers.
-
3.
The annealing temperature of the designed primers should be around 60 °C. The melting temperature is calculated according to the Bolton and McCarthy formula (Sambrook et al. 1989). It is important to note that the melting temperature depends on the type of applied polymerase (e.g. Phusion or Phire DNA polymerase, Taq-based DNA polymerase) and the use of an appropriate TM algorithm.
-
4.
Blast your primers in order to check their specificity to the sequence that is being analysed.
-
5.
Use only highly purified primers (e.g. HPLC purified).
-
6.
Other HRM-compatible qPCR instruments can be used, e.g. Rotor-Gene Q with HRM (Qiagen) or LightScanner (Idaho Technology). Moreover, it is possible to perform the PCR reaction on routine thermal cyclers and then use the special HRM equipment for analysis of melting curves.
-
7.
For most analyses, 45 cycles are suitable.
-
8.
If you do not know the exact melting temperatures of your primers, use the touchdown PCR protocol, for which a wide spectrum of annealing temperatures is used. For detailed information, see the supplier’s protocol.
-
9.
The elongation time (in seconds) should be calculated as follows—amplicon length divided by 25.
-
10.
Fluorescence data are acquired at the end of this step.
-
11.
Fluorescence data are acquired continuously (characteristic setting for melting analysis).
-
12.
Check crossing point (Cp)—for all of the samples that are being analysed. It should be below 30 cycles. Curves that represent all of the samples should reach a similar plateau height (the phase in which the amount of product does not change because of the depletion of the primers and nucleotides). You can also calculate the efficiency of the reaction for all of the samples that are being tested.
-
13.
The pre- and post-melt regions that are selected should cover about a 1 °C interval before melting (after fluorescence begins to drop) and after melting is completed for all of the samples.
References
Botticella E, Sestili F, Hernandez-Lopez A, Phillips A, Lafiandra D (2011) High resolution melting analysis for the detection of EMS induced mutations in wheat SbeIIa genes. BMC Plant Biol 11:156
Chawade A, Sikora P, Brautigam M, Larsson M, Vivekanand V, Nakash MA, Chen T, Olsson O (2010) Development and characterization of an oat TILLING-population and identification of mutations in lignin and beta-glucan biosynthesis genes. BMC Plant Biol 10:86–98
Chen Y, Wilde HD (2011) Mutation scanning of peach floral genes. BMC Plant Biol 11:96
Colbert T, Till BJ, Tompa R, Reynolds S, Steine M, Yeung AT, McCallum CM, Comai L, Henikoff S (2001) High-throughput screening for induced point mutations. Plant Physiol 126:480–484
Doyle JJ, Doyle JL (1987) A rapid DNA isolation procedure for small quantities of fresh leaf tissue. Phytochem Bull 19:11–15
Ezgu F, Divanoglu Y, Polat M, Bahceci S, Hasanoglu A, Desnick RJ (2014) Rapid molecular diagnosis of genetic diseases by high resolution melting analysis: Fabry and glycogen storage 1 A diseases. Genet Test Mol Biomark 18:3–7
Gady ALF, Hermans FWK, Van de Wal MHBJ, van Loo EN, Visser RGF, Bachem CWB (2009) Implementation of two high through-put techniques in a novel application: detecting point mutations in large EMS mutated plant populations. Plant Methods 5:13
Gottwald S, Bauer P, Komatsuda T, Lundqvist U, Stein N (2009) TILLING in the two-rowed cultivar ‘Barke’ reveals preferred sites of functional diversity in the gene HvHox1. BMC Res Notes 2:258
Gundry CN, Vandersteen JG, Reed GH, Pryor RJ, Chen J, Wittwer CT (2003) Amplicon melting analysis with labeled primers: a closed-tube method for differentiating homozygotes and heterozygotes. Clin Chem 49:396–406
Hestekin CN, Barron AE (2006) The potential of electrophoretic mobility shift assays for clinical mutation detection. Electrophoresis 19:3805–3815
Hondow HL, Fox SB, Mitchell G, Scott RJ, Beshay V, Wong SQ, kConFab Investigators, Dobrovic A (2011) A high-throughput protocol for mutation scanning of the BRCA1 and BRCA2 genes. BMC Cancer 11:265
International Barley Genome Sequencing Consortium, KF M, Waugh R, JW B, Schulman A, Langridge P, Platzer M, GB F, GJ M, Sato K, TJ C, RP W, Stein N (2012) A physical, genetic and functional sequence assembly of the barley genome. Nature 491:711–716
Ishikawa T, Kamei Y, Otozai S, Kim J, Sato A, Kuwahara Y, Tanaka M, Deguchi T, Inohara H, Tsujimura T, Todo T (2010) High-resolution melting curve analysis for rapid detection of mutations in a Medaka TILLING library. BMC Mol Biol 11:70
Kurowska M, Daszkowska-Golec A, Gruszka D, Marzec M, Szurman M, Szarejko I, Maluszynski M (2011) TILLING – a shortcut in functional genomics. J Appl Genet 52:371–390
Lehmensiek A, Sutherland MW, McNamara RB (2008) The use of high resolution melting (HRM) to map single nucleotide polymorphism markers linked to a covered smut resistance gene in barley. Theor Appl Genet 117:721–728
Li YD, Chu ZZ, Liu XG, Jing HC, Liu YG, Hao DY (2010) A cost-effective high-resolution melting approach using the EvaGreen dye for DNA polymorphism detection and genotyping in plants. J Integr Plant Biol 52:1036–1042
Li J, Wang X, Dong R, Yang Y, Zhou J, Yu C, Cheng Y, Yan C, Chen J (2011) Evaluation of high-resolution melting for gene mapping in rice. Plant Mol Biol Rep 29:979–985
Lochlainn SO, Amoah S, Graham NS, Alamer K, Rios JJ, Kurup S, Stoute A, Hammond JP, Ostergaard L, King GJ, White PJ, Broadley MR (2011) High-resolution melt (HRM) analysis is an efficient tool to genotype EMS mutants in complex crop genomes. Plant Methods 7:43
Martino A, Mancuso T, Rossi AM (2010) Application of high-resolution melting to large-scale, high-throughput SNP genotyping: a comparison with the TaqMan® method. J Biomol Screen 15:623–629
McCallum CM, Comai L, Greene EA, Henikoff S (2000) Targeted screening for induced mutations. Nat Biotechnol 18:455–457
Milner SG, Ferradini N, Nicolia A, Veronesi F, Salvi S, Rosellini D (2014) Copy number estimation of a plant-derived selectable marker gene by high resolution melting analysis: a tool to simplify transgenic plant breeding. Crop Sci 54:1133–1138
Minoia S, Petrozza A, D’Onofrio O, Piron F, Mosca G, Sozio G, Cellini F, Bendahmane A, Carriero F (2010) A new mutant genetic resource for tomato crop improvement by TILLING technology. BMC Res Notes 3:69
Reed GH, Wittwer CT (2004) Sensitivity and specificity of single-nucleotide polymorphism scanning by high-resolution melting analysis. Clin Chem 50:1748–1754
Sambrook J, Fritsch EF, Maniatis T (1989) Molecular cloning: a laboratory manual. CSHL Press, New York, pp. 11–46
Shu QY, Shirasawa K, Hoffmann M, Hurlebaus J, Nishio T (2012) Molecular techniques and methods for mutation detection and screening in plants. In: Shu QY, Forster BP, Nakagawa H (eds) Plant mutation breeding and biotechnology. CABI and FAO, Oxfordshire, pp. 241–256
Till BJ, Burtner C, Comai L, Henikoff S (2004) Mismatch cleavage by single-strand specific nucleases. Nucleic Acids Res 32:e99
Till BJ, Zerr T, Comai L, Henikoff S (2006a) A protocol for TILLING and Ecotilling in plants and animals. Nat Protoc 1:2465–2477
Till BJ, Zerr T, Bowers E, Greene EA, Comai L, Henikoff S (2006b) High-throughput discovery of rare human nucleotide polymorphisms by Ecotilling. Nucleic Acids Res 34:e99
Triques K, Sturbois B, Gallais S, Dalmaia M, Chauvin S, Clepet C, Aubourg S, Rameau C, Caboche M, Bendahmane A (2007) Characterization of Arabidopsis thaliana mismatch specific endonucleases: application to mutation discovery by TILLING in pea. Plant J 51:1116–1125
Triques K, Piednoir E, Dalmais M, Schmidt J, Le Signor C, Sharkey M, Caboche M, Sturbois B, Bendahmane A (2008) Mutation detection using ENDO1: application to disease diagnostics in humans and TILLING and Eco-TILLING in plants. BMC Mol Biol 9:42
Uauy C, Paraiso F, Colasuonno P, Tran RK, Tsai H, Berardi S, Comai L, Dubcovsky J (2009) A modified TILLING approach to detect induced mutations in tetraploid and hexaploid wheat. BMC Plant Biol 9:115–128
Wang TL, Uauy C, Robson F, Till B (2012) TILLING in extremis. Plant Biotechnol J 10:761–772
Wienholds E, van Eeden F, Kosters M, Mudde J, Plasterk RHA, Cuppen E (2003) Efficient target-selected mutagenesis in zebrafish. Genome Res 13:2700–2707
Wojdacz TK, Dobrovic A (2007) Methylation-sensitive high resolution melting (MS-HRM): a new approach for sensitive and high-throughput assessment of methylation. Nucleic Acids Res 35:e41
Acknowledgements
Funding for this work was provided by the National Centre for Research and Development (Grant No. PBZ-MNiSW-2/3/2006/8), European Regional Development Fund through the Innovative Economy for Poland 2007–2013, project WND-POIG.01.03.01-00-101/08 POLAPGEN-BD task 22, the Food and Agriculture Organization of the United Nations and the International Atomic Energy Agency through their Joint FAO/IAEA Programme of Nuclear Techniques in Food and Agriculture through Research Contract No. 15419 of IAEA Coordinated Research Project D24012 and the Polish Ministry of Science and Higher Education (Grant No. 2080/IAEA/2011/0, 2557/FAO/IAEA/2012/0, 2904/FAO/IAEA/2013/0).
Author information
Authors and Affiliations
Corresponding author
Editor information
Editors and Affiliations
Rights and permissions
Open Access This chapter is distributed under the terms of the Creative Commons Attribution-Noncommercial 2.5 License (http://creativecommons.org/licenses/by-nc/2.5/) which permits any noncommercial use, distribution, and reproduction in any medium, provided the original author(s) and source are credited.
The images or other third party material in this chapter are included in the work’s Creative Commons license, unless indicated otherwise in the credit line; if such material is not included in the work’s Creative Commons license and the respective action is not permitted by statutory regulation, users will need to obtain permission from the license holder to duplicate, adapt or reproduce the material.
Copyright information
© 2017 International Atomic Energy Agency
About this chapter
Cite this chapter
Szurman-Zubrzycka, M., Chmielewska, B., Gajewska, P., Szarejko, I. (2017). Mutation Detection by Analysis of DNA Heteroduplexes in TILLING Populations of Diploid Species. In: Jankowicz-Cieslak, J., Tai, T., Kumlehn, J., Till, B. (eds) Biotechnologies for Plant Mutation Breeding. Springer, Cham. https://doi.org/10.1007/978-3-319-45021-6_18
Download citation
DOI: https://doi.org/10.1007/978-3-319-45021-6_18
Published:
Publisher Name: Springer, Cham
Print ISBN: 978-3-319-45019-3
Online ISBN: 978-3-319-45021-6
eBook Packages: Biomedical and Life SciencesBiomedical and Life Sciences (R0)