
Abstract
Land degradation is a major challenge for agricultural and rural development in Uzbekistan. Our research findings indicate that the costs of land degradation in Uzbekistan are substantial; reaching about 0.85 billion USD annually resulting from the loss of valuable land ecosystem services due to land use and land cover changes alone between 2001 and 2009. On the other hand, economic simulations also show that the returns from actions to address land degradation can be four times higher their costs over a 30-year planning horizon, i.e. every dollar invested into land rehabilitation can yield 4 dollars of returns over this period. The priority geographic locations for actions against land degradation are suggested to be Karakalpakstan, Buhoro and Syrdaryo provinces of Uzbekistan, where the returns from actions are the biggest. The econometric analysis of a nationally representative survey of agricultural producers shows that national policies could enhance the uptake of sustainable land management practices by increasing crop diversification, securing land tenure and creating non-farm jobs in rural areas.
You have full access to this open access chapter, Download chapter PDF
Keywords
Introduction
Land degradation is a severe economic and environmental challenge for Uzbekistan. It occurs in many agro-ecological zones of the country, leading to negative consequences on crop and livestock production, agricultural incomes, and rural livelihoods (Pender et al. 2009). The major types of land degradation in Uzbekistan are secondary salinization, soil erosion and desertification (Gupta et al. 2009). Due to the arid climate, agricultural production in most of the country is possible only with irrigation. Presently, the irrigated areas extend to about 4.3 million ha (CACILM 2006), whereas the rainfed arable lands occupy 0.8 mln ha, or only about a fifth of the irrigated lands (ICARDA 2003). The rangelands are the biggest land cover type in the country, stretching to about 24 mln ha (CACILM 2006), more than a half of the total territory of Uzbekistan . The latest estimates indicate that about 26 % of croplands and 17 % of rangelands have experienced considerable degradation during the last three decades (Le et al. 2014).
Land degradation is acknowledged as one of the major problems for the sustainable development in Uzbekistan , and the Central Asian region, as a whole. In this context, there have been numerous efforts to address land degradation, especially in terms of investments in repair and better maintenance of drainage and irrigation systems, and promoting more sustainable agricultural practices (Gupta et al. 2009; Pender et al. 2009; Kienzler et al. 2012). For example, within the next five years till 2020, the government of Uzbekistan is planning to allocate more than 1 billion USD for maintenance and modernization of the irrigation and drainage system in the country (ICTSD 2014). Despite the wide and growing publicity about land degradation in the country, as well as a long history of rich qualitative and expert-opinion based research on economic aspects of land degradation, there are not many quantitative studies assessing the costs and drivers of land degradation in the country. To fill this gap, and to scientifically support the national investments and policy actions to combat land degradation, this study seeks to find answers to the following three research questions:
-
1.
What are the key causes of land degradation in Uzbekistan ?
-
2.
What are the economic costs of land degradation and net benefits of actions against degradation compared to inaction?
-
3.
What are the feasible policy and development strategies that enable and catalyze sustainable land management (SLM) in the country?
This research on Economics of Land Degradation (ELD) in Uzbekistan seeks to test two hypotheses. Firstly, we test which factors, such as climate and agricultural practices, population density, income levels, land tenure , market access and others, are significantly influencing land degradation and adoption of sustainable land management practices. Secondly, we also hypothesize that benefit of taking action against land degradation through sustainable land management (SLM) measures is greater than the costs of inaction. The rest of the chapter is structured in the following way: first, we review the literature and present the background information on the extent, types, drivers and impacts of land degradation in Uzbekistan . Secondly, we provide an overview of the conceptual framework and the methodologies applied in this study, without, however, being detailed as the study follows the same concepts and methods already presented thoroughly in Chaps. 2, 6 and 7 of this volume. We dwell more on those aspects of the methodology which are unique to this chapter. Thirdly, we describe the data used in the study. Finally, we present the results and conclude.
Literature Review and Background Information on Land Degradation in Uzbekistan
In Uzbekistan, agriculture accounts for about 20 % of the gross domestic product (GDP) and employs one third of the active labor force (Sutton et al. 2007). However, land degradation has been a crucial factor negatively affecting rural living standards (CACILM 2006). The annual costs associated with land degradation in Uzbekistan are estimated to amount to about 1 billion USD (Sutton et al. 2007). Most degraded areas are concentrated in the lowlands of the Amudarya river (Horazm and Karakalpakstan) and in Bukhara, Navoi, Kashkadarya and Fergana provinces (Fig. 21.1).

Biomass-based identification of land degradation hotspots in Uzbekistan (in red). Source Le et al. (2014)
Figure 21.1 shows the land degradation hotspot areas (in red) in Uzbekistan based on the change in the surface vegetation between 1982 and 1984 (baseline) and 2006 (endline) (Le et al. 2014, Chap. 4). As indicated earlier, these land degradation hotspots cover about 26 % of the area of croplands and 17 % of rangelands in Uzbekistan (Le et al. 2014).
Types of Land Degradation
In Uzbekistan , land degradation occurs mostly as secondary salinization, rangeland degradation and desertification, as well as soil erosion (Gupta et al. 2009). Negative environmental impacts due to land degradation include the drying up of the Aral Sea, water and air pollution caused by salinization and erosion, which result in the loss of biodiversity and reduction of land ecosystem services (Nkonya et al. 2011).
Soil Erosion
Soil erosion due to poor agricultural practices are estimated to be occurring in about 800,000 ha of irrigated croplands, with annual soil losses of up to 80 tons per ha of fertile topsoil (CACILM 2006; Pender et al. 2009). More than 50 % of farmlands in Uzbekistan are estimated to be affected, to different degrees, by wind erosion (CACILM 2006; Pender et al. 2009). About 19 % of the irrigated area of Uzbekistan is affected by water erosion (Bucknall et al. 2003). Strong wind activity, ploughing of sloping lands, inappropriate irrigation and livestock grazing practices have resulted in a vast erosion of soils (ICARDA 2003). Common cropping practices: usually leaving open the soil between rows of cotton or wheat and involving intensive tillage, expose the soil to significant erosion (Nkonya et al. 2011). Furrow irrigation may result in soil erosion in areas with inadequate land leveling (World Bank 2003).
Salinization
In the irrigated cropland areas of Uzbekistan , salinity is a major problem (Pender et al. 2009). Reportedly, up to 53 % of irrigated lands are exposed to varying degrees of soil salinity in the country, leading to low or no profits from annual crops (Djanibekov et al. 2012b; Table 21.1). Each year, waterlogging and salinization result in a loss of about 30,000 ha of land in Uzbekistan (Bucknall et al. 2003; Pender et al. 2009). In the areas near the former Aral Sea: 90–94 % of the irrigated lands in Karakalpakstan, Horazm and Bukhara provinces of Uzbekistan are salinized (Bucknall, et al. 2003; Pender et al. 2009).
Inappropriate irrigation practices are the major cause of secondary soil salinization (ICARDA 2003). The presence of shallow groundwater tables is another major factor contributing to the salinization of irrigated lands. This leads to wide spread waterlogging and salinity problems. Moreover, the existence of shallow groundwater tables due to malfunctioning of surface and subsurface drainage systems makes this leaching practice more unsustainable (Abdullaev 2005).
Overgrazing
The area of pastures in Uzbekistan is about half of the country’s total territory (24 million ha) (ICARDA 2003). Most of the rangelands are located in Kashkadarya, Samarkand and Jizzah provinces (ibid.). In Uzbekistan, during the past decades, there has been an extensive degradation of pasture lands, due to unsustainable use of pastures for livestock grazing, lack of maintenance of pastures and other human activities (ibid.). About 10 million ha (42 %) of rangelands have been estimated by to be degraded (CACILM 2006). However, the analysis of the remotely sensed satellite data shows only 17 % of rangelands in the country have shown a vegetation decline between 1982 and 2006 (Le et al. 2014). Overgrazing is one of the major causes of rangeland degradation in the country. The area of rainfed rangelands has considerably decreased due to overgrazing and deforestation. The National Programming Frameworks for the Central Asian countries (CACILM 2006) provide a comprehensive list of causes of rangeland degradation, including among others “overgrazing, cutting of shrubs, land abandonment, overstocking, lack of maintenance of rangeland infrastructure, lack of economic and organizational capacity among farmers, and limited awareness of rangeland degradation issues and approaches” (Pender et al. 2009).
Spatial Assessments of Land Degradation in Uzbekistan
Despite the recognized severity of land degradation in Uzbekistan , there are few published studies on spatial assessment of this problem (Ji 2008). Kharin et al. (1999 cited in Ji 2008) created a land degradation map of 4 by 4 arc-minutes based on expert opinions and existing soil maps. It shows that land degradation is generally present throughout Uzbekistan, and that it is differentiated by land-use type and degradation cause. Based on these data, desertification is mainly characterized by vegetation cover degradation in rangelands and meadows. Given the fact that this map is partly based on expert opinion, objective and updated assessment is necessary. The spatial assessment of land degradation was also performed by Dubovyk et al. (2013b, c) for Khorezm, one of the most land degradation affected regions of Uzbekistan. The authors find that land productivity decline, calculated from the 250 m Moderate Resolution Imaging Spectroradiometer (MODIS ) satellite data on normalized difference vegetation index (NDVI) time series for the monitoring period between 2000 and 2010, affects 23 % (94,835 ha) of the arable area in the study region. Le et al. (2014) have indicated a similar number of 26 % of croplands being degraded in Uzbekistan based on the trend analysis of 8 km Advanced Very High Resolution Radiometer (AVHRR) satellite data series for 1982–2006. Moreover, Dubovyk et al. (2013a) conducted a spatial logistic regression modeling to determine main factors of distribution of degraded croplands in Khorezm region. The results of the statistical modeling suggest that the degradation processes were mainly determined by groundwater table and groundwater salinity, land use, slope, and irrigation water availability.
There have been more studies on land use and cover changes (LUCC) in the region. For example, Chen et al. (2013) assessed changes in LUCC and ecosystem services in Central Asia during 1990–2009. Klein et al. (2012) presented a classification approach for regional land-cover mapping of Central Asia. Spatial analyses on the aeolian geomorphic processes of the Central Asia were conducted by Maman et al. (2011). Kariyeva and Van Leeuwen (2011) studied environmental drivers of vegetation phenology in Central Asia based on the normalized difference vegetation index (NDVI ) calculated from the AQUA/TERRA-MODIS NDVI and NOAA-AVHRR NDVI time series (1981–2008). Spatial cropping patterns were observed in the Horazm region in Uzbekistan (Conrad et al. 2011, 2014). Inter-annual changes in vegetation activities and their relationship to temperature and precipitation in Central Asia from 1982 to 2003 were analyzed by Propastin et al. (2008). Yet cropland degradation per se and the relevant aspects for assessing, for instance, relations between the degradation and their possible drivers have not been studied within quantitative data-based frameworks in Uzbekistan.
Drivers of Land Degradation
The major reasons of land degradation, especially soil salinization in the country, are thought to be outdated drainage systems and excessive irrigation application in crop production couple with inadequate agronomic practices (Abdullaev et al. 2005). Leaching of salts from crop fields is not providing with a sustainable solution as it exacerbates the problem of water scarcity (Abdullaev et al. 2005). Using water resources more efficiently is constrained by existing agricultural policies limiting crop choice and diversification (Djanibekov et al. 2013a; Bobojonov et al. 2012). Akramkhanov et al. (2011) found a correlation with distance to drainage collectors and the groundwater parameters. Dubovyk et al. (2013a) found that cropland degradation is mainly linked to the level of the groundwater table, land-use intensity, low soil quality, slope, and salinity of the groundwater. The previous studies above have thus mostly concentrated on proximate drivers of land degradation, whereas there have been very little actual data based analyses of the effects of underlying drivers of land degradation, such as the role of access to markets , land tenure security, the availability of extension services and others. This is the gap that we intend to fill in the present study.
Impacts of Land Degradation and Sustainable Land Management
Very few studies have so far attempted to estimate the economic costs of land degradation in Uzbekistan . For instance, the Project Document of the GEF/World Bank Aral Sea Basin Program calculates the costs due to salinization in Uzbekistan at US$ 250/ha (ICARDA 2003).Footnote 1 According to the World Bank, inadequate irrigation and drainage systems, and the resulting soil salinization are leading to about 1 billion USD of losses annually in the country (ICARDA 2003).Footnote 2 Another back of the envelope calculation, based on Khusanov (2009), indicates that the reduction in soil quality between 1990 and 2005 resulted in lower cotton and wheat yields equivalent to annual losses of 130–140 mln USD. Gupta et al. (2009) review that the annual losses in agricultural production due to soil salinization might be about US$ 31 million, and economic losses due to land abandonment at US$ 12 million. Nkonya et al. (2011) assessed the economic impact of soil salinity and soil erosion on wheat and cotton production. The authors conclude that the same level of salinity has a greater economic impact on wheat than on cotton. Nkonya et al. (2011) estimated that the annual economic loss of salinity for wheat and cotton alone is $13.29 million. From their simulations, the authors conclude that the most pressing issue is salinity on wheat and that resources should first be devoted to the affected lands where these two strategically and economically important crops are cultivated usually in rotation.
In addition to national level studies, there have been studies looking at the impacts of land degradation in the specific regions of the country. Djanibekov et al. (2012b) concluded that cultivation of major crops such as cotton and wheat on degraded soils in Khorezm province result in profit losses for farmers. ICARDA has evaluated the impact of salinity on rural livelihoods in Syrdarya province, Uzbekistan (ICARDA 2007). The salinity was found to have had a noticeable impact on the agricultural productivity in the area. All other factors being equal, with the price of raw cotton at around 300 USD/t, farmers in the high and medium salinity zones lost on average 116 USD/ha and 77 USD/ha, respectively, as compared to farmers operating land with low salinity. In the case of wheat, at a price of 100 USD/t, farmers in the high and medium salinity zones lost on average 149 USD/ha and 66 USD/ha as compared to low salinity group farmers because of salinity.
The above literature review on the impacts of land degradation indicates that most previous studies were estimating only the losses in provisional and market-priced ecosystem goods and services, while ignoring the non-provisional, indirect ecosystems services of land reduced due to land degradation, such as, for example, carbon sequestration. In the present, we seek to fill this gap by including the value of both direct and indirect ecosystem services into our analyses.
Land Policies in Uzbekistan
After becoming independent in 1991, Uzbekistan started reforming its national economy and agriculture. It was a challenging issue due to the need to completely change from the centrally planned to the market oriented economy. Given that a larger part of the population in the country is rural, reforms in the agricultural sector were the most complicated. Former collective farms had been transformed to cooperatives and joint-stock companies by 1994 (Khan 1996). In addition, there were individual farming units consisting of farmer enterprises (legal entities) and household plots (Bloch 2002). Uzbekistan has not introduced private ownership for agricultural land (Akramov and Omuraliev 2009), but since 1994, land was leased for long periods of time to individual farming enterprises (Republic of Uzbekistan 1994) through dismantlement of cooperatives and joint-stock companies. By 1997, there were nearly 20,000 individual farmers, with an average landholding of 16 ha (Spoor 1999). Their number peaked at 217,000 farms, but later the state farm optimization program led to a consolidation of farmlands with about 70,000 farmers with an average 30 ha of cropland as of year 2014. Presently, there are two major types of agricultural producers in the country: farmers and household plot owners. The land operated by farmers is leased from the State for a certain period of time, whereas the land under household plots (much smaller than the lands operated by farmers, usually less than a hectare) is given for indefinite use with the right to bequeath to children, so enjoys a higher level of tenure security. Cotton and wheat (two major crops, occupying most of the cropped area) in Uzbekistan are mostly produced in individual farming enterprises (all cooperatives and joint stock companies in crop production have been dismantled), whereas the bulk of fruits and vegetables are produced by rural households in their household plots. The Government regulates and controls the production and marketing for cotton and wheat, whereas the production of other crops, mainly fruits and vegetables by the rural population in their household plots are based on free market mechanisms.
Conceptual Basis
The conceptual framework of the case study follows the Economics of Land Degradation (ELD) conceptual framework presented in Chap. 2 and in Nkonya et al. (2013). The major characteristic of this framework is that it seeks to apply the Total Economic Value (TEV) approach in the assessment of the costs of land degradation, which implies that the ELD conceptual framework seeks to incorporate the value of not only provisional ecosystem goods and services into its analysis (e.g. crop yields and livestock products), but also of the value of indirect ecosystem services such as supporting, regulating and cultural services (e.g. carbon sequestration, nutrient cycling), option values, as well as non-use values. The elements of this conceptual framework are described in detail in Chap. 2. The ELD conceptual framework divides the causes of land degradation into proximate and underlying, which interact with each other to result in different levels of land degradation. Proximate causes include biophysical factors and unsustainable land management practices, whereas underlying causes include socio-economic and institutional factors such as land tenure security, access to markets , population density, poverty and others (Chaps. 2 and 7).
Methodology and Data Sources
Cost of Inaction
The methodology applied recognizes that land degradation occurs in two ways (Chap. 6). First, through shifts in land use/cover from more economically and environmentally productive (in terms of provision of ecosystem services) land uses/covers to those which have lower economic and environmental productivity. For example, from croplands to barren lands, or from forests to shrublands. The second, and more widely associated mechanism of land degradation, is when land use itself does not change, but the productivity of that land use decreases due to soil and land degradation. For example, secondary salinization leads to lower crop yields in irrigated croplands, even if these croplands do not shift to any other land use/cover.
Cost of Action
The approach for determining the cost of action for degradation due to land use and cover change (LUCC) has to consider the cost of reestablishing the high value biome lost and the opportunity cost of foregoing the benefits drawn from the lower value biome that is being replaced. For example, if a forest was replaced with cropland , the cost of planting trees or allowing natural regeneration (if still feasible) and cost of maintaining the new plantation or protecting the trees until they reach maturity has to be taken into account. Additionally, the opportunity cost of the crops being foregone to replant trees or allow natural regeneration has to be also taken into account. A detailed elaboration of the methodologies for calculating the costs of action versus in action applied in this study is given in Chap. 6.
Drivers of Sustainable Land Management
Land degradation usually occurs due to lack of use of sustainable land management (SLM) practices. Those factors preventing households from adopting SLM practices are also likely to cause land degradation. Therefore, analyzing the drivers of SLM is similar in its implications as analyzing the drivers of land degradation. In our empirical approach we apply the following reduced form econometric model to a nationally representative agricultural household survey data from Uzbekistan.
where,, etc.);
- A:
-
the number of adopted SLM technologies
- x1 :
-
a vector of biophysical factors (e.g. climate conditions, agro-ecological zones, etc.);
- x2 :
-
a vector of policy-related and institutional factors (e.g. market access, land tenure
- x3 :
-
a vector of variables representing access to rural services (e.g. access to extension);
- x4 :
-
vector of variables representing rural household level capital endowment, level of education, household size, dependency ratio, etc.;
- zi :
-
vector of country fixed effects.
The dependent variable, A, is the number of sustainable land management technologies adopted by agricultural households in the country, as compiled through the agricultural household surveys, described below. In the survey, the households were asked to indicate the SLM technologies they use. They were given an open-ended list of about 30 SLM technologies, including such options as mulching, terracing, applying manure, planting cover crops, minimum or zero tillage, rotational grazing of livestock , etc., with the last option to add any others they use but not listed. We check the robustness of our findings on the role of various factors in affecting sustainable land management through different models in addition to the one elaborated above (Table 21.2). The explanatory variables in all of these models are the same as in model specification formula 21.1, however, the dependent variable and the estimation approaches do change (Table 21.2).
-
In Model 1, the distribution of the number of SLM technologies used is quite dispersed, ranging from 0 to 12 (Fig. 21.2). However, if we look at individual provinces, the conditional variance of the distribution is smaller in all cases than the conditional mean (Table 21.3). Furthermore, the dependent variable on the number of SLM technologies used is a count variable. Such a nature of the dependent variable requires the application of Poisson regression.
Fig. 21.2 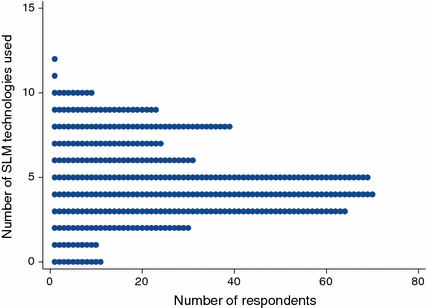
The frequency of SLM technologies use among respondents
Table 21.3 The conditional mean and conditional variance of the number of SLM technologies used -
Model 2 uses the land degradation dummy indicator based on Le et al. (2014), who use the time series of GIMMS NDVI , to identify the hotspots of land degradation. In doing so, they also account for the masking effects of rainfall dynamics and atmospheric fertilization (Chap. 4). This variable shows the areas with negative difference in the NDVI, i.e. areas with NDVI decline between the baseline of 1982–84 and the end line of 2006. As we can see from the distribution, over 40 % of land plots were degraded and none of the households had improvement on their land plots in the period between 1982 and 2006 (Fig. 21.3). Bivariate choice nature of the dependent variable leads us to the use of logistic regression as the estimation method.
Fig. 21.3 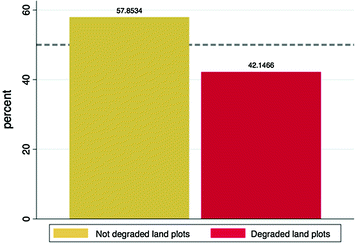
The distribution of the land degradation indicator among households in Uzbekistan
-
In Model 3, plot-level soil fertility as perceived by farmers themselves is taken as the explained variable. In the household survey analyzed, the respondents were asked to rate their land plots into three categories: 1-very fertile, 2-moderate, 3-poor (Fig. 21.4). Distribution shows that most of the farmers (66 %) rate their land plots to be moderately fertile. The dependent variable is a categorical ordinal variable where the ordering of ranks is uncertain. For this nature of variable, stereotype logistic regression needs to be used (Mirzabaev 2013).
Fig. 21.4 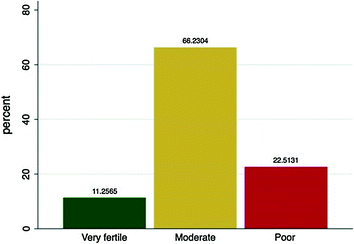
The distribution of the index of soil fertility based on farmer’s perception
-
Model 4 employs cotton yields as its dependent variable. The cotton yields were reported separately for each plot. Average yields weighted by plot size are used as the left-hand side variable (Fig. 21.5). The limitation of this model is the reduced sample size as only 135 of the 400 respondents grow cotton.
Fig. 21.5 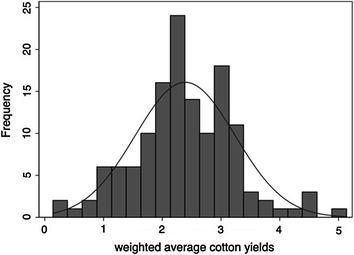
The distribution of cotton yields among 135 large farms in Uzbekistan


In all of the models, the choice of explanatory variables is based on theoretical grounds and previous research, such as those indicated in Chaps. 2 and 7. Various appropriate interactions and nonlinear relationships among specific variables are also tested.
Data and Materials
Moderate Resolution Imaging Spectroradiometer (MODIS) remotely sensed datasets on land cover are used to identify the shifts in land use and land cover in Uzbekistan between 2001 and 2009. These include forests, grassland, cropland , shrublands (including woodlands), urban areas, barren land, and water bodies. The MODIS land cover dataset is ground truthed and quality controlled (Friedl et al. 2010), with overall accuracy of land use classification at 75 % (ibid.).
Following this analysis of land-use and land-cover change, total economic values are assigned to each land use and land cover using our own local contingent valuation of the value of ecosystem services in Uzbekistan through community focus group discussions and also using the data on the value of ecosystem services compiled from about 300 case studies in the Economics of Ecosystems and Biodiversity (TEEB) database (Van der Ploeg and de Groot 2010), as computed in Chap. 6 for each country of the world using the benefit transfer approach, whereby missing values of ecosystem services for Uzbekistan were imputed from other neighboring Asian countries. The communities for the focus group discussions were selected from both areas shown to have experienced NDVI declines during the last three decades and those which have experienced NDVI improvements during the same period (Le et al. 2014). Moreover, the selection of the communities also strived to capture all major land use/land cover categories in the country. The relevant data for Uzbekistan on the costs of action for re-establishing the higher value biomes is also obtained from the global level database on the costs of action developed in Chap. 6 of this volume.
Local Contingent Valuation
Focus Group Discussions (FGD ) with stakeholders on the community level were organized in 6 specifically selected communities. Four stratified polygons were allocated across Uzbekistan based on agro-ecological zones—Toshkent region, Qashqadariya region, Karakalpakstan region, the Fergana Valley, from which the sites for FGDs were selected. The sites were allocated based on land degradation hotspots database by Le et al. (2014), also presented in Chap. 4. The main criteria that were followed for choosing the sites are given below. The locations of the sites are indicated in Fig. 21.6.

The location of communities where focus group discussions were held
-
1.
Choose sites both from areas with land degradation and land improvement
-
2.
Select communities (or groups of communities) that span at least 8 km2
-
3.
Allocate at least one site from each polygon.
As a result, two communities with improved land, one community without change and four communities with degraded land plots were selected for Focus Group Discussions (FGD ). The focus group discussions also sought to find out about land use changes in the past 30 years, actions taken to address ecosystem services loss and enhance ecosystem services improvement, off-site ecosystem services benefits and costs, as well as the perception about Payments for Ecosystem Services (PES). The information was collected both on provisional services (crop yields), but also on the values the communities attach to supporting, regulating, and cultural ecosystem services provided by land and soils.
Agricultural Survey Dataset
The dataset used for the analysis of the drivers of the adoption of sustainable land management practices comes from a nationally representative agricultural household survey in the country carried out during the 2009–2010 cropping season by the International Center for Agricultural Research in the Dry Areas (ICARDA) and national partners.Footnote 3 The multi-stage survey sampling was conducted comprising farmers and household producers across different agro-ecologies and farming systems in the country (Mirzabaev 2013). With the confidence interval of 95 %, the sample size was set at 400 respondents. Uzbekistan was first divided into major agro-ecological zones—west, south, center and east for Uzbekistan . Then in each zone, one province was randomly selected (ibid.). The number of respondents was allocated to each province depending on the share of the agro-ecological zone in the value of the national agricultural production . Following this, the total list of villages was obtained for each province selected. The villages in each province were numbered, and the corresponding numbers for the selected villages were randomly drawn using the Excel software function “RAND” (25 villages) (ibid.). The number of respondents per village was evenly distributed within each province. At the village level, the list of all agricultural producers, including household producers, were obtained from the local administrations; agricultural producers were numbered, and then from this numbered list, respondents were randomly selected (Mirzabaev 2013; Fig. 21.7).

The locations of the surveyed households in Uzbekistan
Results
Land Use and Land Cover Changes
Remotely sensed datasets on land cover from Moderate Resolution Imaging Spectroradiometer (MODIS) were analyzed to identify the shifts in the land use and land cover in Uzbekistan between 2001 and 2009 (Tables 21.4 and 21.5).
The analysis shows that the major land use and land cover shifts in the country in this period were: (1) a 5 mln ha shift from barren areas (including deserts and desertic rangelands) mainly to shrublands (about 4 mln ha, almost all of which in the Navoi province) and to a lesser degree to grasslands (especially in Karakalpakstan: 0.8 mln ha, and Tashkent province 0.1 mln ha), (2) increase the in area of croplands by 0.3 mln ha (here important to note an increase of 0.25 mln ha in Karakalpakstan and a decrease of 0.13 mln ha in Tashkent province), (3) continued desiccation of the Aral Sea.
Drivers of Sustainable Land Management
As described in the conceptual framework, land degradation is a complex problem where numerous proximate and underlying factors influence the state of land degradation. The following set of variables was used (Table 21.6) to determine the most influential drivers of sustainable land management in the country.
These explanatory variables can be divided into proximate and underlying drivers of land degradation as explained in the conceptual framework. Among proximate drivers , agro-ecological zones, length of growing period, frequency of weather shocks, annual temperature and precipitation, land slope are used. There is no firm theoretical basis for the relationship between these variables and land degradation and sustainable land management, and the nature of the influence of these variables on sustainable land management is empirical. However, there are some expectations regarding the influence of underlying drivers of sustainable land management. For example, closer distance to markets, private land tenure , higher livestock and other assets ownership, access to extension are expected to positively contribute to sustainable land management. The role of demographic variables such as gender, age and education of the household head, family size need to be empirically examined.
Following the analytical approach described in the methodology section, four different models were used to analyze the drivers of land degradation in Uzbekistan . The results of the econometric analyses on the household level are given in Table 21.7.
Key Common Insights from the Models
Regional differences
The level of SLM adoptions seems to be lower in Karakalpakstan province of the country which, as we shall see later, is also located near the Aral Sea and in areas with highest negative TEV impacts of land degradation. This highlights that, in case of prioritization of SLM investments and actions, that region could be among the top provinces where there is a high need to address land degradation and the consequences of the drying up of the Aral Sea. The soil fertility perception and NDVI-based land degradation models also agree that land degradation problems are the most severe in Karakalpakstan province, even if the impact on cotton yields does not seem to be statistically significant.
Institutional and market characteristics
Among institutional and market-related variables, only the number of crops grown, i.e. the higher level of crop diversification, was found to be positively associated with the number of SLM technology adoptions. The effect of other variables such as distance to markets, share of household plots with high tenure security in the total operated land, asset ownership, etc. were not statistically significant in this sample. Larger samples of households are normally needed to identify the direction of their impact. However, given the very small confidence intervals of most of these variables around zero, their impact on SLM adoptions seems low. The positive association between crop diversification and sustainable land management calls for increased efforts for reducing the mono-cropping practices (where mainly cotton and wheat are planted), and transiting to more diverse crop rotations. Specifically, experiences from the region indicate that including legumes to existing crop rotations can both help in improving soil fertility and increasing farmers’ profitability (Pender et al. 2009).
Moreover, several of the institutional and market-related variables were found to have statistically significant associations with NDVI-based land degradation measurement. Specifically, bigger farms sizes, the higher share of household plots with high tenure security in the total operated land, longer distance to markets, and stronger night-time lighting intensity as measured from the satellite were found to be associated with less land degradation. On the other hand, higher total assets and access to extension were associated with more land degradation, which is a surprising finding. Bigger farm sizes could allow for the adoption of scale-sensitive SLM measures in the country, such as for example, laser land leveling. Moreover, bigger farms usually have preferential access to Government subsidized fertilizer and other inputs. Operating household plots with high tenure security provides with more incentives for the adoption of sustainable land management practices as it allows for fuller internalization of often long-term benefits of sustainable land management . Higher night time lighting intensity is used as a proxy for the availability of a dynamic non-farm sector. Availability of non-farm jobs may allow for positive spillovers between farm and non-farm sectors (financial, technological) and also serve as a source of off-farm income which could be invested in adopting sustainable land management practices.
Greater distances to markets were positively associated with perceptions of soil fertility (consistent with the finding on NVDI-based measure). Several of the institutional and market-related variables also had a statistically significant effect on cotton yields. Namely, households with access to extension, higher total assets, higher crop diversity, and closer to markets reported higher cotton yields.
Focus Group Discussions
The results of the focus group discussion indicated that the values of almost all ecosystem services, such as provisional, regulating, supporting and cultural, have increased between 1982 to 2013 and it happens on both types of selected sites—degraded and improved. Among the main reasons for the increase in the values of ecosystem services, land degradation and the effects of climate change are named most frequently. The promotion of SLM was not always successful, reportedly due to the lack of financial resources for its implementation. There were also differences observed between the regions. A general increase of degradation and desertification processes was observed on all areas, although with a different rate. Karakalpakstan is reportedly the most affected region.
Values of Provisioning Ecosystem Services
FGDs showed that there was a tendency to an increase in the share of livestock and mixed farming systems in all of the studied regions in Uzbekistan . The monetary value of provisioning ecosystem services (ES) has greatly changed over the last 25 years in Uzbekistan with an increase of its value near the big cities (Tashkent) and a great decrease of ES value in remote areas (Karakalpakstan) that do not have access to big markets. One of the surveyed locations in Karakalpakstan region (Raushan), which borders with desert, also has a very high value of livestock per household, suggesting higher dependency on livestock products.
Indirect and Cultural Values of Ecosystem Services
ES values such as air quality regulation and water purification are given a significant value only in the region of Karakalpakstan, where reportedly the effect of a dried up Aral Sea has influenced the quality of the ecosystem services. Other indirect ecosystem services such as pollination, waste treatment, natural hazard regulation etc. as well as cultural ecosystem services were not given a significant value in any other surveyed site.
Costs of Land Degradation
Our estimation of the costs of land degradation in Uzbekistan following the Total Economic Value (TEV) framework described in the methodological section is given in Table 21.8. This valuation includes both direct and indirect ecosystem services, namely, the value of provisional, supporting, regulating and cultural ecosystem services. These cost estimates are based only on changes in the values of ecosystem services due to land use/cover change, and do not include the costs of land degradation when land use/cover did not change, i.e. it does not include the of land degradation when cropland remained cropland but yields have declined due to land degradation.
The results show that, in total, the economic value of land degradation costs , including the costs of lost ecosystem services , in Uzbekistan in 2009 as compared to 2001 was 0.838 billion USD, i.e. about 4 % equivalent of the Gross Domestic Product (GDP) in 2007 (all USD values are given in constant 2007 terms).
The highest costs of land degradation are occurring in Karakalpakstan and Navoi provinces of the country. Specifically for these two provinces: the major reason for elevated costs of land degradation in Karakalpakstan is due to the continued desiccation of the Aral Sea, and for Navoi province is due to grassland degradation , whereby grasslands are shifting to less fertile shrublands. If we look at the net change in the total economic value of ecosystems in the country, the overall figure for Uzbekistan is positive by about 4.4 billion USD, i.e. the Total Economic Value of Ecosystems has increased between 2001 and 2009. However, this overall figure masks sharp regional differences. Most of this increase is due to land improvement in Navoi province, where significant area of formerly barren lands has also shifted to shrublands (about 3.4 mln ha), with shrublands ecosystem functions having higher economic values than barren lands, potentially due to elevated levels of atmospheric fertilization , increasing the photosynthetic rate among desert mosses and higher forms of vegetation (Liobimtseva 2007). The major areas with net negative change are Karakalpakstan, Kashkadarya, Buhoro, Samarkand, Surhandaryo, Farg’ona and Sirdaryo provinces (Fig. 21.8 and Table 21.9).

Net changes in the TEV of ecosystems in Uzbekistan between 2001 and 2009
Actions Against Land Degradation
The results show that the costs of action against land degradation are lower than the costs of inaction in Uzbekistan by more than 4 times over the 30 year horizon, meaning that each dollar spent on restoring lands degraded through shifts to lower value biomes is likely to have about 4.3 dollars of returns. Thus, the costs of action were found to equal about 11 billion USD over a 30-year horizon, whereas if nothing is done, the resulting losses may equal almost 50 billion USD during the same period. Almost 98 % of the costs of action are made up of the opportunity costs of action, for example, the value of new shrublands in areas where the original grasslands are being restored, whereas the actual implementation costs are found to be relatively smaller.
These estimates of the costs of actions are from the global social perspective, including the value of many global public goods such as carbon sequestration or nutrient cycling. As shown in Table 21.10, more than half of the costs of land degradation belong to the losses of indirect ecosystem services. However, private land users may include only the losses in provisional ecosystem services of land due to degradation in their decision making because they cannot fully internalize the benefits from safeguarding or restoring the non-provisional ecosystem services of land (such as for example, climate regulation, nutrient cycling). Since many of these non-provisional ecosystem services of land are global public goods, even the national Government is less likely to incorporate the full value of the lost land ecosystem services into their calculations, since they as well cannot internalize fully the benefits of SLM within the country. Thus, a wider use of payment for ecosystem services (PES) approaches through international investments could potentially help in reducing this lack of incentives to invest into SLM (Chap. 10).
The calculations of the costs of action vs inaction against land degradation presented above are based on land degradation due to land use and cover change (LUCC). Although these calculations are able to capture the effect of extreme forms of cropland or rangeland degradation when these croplands and rangelands shift to barren lands, these calculations do not include the costs of land degradation associated with lower crop yields and lower grassland productivity due to degradation but without land use and cover change. Chapter 8 calculates that the costs of productivity decline in rangelands through lower meat, milk and live weight loss among livestock in Uzbekistan are about 6 million USD annually. However, this figure is likely underestimating the impact of land degradation on livestock productivity in the country since the major share of the livestock in Uzbekistan is reared through stable feeding of forage crops grown in cropped areas and not through open grazing in rangelands. The estimates on the impacts of cropland degradation on the yields of wheat, maize and rice for the whole Central Asian region in Chap. 6 point to about 300 million USD of losses. However, it is difficult to disaggregate meaningfully these losses for Uzbekistan alone. Besides, this figure does not include cotton—a major crop in Uzbekistan. ICARDA (2007) evaluated the impact of salinity on rural livelihoods in Syrdarya province of Uzbekistan. With the price of raw cotton at around 300 USD/t, farmers in the high and medium salinity zones were found to lose on average 116 USD/ha and 77 USD/ha in, respectively, as compared to farmers operating land with low salinity. In the case of wheat, at a price of 100 USD/t, farmers in the high and medium salinity zones lost on average 149 USD/ha and 66 USD/ha as compared to low salinity group farmers because of salinity. Gupta et al. (2009) review that the annual losses in agricultural production due to soil salinization might be about US$ 31 million, and economic losses due to land abandonment at 12 million USD. Nkonya et al. (2011) estimated that the annual economic loss of salinity for wheat and cotton alone is 13.29 million USD. Despite these available estimates, there is a lack of quantitative studies assessing the costs of land degradation through lower crop yields and livestock productivity with nationally representative data samples. Hence, more research is required in this area in the future.
Technological Options for Sustainable Land Management
Over the past five years, the Government of Uzbekistan has taken many steps to improve irrigation and drainage infrastructure to reduce water losses and mitigate soil salinization. The government has planned to rehabilitate 10,000–15,000 ha of abandoned land annually through reconstruction of irrigation and drainage infrastructure. The construction of such facilities is estimated to cost 2000 USD per ha. This approach will require massive financial and technical support from government as individual farmers are unable to bear these costs . In addition to this, there are also cost-effective interventions that can be undertaken by farmers to compliment state efforts in mitigating salinization problems. Below we review some of such technological options for sustainable land management which may be undertaken as part of action programs to address land degradation.
For rehabilitating desert rangelands, planting salt and drought tolerant species in rangelands such as salt tolerant alfalfa varieties has shown promising results in trials in the Kyzylkum desert in Uzbekistan , where introduced varieties significantly outperformed local varieties. Reseeding with native drought and salt tolerant legumes such as Acacia, Astralagus, Alhagi, Glycyrrhiza, Melilotus, Cicer, Vicia, and Lathyrus also shows promise, and these are capable of sustaining relatively heavy grazing (Pender et al. 2009; Toderich et al. 2008a, b).
Moreover, nitrogen fixing forage crops can play a crucial role in saving fertilizer and improving soil fertility when added to crop rotations. In this respect, the creation of highly productive fodder systems through the establishment of palatable halophytes in saline areas has been shown to remediate saline soils as well as provide an income to resource poor farmers (Toderich et al. 2002, 2008a, b). In 2000–2004, the use of licorice (Glycyrrhiza glabra) to reclaim abandoned saline areas was studied in Syrdarya province. After 4 years of licorice cultivation, cotton yields in these formerly highly saline areas recovered from initial 0.87–2.42 t/ha (Kushiev et al. 2005).
Contour irrigation with plastic chutes in Uzbekistan reduced soil erosion to 0.1 t/ha from 4.5 to 8.2 t/ha using conventional practices (Pender et al. 2009). Since poor drainage is a major problem in irrigated areas of Central Asia, research is needed to adapt and test conservation tillage options for irrigated agriculture in this region, including minimum as well as zero tillage options (Gupta et al. 2009).
An experiment in the wheat—fallow system in Uzbekistan demonstrated the advantages of zero or minimum tillage in improving soil conditions (ICARDA 2007). The level of soil organic matter was highest in the zero tillage treatment and lowest with conventional tillage during summer fallow. Although soil bulk density was slightly greater under no till, soil moisture was greater with no till, especially in the driest year.
Tree plantations in degraded croplands may help in rehabilitating degraded soils and restoring some part of their provisional services (Khamzina et al. 2008). Afforestation of abandoned croplands due to their degradation in Uzbekistan can allow for provisioning of tree products for income generation (Lamers et al. 2008; Djanibekov et al. 2013b). However, insecure farmland tenure restrains Uzbek farmers from investing into long-term land use activities (Djanibekov et al. 2012a). In such conditions a short-rotation forestry might be a more appropriate option to encourage farmers’ towards agroforestry practices (Djanibekov et al. 2012b).
Needless to say that only the application of technological solutions may not be enough to address land degradation in a sustainable manner. The application of these technological options need to go hand in hand with institutional and socio-economic policies conducive to sustainable land management , such as, as we have seen in the analysis earlier, information and knowledge dissemination, access to high quality extension services, land tenure security, non-agricultural rural development and crop diversification.
Conclusions
The research findings indicate that the costs of land degradation in Uzbekistan are substantial reaching as high as about 0.85 billion USD annually between 2001 and 2009 only due to land use and land cover changes (LUCC). These figures do not include the costs of land degradation on a static land use. Addressing land degradation has significant economic returns. Every dollar invested into land rehabilitation can yield about 4 dollars of returns over a 30-year planning horizon in the country. The highest returns from actions against land degradation due to LUCC are estimated for Karakalpakstan, Buhoro, and Syrdaryo provinces of Uzbekistan. The major factors associated with sustainable land management are found to be crop diversification, more secure land tenure and availability of non-farm jobs in rural areas.
Notes
- 1.
GEF, Water and Environment Management Project, May 1998, p. 7, footnote 11.
- 2.
The World Bank, Project Concept Document, Uzbekistan Drainage Project, December 2, 1999.
- 3.
We thank the Asian Development Bank for funding the surveys.
References
Abdullaev, I., Giordano, M., & Rasulov, A. (2005). Cotton in Uzbekistan: Water and welfare. In Conference on “Cotton Sector in Central Asia: Economic Policy and Development Challenges”. University of London: The School of Oriental and African Studies, 3–4 Nov 2005.
Akramkhanov, A., Martius, C., Park, S. J., & Hendrickx, J. M. H. (2011). Environmental factors of spatial distribution of soil salinity on flat irrigated terrain. Geoderma, 163(1–2), 55–62.
Akramkhanov, A., & Vlek, P. (2011). The assessment of spatial distribution of soil salinity risk using neural network. Environmental Monitoring and Assessment, 184(4), 1–11.
Akramov, K., & Omuraliev, N. (2009). Institutional change, rural services, and agricultural performance in Kyrgyzstan. IFPRI Discussion Paper 00904. Washington DC, USA.
Bloch, P. (2002). Agrarian reform in Uzbekistan and other Central Asian countries. Working paper, no. 49, Land Tenure Center, University of Wisconsin–Madison, USA.
Bobojonov, I., Lamers, J. P. A., Djanibekov, N., Ibragimov, N., Begdullaeva, T., Ergashev, A., et al. (2012). Crop diversification in support of sustainable agriculture in Khorezm. In C. Martius, I. Rudenko, J. P. A. Lamers, & P. L. G. Vlek (Eds.), Cotton, water, salts and soums—economic and ecological restructuring in Khorezm, Uzbekistan (pp. 219–233). Dordrecht/Heidelberg/London/New York: Springer.
Bucknall, J., Klytchnikova, I., Lampietti, J., Lundell, M., Scatasta, M., & Thurman, M. (2003). Irrigation in Central Asia: Social, economic and environmental considerations. Washington, USA: World Bank.
CACILM. (2006). Country pilot partnerships on sustainable land management. CACILM Multicountry Partnership Framework. Executive Summary. Tashkent, ADB.
Chen, X., Bai, J., Li, X., Luo, G., Li, J., & Li, B. L. (2013). Changes in land use/land cover and ecosystem services in Central Asia during 1990–2009. Current Opinion in Environmental Sustainability, 5, 116–127.
Conrad, C., Colditz, R. R., Dech, S., Klein, D., & Vlek, P. L. G. (2011). Temporal segmentation of MODIS time series for improving crop classification in Central Asian irrigation systems. International Journal of Remote Sensing, 32, 1–16.
Conrad, C., Dech, S., Dubovyk, O., Fritsch, S., Klein, D., Löw, F., et al. (2014). Derivation of temporal windows for accurate crop discrimination in heterogeneous croplands of Uzbekistan using multitemporal rapid eye images. Computers and Electronics in Agriculture, 103, 63–74.
Djanibekov, N., Sommer, R., & Djanibekov, U. (2013b). Evaluation of effects of cotton policy changes on land and water use in Uzbekistan: Application of a bio-economic farm model at the level of a water users association. Agricultural Systems, 118, 1–13.
Djanibekov, N., Van Assche, K., Bobojonov, I., & Lamers, J. P. A. (2012b). Farm restructuring and land consolidation in Uzbekistan: New farms with old barriers. Europe-Asia Studies, 64(6), 1101–1126.
Djanibekov, U., Djanibekov, N., Khamzina, A., Bhaduri, A., Lamers, J. P. A., & Berg, E. (2013a). Impacts of innovative forestry land use on rural livelihood in a bimodal agricultural system in irrigated drylands. Land Use Policy, 35, 95–106.
Djanibekov, U., Khamzina, A., Djanibekov, N., & Lamers, J. P. A. (2012a). How attractive are short-term CDM forestations in arid regions? The case of irrigated croplands in Uzbekistan. Forest Policy and Economics, 21, 108–117.
Dubovyk, O., Menz, G., Conrad, C., Kan, E., Machwitz, M., & Khamzina, A. (2013a). Spatio-temporal analyses of cropland degradation in the irrigated lowlands of Uzbekistan using remote-sensing and logistic regression modeling. Environmental Monitoring and Assessment, 185, 4775–4790.
Dubovyk, O., Menz, G., Conrad, C., Lamers, J., Lee, A., & Khamzina, A. (2013b). Spatial targeting of land rehabilitation: A relational analysis of cropland productivity decline in arid Uzbekistan. Erdkunde, 67, 167–181.
Dubovyk, O., Menz, G., Conrad, C., Thonfeld, F., & Khamzina, A. (2013c). Object-based identification of vegetation cover decline in irrigated agro-ecosystems in Uzbekistan. Quaternary International, 311, 163–174.
Friedl, M. A., Sulla-Menashe, D., Tan, B., Schneider, A., Ramankutty, N., Sibley, A., & Huang, X. (2010). MODIS Collection 5 global land cover: Algorithm refinements and characterization of new datasets. Remote Sensing of Environment, 114(1), 168–182.
Gupta, R., Kienzler, K., Mirzabaev, A., Martius, C., de Pauw, E., Shideed, K. et al. (2009). Research prospectus: A vision for sustainable land management research in Central Asia. ICARDA Central Asia and Caucasus Program. Sustainable Agriculture in Central Asia and the Caucasus Series No. 1. CGIAR-PFU, Tashkent, Uzbekistan. 84pp.
ICARDA. (2003). On-Farm Soil and Water Management for Sustainable Agricultural Systems in Central Asia. Final Report (Funded By The Asian Development Bank) November.
ICARDA. (2007). Improving Rural Livelihoods Through Efficient On-Farm Water and Soil Fertility Management in Central Asia Project Funded By Adb Under Reta 6136 Project Report 2004–2007.
ICTSD (International Center for Trade and Sustainable Development). (2014). The problem of water resources in Central Asia (in Russian). http://ictsd.org/i/news/mosty-blog/187411/#sthash.bZ4pi386.dpuf. Accessed 22 April 2014.
IWMI-ICARDA-ICBA. (2008). Enabling Communities in the Aral Sea Basin to Combat Land and Water Resource Degradation Through the Creation of Bright Spots. Project Report. The ADB supported project: RETA 6208 (2005–2008).
Ji, C. (2008). Central Asian countries initiative for land management multicountry partnership framework support project. Tashkent: ADB.
Kariyeva, J., & Van Leeuwen, W. J. D. (2011). Environmental drivers of NDVI-based vegetation phenology in Central Asia. Remote Sensing, 3, 203–246.
Khamzina, A., Lamers, J. P. A., & Vlek, P. L. G. (2008). Tree establishment under deficit irrigation on degraded land in the lower Amu Darya River region, Aral Sea Basin. Forest Ecology and Management, 255(1), 168–178.
Khan, A. R. (1996). The transition to a market economy in agriculture. In Social policy and economic transformation in Uzbekistan (pp. 65–92). Geneva: ILO.
Kharin, N. G., Tateishi, R., & Harahsheh, H. (1999). Degradation of the drylands of Asia. Center for environmental remote sensing. Japan: Chiba University.
Khusanov, R. (2009). IFPRI-ICARDA project on “Economic Evaluation of Sustainable Land Management Options in Central Asia” Uzbekistan Report. Uzbekistan: Tashkent.
Kienzler, K. M., Lamers, J. P. A., McDonald, A., Mirzabaev, A., Ibragimov, N., Egamberdiev, O., et al. (2012). Conservation agriculture in Central Asia—what do we know and where do we go from here? Field Crops Research, 132, 95–105.
Klein, I., Gessner, U., & Kuenzer, C. (2012). Regional land cover mapping and change detection in Central Asia using MODIS time-series. Applied Geography, 35, 219–234.
Kushiev, H., Noble, A. D., Abdullaev, I., & Toshbekov, U. (2005). Remediation of abandoned saline soils using Glycyrrhiza glabra: A study from the hungry steppes of Central Asia. International Journal of Agricultural Sustainability, 3(2), 102–113.
Lamers, J. P. A., Bobojonov, I., Khamzina, A., & Franz, J. S. (2008). Financial analysis of small-scale forests in the Amu Darya lowlands of rural Uzbekistan. Forests, Trees and Livelihoods, 18(4), 375–382.
Le, Q. B., Nkonya, E., & Mirzabaev, A. (2014). Biomass productivity-based mapping of global land degradation hotspots. ZEF-Discussion Papers on Development Policy (p. 193). Bonn, Germany.
Liobimtseva, E. (2007). Possible changes in the carbon budget of arid and semi-arid Central Asia inferred from land-use/landcover analyses during 1981–2001. In Climate change and terrestrial carbon sequestration in Central Asia (pp. 441–452). London: Taylor & Francis.
Maman, S., Blumberg, D. G., Tsoar, H., Mamedov, B., & Porat, N. (2011). The Central Asian ergs: A study by remote sensing and geographic information systems. Aeolian Research, 3, 353–366.
MEA (Millenium Ecosystem Assessment). (2005). Dryland Systems. Ecosystem and Well-Being: Current State and Trends. In R. Hassan, R. Scholes, & N. Ash (Eds.), (pp. 623–662). Washington, DC: Island Press.
Mirzabaev, A. (2013). Climate Volatility and Change in Central Asia: Economic Impacts and Adaptation. PhD thesis at Agricultural Faculty, University of Bonn. urn:nbn:de:hbz:5n-3238.
Nkonya, E., Gerber, N., Baumgartner, P., Von Braun, J., De Pinto, A., Graw, V., et al. (2011). The Economics of Desertification Land Degradation, and Drought IFPRI Discussion Paper. IFPRI: Washington DC.
Nkonya, E., Von Braun, J., Mirzabaev, A., Le, Q. B., Kwon, H. Y., & Kirui, O. (2013). Economics of land degradation initiative: Methods and approach for global and national assessments. ZEF-Discussion Papers on Development Policy, (183). Center for Development Research, Bonn, Germany.
Pender, J., Mirzabaev, A., & Kato, E. (2009). Economic analysis of sustainable land management options in Central Asia. Washington, DC, USA: Final Report submitted to ADB.
Propastin, P. A., Kappas, M., & Muratova, N. R. (2008). Inter-annual changes in vegetation activities and their relationship to temperature and precipitation in Central Asia from 1982 to 2003. Journal of Environmental Informatics, 12, 75–87.
Republic of Uzbekistan. (1994). Decrees and resolutions: On measures for intensification of economic reforms, protection of private property and promotion of entrepreneurship. Tashkent: Uzbekistan Publishing House.
Spoor, M. (1999). Agrarian transition in former soviet Central Asia: A comparative study of Kazakhstan, Kyrgyzsrtan and Uzbekistan. Working Paper 298, Centre for the Study of Transition and Development [CESTRAD], ISS, Rotterdam, Netherlands.
Sutton, W., Whitford, P., Stephens, E. M., Galinato, S. P., Nevel, B., Plonka, B., & Karamete, E. (2007). Integrating environment into agriculture and forestry. Progress and prospects in Eastern Europe and Central Asia. Kosovo: World Bank.
Toderich, K., Shoaib, I., Juylova, E., Rabbimov, A., Bekchanov, B., Shuyskaya, E., et al. (2008a). New approaches for biosaline agriculture development, management and conservation of sandy desert ecosystems. In C. Abdelly, M. Ozturk, M. Ashraf, & K. Grignon (Eds.), Biosaline agriculture and high salinity tolerance. Switzerland: Birkhauser Verlag.
Toderich, K., Tsukatani, T., Mardonov, B., Gintzburger, G., Zemtsova, O., Tsukervanik, E., & Shuyskaya, E. (2002). Water quality, cropping and small ruminants: A challenge for the future agriculture in dry areas of Uzbekistan. Discussion Paper No. 553. Kyoto Institute of Economic Research. Kyoto University.
Toderich, K., Tsukatani, T., Shoaib, I., Massino, I., Wilhelm, M., Yusupov, S., et al. (2008b). Extent of salt-affected land in Central Asia: Biosaline agriculture and utilization of salt-affected resources. Discussion paper No. 648. Kier Discussion paper series. Kyoto Institute of Economic Research.
Van der Ploeg, S., & de Groot, R. S. (2010). The TEEB valuation database—a searchable database of 1310 estimates of monetary values of ecosystem services. Wageningen, the Netherlands: Foundation for Sustainable Development.
World Bank. (2003). Assessment of irrigation and drainage infrastructure in Uzbekistan (Russian). Report (108 pp). Tashkent, Uzbekistan: World Bank.
Author information
Authors and Affiliations
Corresponding author
Editor information
Editors and Affiliations
Rights and permissions
Open Access This chapter is distributed under the terms of the Creative Commons Attribution Noncommercial License, which permits any noncommercial use, distribution, and reproduction in any medium, provided the original author(s) and source are credited.
Copyright information
© 2016 The Author(s)
About this chapter
Cite this chapter
Aw-Hassan, A., Korol, V., Nishanov, N., Djanibekov, U., Dubovyk, O., Mirzabaev, A. (2016). Economics of Land Degradation and Improvement in Uzbekistan. In: Nkonya, E., Mirzabaev, A., von Braun, J. (eds) Economics of Land Degradation and Improvement – A Global Assessment for Sustainable Development. Springer, Cham. https://doi.org/10.1007/978-3-319-19168-3_21
Download citation
DOI: https://doi.org/10.1007/978-3-319-19168-3_21
Published:
Publisher Name: Springer, Cham
Print ISBN: 978-3-319-19167-6
Online ISBN: 978-3-319-19168-3
eBook Packages: Economics and FinanceEconomics and Finance (R0)