
Abstract
Excess nutrients from fertiliser application, pollution discharge and water regulations outflow through rivers from lands to oceans, seriously impact coastal ecosystems. Terrestrial runoff of waters polluted with nutrients (primarily nitrogen [N] and phosphorus [P] compounds) from point source/s, such as sewage treatment plant (STP) discharges, and diffuse sourcesvia river discharges, such as fertiliser losses, are having devastating adverse effects in coastal and marine ecosystems globally (Carpenter et al., Ecol Appl 8:559–568, 1998; Halpern et al., Science 319:948–952, 2008; Crain et al., Ecol Lett 11:1304–1315, 2008; Smith and Schindler, Trends Ecol Evol 24:201–207, 2009). The nutrients can be dissolved such as dissolved nitrate and Phosphate typically discharged from STPs or agricultural runoff or in a particulate form, often associated with soil erosion.
You have full access to this open access chapter, Download chapter PDF
4.1 Introduction
Excess nutrients from fertiliser application, pollution discharge and water regulations outflow through rivers from lands to oceans, seriously impact coastal ecosystems. Terrestrial runoff of waters polluted with nutrients (primarily nitrogen [N] and phosphorus [P] compounds) from point sources, such as sewage treatment plant (STP) discharges, and diffuse sources via river discharges, such as fertiliser losses, are having devastating adverse effects in coastal and marine ecosystems globally (Carpenter et al. 1998; Halpern et al. 2008; Crain et al. 2008; Smith and Schindler 2009). The nutrients can be dissolved such as dissolved nitrate and phosphate typically discharged from STPs or agricultural runoff or in a particulate form, often associated with soil erosion.
Biomass production of plant matter in coastal waters is often limited by the availability of nitrogen and/or phosphorus (light is a limiting factor in turbid zones). Conversely, the increased human-derived inputs of nutrients can lead to increased biomass production that can disturb the natural ecological balance in marine ecosystems. This disturbance, the process of eutrophication, is one of the biggest threats to marine ecosystem health. Eutrophication, like climate change, is a global issue with coastal regions throughout the world being impacted through the input of elevated nutrients (Galloway et al. 2014). Well-documented adverse ecological responses to increased nutrient discharge into coastal and marine waters include harmful algal blooms (HABs) (Hudnell 2008; Glibert and Burford 2017), changed preponderance and dominance of certain types of algae over other benthic plants (seagrass, coral, other algae) (Lapointe et al. 2018, 2019), hypoxia and subsequent dead zones (Diaz and Rosenberg 2008), habitat degradation and adverse changes in aquatic food webs (Carpenter et al. 1998; Gross and Hagy 2017).
Enrichment of both nitrogen and phosphorus is of concern, though the consensus that has evolved among much of the scientific community is that increased nitrogen is the primary driver of eutrophication in many coastal ecosystems (Howarth and Marino 2006). However, this has been challenged by recent scientific literature which acknowledges the need to reduce both nitrogen and phosphorus to control coastal eutrophication (Howarth and Marino 2006; Howarth and Paerl 2008; Riemann et al. 2016; Asmala et al. 2017). Successful reductions of phosphorus have occurred throughout freshwater systems through the banning of phosphorus in detergents, and a corresponding reduction in phosphorus is being measured in many coastal waters (Paerl 2006). While this is a hopeful trend, this has led to a global N:P imbalance in our coastal and marine ecosystems and an increasing N: P ratio which can impact the plankton community structure and phosphorus limitation of natural growth (Howarth and Paerl 2008; Paerl 2009). A comprehensive response needs to focus on consistent reductions in nitrogen to marine systems to alleviate this imbalance and will be the focus of this chapter.
The global nitrogen cycle is now greatly perturbed by human (anthropogenic) activity, particularly on land (Gruber and Galloway 2008; Rockström et al. 2009; Fowler et al. 2013). The increasing inputs of nitrogen from human activity, predominantly from land-based activities can modify oceanic, and even global, biogeochemical systems (Jickells et al. 2017). The estimated anthropogenic release of nitrogen into the global environment (160 Tg N/yr, Tg = Teragram = 1012 g) is now of similar magnitude to natural nitrogen fixation (250 Tg N/yr−) and is likely to increase in the future due to a growing global population (Gruber and Galloway 2008). Four of the primary sources of bioavailable (hence the term reactive) nitrogen to estuarine, coastal and marine waters are runoff and discharge from the land, upwelling on the continental shelf break; atmospheric deposition; and fixation by nitrogen-fixing microbes. The sources of the increased nutrient fluxes are associated with:
-
fertiliser use and losses in agriculture such as grazing and cropping;
-
human sewage discharges;
-
farm animal wastes discharge; and
-
fluxes to the atmosphere which are discharged to marine waters via rainfall and particulate matter deposition.
4.2 Nutrification and Eutrophication in Marine Waters
4.2.1 Definitions
Waters with low concentrations of nutrients and phytoplankton and hence low productivity are called oligotrophic, while those with high nutrient and/or phytoplankton (and benthic algae) concentrations and high productivity are eutrophic. Waters with an intermediate level of productivity are termed mesotrophic.
Nutrification is the action or process of nutrifying an environment with nutrients (generally nitrogen and/or phosphorus). Nutrification is of concern, however, enrichment alone does not necessarily confer an impact, and assessment of eutrophication typically needs to meet several other criteria before impact and disturbance can be measured (Tett et al. 2007; Ferreira et al. 2011; Brodie et al. 2011). The excessive input of anthropogenic nitrogen and phosphorus needs to cause additional impacts, for example, marine algal blooms above the consumption capacity of herbivores before we can conclude the system is eutrophic (Nixon 2009).
The term eutrophication refers to a process of increased production of biomass in an aquatic ecosystem, evolving over long timescales until the system is full of biomass (Bricker et al. 2008; Boyd 2020). However, the term is more commonly used now to refer to a process that has been accelerated by anthropogenic actions, resulting in the process occurring in short timeframes of years to decades (Nixon 1995). Eutrophication can be defined in different ways for different systems, but for marine and estuarine waterbodies, it is a process resulting from the input of excessive plant nutrients into an aquatic system. The excess nutrients lead to enhanced plant growth or changes in the composition and structure of communities and, as a consequence, the high plant growth reduces the penetration of light through the water. Light is essential for plant growth with light-limiting conditions resulting in plant death. This can cause ongoing adverse effects as the dead plant material is consumed by aerobic bacteria leading to high demands on the oxygen supply. Reductions in dissolved oxygen impacts all organisms and may result in a crash of the whole system. Criteria that are used to measure the impacts through this process include algal blooms and low-oxygen (hypoxic) waters that can kill fish, reduce essential fish habitats and result in epiphytic algae over-growth and death of marine plants, such as seagrass, through smothering and reducing its capacity to photosynthesise (Figure 4.1). Anthropogenic eutrophication thus can be defined as ‘the overproduction of aquatic plant biomass/organic material induced by anthropogenic inputs of phosphorus and nitrogen’.

Adapted from Devlin et al. 2011 by M. Devlin
The process of eutrophication and the resulting impacts on the marine ecosystems.
This definition is used to overcome the difficulty of summarising in a few words the multitude of biogeochemical and biological responses (including direct and indirect effects) triggered by excessive nitrogen and phosphorus inputs (Devlin et al. 2011; Le Moal et al. 2019). Eutrophication can cause structural changes throughout the marine ecosystem and reduce ecosystem resilience (Figure 4.2).
Eutrophication issues have often been divided into three descriptive terms:
-
Causative factors: Factors which cause eutrophication such as nutrient inputs, elevated nutrient concentrations and imbalance in nutrient concentrations (see Section 4.2.3, where Redfield ratios are described).
-
Direct effects: Effects which are caused directly by the increased nutrients such as impacts on primary producers (phytoplankton) and submerged aquatic vegetation.
-
Indirect effects: Effects that are influenced by the direct effects and are known as secondary effects. These can be related to negative changes in zooplankton, fish and invertebrate benthic fauna (animals living on and in the seabed).
Figure 4.2 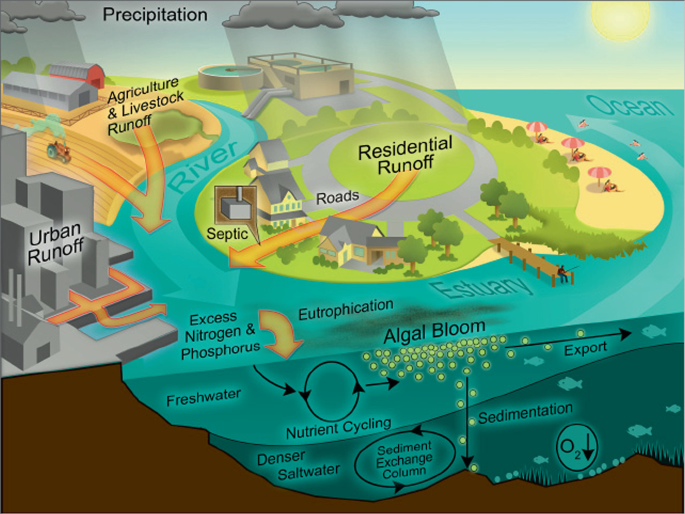
Schematic diagram of the different pathways of nutrient deposition into coastal waters and ensuing processes leading to eutrophication (algal blooms) and hypoxia. Image: Hans W. Paerl CC BY 2.0

4.2.2 Nutrient Types
Nutrients enter the marine environment in many forms, including dissolved inorganic nitrogen (DIN), which includes ammonium (NH4), nitrate \({\text{N}}{{\text{O}}_{{3^ - }}} \) and nitrite \({\text{N}}{{\text{O}}_{{2^ - }}} \). Other sources of nitrogen include dissolved organic nitrogen (DON), particulate inorganic nitrogen (PIN, essentially ammonium ions attached to clay particles) and particulate organic nitrogen (PON). Phosphorus forms include phosphate \({\text{PO}}_4^{3 - } \), which consist of orthophosphate or polyphosphates, dissolved organic phosphorus (DOP), particulate inorganic phosphorus (PIP), essentially phosphate ions attached to clay particles) and particulate organic phosphorus (POP). Rainfall and river flow will contain both ammonium and nitrate in solution, while dry deposition of dust can contain various forms of particulate nitrogen and phosphorus.
4.2.3 Nutrient Limitation and Nutrient Ratios
The nutrients essential for primary production, which are often present in a limiting amount, are nitrogen and phosphorus. The C:N:P (carbon to nitrogen to phosphorus) stoichiometric ratios of living organisms (especially plants, and in the ocean, phytoplankton) are fairly constant and are termed Redfield ratios (Geider and La Roche 2002). For both phytoplankton and zooplankton, the ratio of (C:N:P), known as the Redfield ratio is 106:16:1 with some variation between different organisms. In addition, silica (Si) is essential for diatom growth so the ratio of C to N to P to Si may also be important. Thus, instead of the traditional Redfield ratio of C:N:P as 106:16:1, a modified Redfield ratio to include silica becomes C:N:P:Si as 106:16:1:15, known as the Redfield–Brzezinski ratio, and is often used as a standard to understand nutrient limitation with respect to nitrogen, phosphorus or silicate for natural phytoplankton assemblages. Increased nutrient inputs generally entail a change in the ratio between dissolved nitrogen and phosphorus species in the water (i.e. the DIN:DIP ratio). A significantly lower ratio (than 16:1) can cause nitrogen limitation, whereas a higher ratio can lead to phosphorus limitation for phytoplankton primary production (Tett et al. 1985). Species that are less sensitive for their growth to require optimal DIN:DIP ratios can outcompete more sensitive species.
Nitrogen and phosphorus are the major limiting nutrients in most aquatic ecosystems (Conley et al. 2009). Primary production is frequently limited by nitrogen and phosphorus in freshwaters and by nitrogen in the ocean (Howarth and Marino 2006). The long-standing debate over nitrogen versus phosphorus limitations to ocean primary production had appeared to be settled in favor of nitrogen as a result of the substantial rates of denitrification recently reported in marine environments (Nixon 1995; Howarth and Marino 2006). Nevertheless, phosphorus appears to limit phytoplankton activity in some regions (Wu et al. 2000) and iron (Fe) and phosphorus appear to co-limit the growth of nitrogen-fixing Trichodesmium in the Atlantic Ocean (Mills et al. 2004). In addition, changing anthropogenic activities have caused imbalances in nitrogen and phosphorus loading, making it difficult to control eutrophication by reducing only one nutrient (Paerl 2006; Duarte et al. 2008; Howarth and Paerl 2008). The forms of nitrogen and the ratios of nitrogen and phosphorus in river discharge (from both agricultural and human waste sources) are also changing (Glibert 2017). A global increase in fertiliser nitrogen to phosphorus ratio has also occurred during 1961–2013, which may have global implications for the types and extent of marine eutrophication in the longer term (Lu and Tian 2017). For example, with the increasing use of urea as one of the cheapest and most readily available sources of nitrogen, losses of nitrogen are increasing from current applications of fertiliser in agriculture compared to older and less soluble forms of nitrogen fertiliser.
Changes in the ratio of nitrogen to phosphorus also have significant potential effects on phytoplankton and other algal growth and speciation in the marine environment. Upstream nutrient management actions (exclusively phosphorus controls) have exacerbated nitrogen-limited downstream eutrophication which can impact coastal plankton communities. These imbalances can lead to shorter trophic food webs with fewer predators, and potentially decreasing biodiversity and long-term management should consider controls on both nutrients (Penuelas et al. 2013; Paerl et al. 2014; Burson et al. 2016).
4.2.4 Sources and Causes
Excess nitrogen and/or phosphorus is sourced from many anthropogenic processes including fertiliser runoff, human sewage effluent, animal waste discharge and atmospheric fallout in rain and precipitation. Iron, silica and other micronutrients may also be involved in nutrification, but case studies of adverse effects are less common (however, see silica to nitrogen ratio Section 4.2.3).
Increasing demands for nitrogenous fertilisers for use in agriculture (Lu and Tian 2017) and particularly urea in recent times, is largely responsible for the rapidly increasing discharge of nitrogen to the marine environment (Jickells and Weston 2011a, b) (Figure 4.3). The share of total global anthropogenic nitrogen and use (187 Mt/yr) from agriculture has been estimated at 86% (Galloway et al. 2008). Many studies also reveal low nitrogen use efficiency in crops, with only approximately half of the nitrogen applied to croplands being incorporated into plant biomass, while the rest is lost through leaching (16%), soil erosion (15%) and gaseous emission (14%) (Liu et al. 2011; Liu et al. 2013a, b). Additional sources include nitrogen and phosphorus discharges to coastal seas from domestic wastewater and groundwater inputs driven by human population growth (Powley et al. 2016) with increased atmospheric deposition and rainfall inputs of phosphorus (Jickells et al. 2017). There is also increased watershed erosion (with particulate nitrogen and phosphorus content), especially in the tropics, associated with deforestation and agricultural land development (Bainbridge et al. 2018). Analysis of changes in the global freshwater nitrogen and phosphorus cycles in rivers and streams over the twentieth century suggests that, during this period, the global river nutrient transport to the ocean increased from 19 to 37 Tg N/yr and from 2 to 4 Tg P/yr (Seitzinger et al. 2005; Bouwman et al. 2009; Beusen et al. 2016).

From the 1940s to the 1980s, eutrophication was reported in the northern Adriatic Sea, the northwest continental shelf of the Black Sea (Mee 1992), the Kattegat betweenDenmark and Sweden (Rosenberg et al. 1996), Chesapeake Bay (Boesch et al. 2001) and many other areas in temperate northern hemisphere waters (Lotze et al. 2011a, b). Recent prominent and large-scale examples of eutrophication include the North China Sea (Qingdao) with massive algal blooms interfering with the aquatic events of the 2008 Beijing Olympic games (Section 4.3.3); in the Caribbean and West Africa (Smetacek and Zingone 2013) (Section 4.3.4); and further eutrophication across the Baltic Sea generally (Andersen et al. 2017). There are now numerous reports of macroalgal blooms with the most common algae involved being species of Ulva (green tides) and Sargassum (golden tides) worldwide in recent years. These blooms negatively impact tourism, particularly countries that have high economic dependence on tourism. The blooms may smother aquaculture operations (some of which are also a source of nutrients) or disrupt traditional artisanal fisheries (Smetacek and Zingone 2013).
Nutrient pollution is a leading global threat to coastal and marine ecosystems, including saltmarshes, mangroves, kelps, seagrasses and corals (Howarth and Paerl 2008). About half the global riverine nitrogen input (about 40 from the total 80 Tg of N yr−1) is anthropogenic in origin (Beusen et al. 2016) and riverine fluxes of nitrogen have increased greatly (Bouwman et al. 2009; Beusen et al. 2016). Rivers in western Europe and eastern China have seen large increases in nitrogen fluxes (e.g. the Yangtze River had about four times more nitrogen load in 2010 than in 1991, while the amount of fertiliser used doubled, resulting in increased riverine DIN levels). The increased riverine DIN flux between 1991 and 2010 in the United States of America (USA) was affected primarily by nitrogen fertiliser use, while rivers in Europe and China have seen fertiliser use, human waste and atmospheric sources increase. These changes have also occurred in tropical waters with the total anthropogenic DIN exported to the Pacific Ocean increasing from 10 to 30% of the total, a higher rate than any other ocean (Liu et al. 2019).
Eutrophication from increased nutrient input is now recognised as one of the most serious issues facing estuarine and coastal waters in many parts of the world, with, for example, 67% of the combined surface area of estuaries in the USA exhibiting moderate to high degrees of eutrophication (Potter et al. 2016), a trend also found elsewhere in coastal waters across the world (Duarte et al. 2008; Duarte 2009; Rabalais et al. 2009; Paerl et al. 2014). Breitburg et al. (2018) note a worrying trend in declining oxygen in the global ocean and coastal waters associated with watershed pollution as well as climate change.
Globally, nitrogen and phosphorus loadings to coastal and marine waters are expected to at least double by 2050 (Johnson and Harrison 2015; Kroeze and Seitzinger 1998) through the continued increase in the use of fertilisers (Heffer and Prud’homme 2012), increased coastal aquaculture, increased populations and associated sewage waste, animal wastes, further deposition of nitrogen associated with gaseous emissions from fossil fuel burning and other industrial discharges to the atmosphere (Johnson and Harrison 2015). Riverine nitrogen fluxes to the global ocean are estimated to be 23 Tg/N/yr for DIN and 11 Tg/N/yr for DON (Seitzinger et al. 2005, 2010). The total river input of nitrogen to coastal seas has approximately doubled over the last few hundred years (Seitzinger et al. 2005, 2010; Yan et al. 2010; Beusen et al. 2016). This input is also now dominated by nitrate, reflecting the influence of indirect land use inputs through fertiliser usage (Jickells and Weston 2011a, b; Jickells et al. 2017). Nitrogen use is now outside of the bounds of global planetary sustainability (Steffen et al. 2015) and poses a high risk to the Earth's systems (Johnson and Harrison 2015; Lu and Tian 2017).
-
Fertiliser Use and Losses from Agricultural Land
Rising agricultural demands for nitrogenous fertilisers (and particularly urea) in recent times is responsible for the rise in reactive nitrogen (Galloway et al. 2008). Nitrogen fertiliser production increased from 15 million tonnes N/yr in 1860 to 187 million tonnes N/yr in 2005 (Figure 4.3). Nitrogen and phosphorus fertiliser usage rates per unit of cropland area increased by approximately eight times and three times, respectively, since the year 1961 (Lu and Tian 2017). This increase in fertiliser nitrogen is compounded by the inefficient use of fertiliser on agricultural lands. More than half of the synthetic fertiliser applied to the world’s fields has been applied in the past 30 years (Pearce 2018) but less than half of this fertiliser reach the intended crops, with the remainder running off into rivers and eventually into the ocean. Large increases in atmospheric nitrogen emissions have also occurred over the last 200 years associated with this human activity (Table 4.1).
-
Fossil Fuel Combustion Emissions and Aerial Deposition
Combustion (especially of fossil fuels) is a major source of oxidised nitrogen which is transformed in the atmosphere to nitric acid and rained out as nitrate (Table 4.1). Direct agricultural emissions from fertiliser use are a major source of ammonia (Duce et al. 2008). Rapid and efficient atmospheric transport allows these emissions to reach the open oceans within days, hence much faster and more effectively than fluvial inputs (Fowler et al. 2013). Wang et al. (2015) estimate that combustion-related emissions (associated with fossil fuels) are 1.8 Tg/P/yr, which represent over 50% of global atmospheric sources of P. Using these estimates in models, they found that the total global emissions of atmospheric P (3.5 Tg/P/yr) were broken up into a deposited amount of 2.7 Tg/P/yr over land and 0.8 Tg/P/yr over the oceans.
-
Human Sewage Wstes
Global nitrogen and phosphorus emissions from human sewage for the period 1970–2050 have been estimated from the four Millennium Ecosystem Assessment scenarios. An increase in global sewage emissions is predicted, from 6.4 Tg of nitrogen and 1.3 Tg of phosphorus per year in 2000 to 12.0–15.5 Tg of nitrogen and 2.4–3.1 Tg of phosphorus per year in 2050. North America (strong increase), Oceania (moderate increase), Europe (decrease) and North Asia (decrease) show contrasting developments, and in the developing countries, sewage nitrogen and phosphorus discharge will likely increase by a factor of 2.5–3.5 between 2000 and 2050 (Bouwman et al. 2005; Van Drecht et al. 2009; Seitzinger et al. 2010). This is a combined effect of increasing population, urbanisation and development of sewage systems. Despite some optimistic scenarios for the development of wastewater treatment systems, it is predicted the contributions of wastewater nutrients will contribute to high fluxes of global nitrogen and phosphorus fluxes for many years to come (Van Drecht et al. 2009).
-
Animal Wastes
The large quantity of manure produced by intensive animal production is generally applied to land as fertiliser, stacked in the feedlot, or stored in lagoons. Frequently, an oversupply of manure means that it is applied to crops more than is necessary, further exacerbating nutrient runoff and leaching (see WRI: https://www.wri.org/our-work/project/eutrophication-and-hypoxia/sources-eutrophication). In China, meat production rose by 127% between 1990 and 2002 (Fao 2012), but fewer than 10% of an estimated 14,000 intensive livestock operations have installed pollution controls (Ellis 2017).
-
Upwelling
The vertical distribution of nutrients in the sea shows, for both nitrates and phosphates, a surface minimum that sharply increases with depth during the first 100–500 m and is approximately steady in deeper waters. Upwelling occurs in the open ocean and along coastlines. Water that rises to the surface as a result of upwelling is typically colder and rich in nutrients (mainly nitrate and phosphates). These nutrients fertilise surface waters, meaning that these surface waters often have high biological productivity. Therefore, good fishing grounds typically are found where upwelling is common (see NOAA: https://oceanservice.noaa.gov/facts/upwelling.html). Upwelling of nutrients into shallow habitats is unlikely to have been increased by anthropogenic effects, although changed current regimes associated with climate change may affect this process in the future (Bakun et al. 2015).
4.2.5 Temperate Versus Tropical Waters
-
Differing Discharge Processes in the Tropics
Nitrogen pollution in aquatic systems is shaped by multiple sources and processes. Modelling of nitrogen budgets of basin–marine systems provides estimates that globally, land currently sequesters 11 (10–13)% of annual nitrogen input (Lee et al. 2019). River basins can act as a buffer, taking up greater than 50% of their nitrogen inputs, which can provide some protection to the coastal systems. However, activities such as deforestation, agricultural intensification and/or exports of land nitrogen storage in tropical systems can create large nitrogen pollution sources including erosion of nitrogen-rich soils. Particulate nitrogen (and phosphorus) discharges as a result of erosion are a major issue for the tropics and can contribute to the largest fraction of nitrogen and phosphorus river discharges (e.g. for the Great Barrier Reef (GBR) (Waterhouse et al. 2012)). The tropics produce 56 ± 6% of global land nitrogen pollution despite covering only 34% of global land area and receiving far lower amounts of fertilisers than the areas outside of the tropics. Tropical land use needs to be considered as a major mechanism in managing global nitrogen pollution (Lee et al. 2019).
-
Phytoplankton Speciation Differences
Phytoplankton species in the nutrient-depleted tropical waters are typically dominated by picocyanobacteria (often species of Synechococcus and/or Prochlorococcus) of very small cell size, while temperate waters have higher ratios of diatoms and dinoflagellates (influenced partially by temperature) (Odebrecht et al. 2018; Righetti et al. 2019). Polar seas can also be dominated by picocyanobacteria. In general, in tropical seas when large injections of nutrients occur from river discharge, sewage discharge or upwelling, phytoplankton speciation shifts from picocyanobacteria dominance to dominance by diatoms and dinoflagellates (Jacquet et al. 2006).
4.2.6 Effects Related to Eutrophication
-
Hypoxia, Dead Zones, Climate Change and Loss of Oceanic Oxygen
Human inputs of nutrients to coastal waters can lead to the excessive production of algae and an excess of organic matter, as part of the eutrophication process (see Section 4.2.1). Microbial consumption of this organic matter lowers oxygen levels in the water (Gilbert et al. 2010; Cai et al. 2011). The decomposing plant biomass causes an oxygen deficit and can produce toxic compounds such as hydrogen sulfide (H2S) and ammonia (NH3) in the anoxic sediments.
Oxygen concentrations in open ocean and coastal waters have been declining since at least the middle of the twentieth century. This change which is associated with the eutrophication process can be exacerbated by the increasing temperatures associated with increased CO2 levels in the oceans and atmosphere. These changes are affecting the abundances and distributions of many marine species. Low-oxygen zones, or dead zones, in the ocean have expanded by several million square kilometres and hundreds of coastal sites now have oxygen concentrations low enough to limit the distribution and abundance of animal populations (Rabalais et al. 2009, 2014; Gilbert et al. 2010; Breitburg et al. 2018). There have been greater declines in marine oxygen levels in coastal seas compared to the open ocean (Gilbert et al. 2010); oxygen decline rates are more severe in a 30 km band near the coast than in the open ocean (>100 km from the coast) because of the influence of increased nutrient fluxes from rivers. In the 1990s, scientists reported coastal Hypoxia in northern Europe, North America and Japan. By the 2000s, there were more such reports in South America, southern Europe and Australia, as well as increasing dead zones in the Baltic Sea (Gilbert et al. 2010; Rabalais et al. 2014). Low-oxygen zones are now known as dead zones due to the detrimental impacts of low dissolved oxygen on benthic fauna which can culminate in mass mortality events (Diaz and Rosenberg 2008).
Coastal Hypoxia and the associated dead zones have been exacerbated by worldwide enhanced coastal primary production and eutrophication driven by increased riverine inputs of nitrogen and phosphorus, soil erosion of particulate nitrogen and phosphorus and the burning of fossil fuelsfossil fuels. These processes lead to an accumulation of particulate organic matter, which encourages microbial activity and the consumption of dissolved oxygen in bottom waters. Degradation of coastal water quality in the form of low dissolved oxygen levels (Hypoxia and anoxia) can harm biodiversity, ecosystem function and human well-being. Extreme hypoxic conditions along the coast, leading to dead zones, are known primarily in temperate and sub-tropical regions. Dead zones have now been reported from more than 400 ecosystems, affecting a total area of more than 245,000 km2 (Diaz and Rosenberg 2008) with consequent impacts on marine ecosystems (Ekau et al. 2010; Altieri et al. 2017). However, less is known about the potential threat of Hypoxia in the tropics, even though the known risk factors, including eutrophication and elevated temperatures, are common. Altieri et al. (2017) documented an unprecedented hypoxic event on the Caribbean coast of Panama and assessed the risk of dead zones to coral reefs worldwide. The event near Panama caused coral bleaching and massive mortality of corals and other reef-ahypoxiassociated organisms but observed shifts in community structure combined with laboratory experiments revealed that not all coral species are equally sensitive to . Analyses of global databases showed that coral reefs are associated with more than half of the known tropical dead zones worldwide, with >10% of all coral reefs at elevated risk of hypoxia based on local and global risk factors. Hypoxic events in the tropics and associated mortality events have likely been underreported, perhaps by an order of magnitude, because of the lack of local scientific capacity for their detection (Altieri et al. 2017).
-
Algal Proliferation and Subsequent Changes in Marine Plant communities
Algal blooms are a natural phenomenon, but their frequency, duration and geographical scope have been increasing since the 1950s, largely in response to fertiliser runoff and sewage discharge, and human-induced climate change. Increased competition from algal blooms can impact saltmarshes, mangroves, kelps, seagrasses and corals (Lefcheck et al. 2018) (Figure 4.4). For instance, partly as a result of increased nutrient inputs, the global cover of seagrasses has declined by over 29% in the last century (Waycott et al. 2009) (Figure 4.4b). Localised issues of water quality, particularly sedimentation, can have negative impacts on seagrass cover (Petus et al. 2014; Brodie et al. 2020).

Signs of nutrient enrichment around the Kei Islands, Eastern Indonesia a algae-covered corals b epiphyte growth on seagrass fonds inhibiting sunlight and photosynthesis of seagrass c green microalgae bloom visible in surface waters. Photos: A. Reichelt-Brushett
Green algal blooms (green tides), are formed by rapid growth and accumulation of unattached green macroalgae and are associated with nutrient-enhanced marine environments (Figure 4.5). Over the last 50 years, green tides have been increasing in severity, frequency and geographic range, resulting in these events becoming a growing concern worldwide (Ye et al. 2011). High concentrations of beached algal biomass started to appear along the shores of industrialised countries through the 1970s. These became known as green tides and, over the next few decades, became a common sight along many beaches with increases in both frequency and magnitude of the green tides during the spring–summer growing season. Green algae blooming events harm shore-based activities and tourism as the sheer physical mass can cover the shoreline and the dense, drifting seaweeds prevent accessibility to the sea (Figure 4.5). Over the growing season, if not manually removed, the algae can turn into a stinking morass, producing toxic hydrogen sulfide (H2S) from its anoxic interior, and have major detrimental effects on the affected coastal ecosystems (Smetacek and Zingone 2013).

Green algae blooms deposited on the beach at Byron Bay, NSW, Australia, inhibiting recreational activities. Photo: A. Reichelt-Brushett
-
HABs and Red Tides
Harmful Algal Blooms (HABs), with the term often restricted to blooms of toxic algae, are increasing in coastal waters worldwide (Glibert and Bouwman 2012; Glibert 2017; Glibert and Burford 2017). These blooms can be associated with anthropogenic nutrient enrichment, through elevated inorganic and/or organic nutrient concentrations and modified nutrient ratios. Since 1950, their extent in coastal waters has increased (Anderson et al. 2002; Heisler et al. 2008) and the risks to coastal seas increased dramatically as was witnessed in the Gulf seas with mass mortality of coral reefs and fisheries associated with the proliferation of HABs and reduction of light climate (Richlen et al. 2010).
4.2.7 Tropical Ecosystem Effects
-
Crown of Thorns Starfish (CoTS)
CoTS are one of the major causes of coral mortality in the Great Barrier Reef (GBR) and generally on Indo-Pacific reefs (Figure 4.6) (De’ath et al. 2012; Pratchett et al. 2017). River nutrients can influence CoTS outbreak dynamics (Schaffelke et al. 2017) as wet season nutrient inputs from the central GBR rivers, typically discharge when phytoplankton-feeding CoTS larvae are present in the water column (November to March) (Devlin et al. 2012, 2013). The increase in nutrients provides food for the phytoplankton blooms which allows a greater number of CoTS larvae to survive to a stage where they are able to settle out on a coral reef (Brodie et al. 2005; Fabricius et al. 2010; Brodie et al. 2017).

Image of Crown of Thorns (CoTS) in process of consuming coral. Photo: A. Reichelt-Brushett
Waves of outbreaks are initiated when these phytoplankton food resource conditions are reinforced by favourable hydrodynamic conditions (Wooldridge and Brodie 2015) and sufficient coral cover to sustain the outbreaks (Fabricius et al. 2010). Studies highlight that the number of outbreaks have increased through the period where the GBR inshore waters have experienced increases in nutrient loads from agriculture. This has resulted in the frequency of CoTS waves on the GBR moving from low frequencies of about every 50–80 years to about every 15 years (Brodie 1992; Fabricius et al. 2010; Brodie et al. 2017; Pratchett et al. 2017).
-
Macroalgae Versus Coral Diversity
Higher nutrient availability supports the proliferation of macroalgae and can negatively affect coral physiology and ecosystem functioning (D’Angelo and Wiedenmann 2014; Ulloa et al. 2017). High concentrations of Chlorophyll-a (Chl-a) (typically at concentrations greater than 0.45 µg/L) can indicate increased nutrient availability supporting the growth of macroalgae (De’ath and Fabricius 2010). High macroalgal biomass can have detrimental effects on corals which can include space competition (McCook et al. 2001), altering the microbial environment of corals which affects their metabolism (Hauri et al. 2010; Thurber et al. 2017) and larval survival (Morrow et al. 2017), reducing coral settlement (Birrell et al. 2008) and increasing the susceptibility of corals to disease (Vega Thurber et al. 2014).
-
Increased Coral Bleaching Susceptibility
DIN availability plays an important part in the coral–algae symbiosis, with elevated DIN concentrations disrupting the ability of the coral host to maintain an optimal population of algal symbionts (Wooldridge et al. 2015, 2017). Elevated DIN concentrations and changes in N:P ratios can increase the susceptibility of corals to bleaching from increased temperatures (Wooldridge 2009, 2017; Fabricius et al. 2013; Wiedenmann et al. 2013; D’Angelo and Wiedenmann 2014; Vega Thurber et al. 2014; Humanes et al. 2016; Rosset et al. 2017; Wooldridge et al. 2017).
-
Bioerosion
Coral, both living and dead, can be impacted by the process known as bioerosion. This can occur through a range of mechanisms involving many different organisms. Bioerosion can be caused by the very small, minute, primarily intra-skeletal organisms, the microborers (e.g. algae, fungi, bacteria) to larger and often externally visible macroboring invertebrates (e.g. sponges, polychaete worms, sipunculans, molluscs, crustaceans, echinoids) and fish (e.g. scarids, acanthurids) (Hutchings et al. 2005; Chazottes et al. 2017; Glynn et al. 2017). Nutrient enrichment can increase the growth of both types of borers. Increased DIN availability supports the growth of algal borers and the filter-feeding sponges, worms and bivalves are supported through the increased phytoplankton (and zooplankton) biomass (Le Grand and Fabricius 2011). Eutrophication of reef waters by land-based sources of nutrient pollution can magnify the effects of ocean acidification through nutrient-driven bioerosion (Prouty et al. 2017). The combined impacts of increased bioerosion by the boring organisms and the reduced calcification due to ocean acidification can additively reduce reef net calcification (DeCarlo et al. 2015; Glynn et al. 2017).
-
Coral Diseases
Coral diseases are a considerable contributor to coral cover declines on coral reefs (Osborne et al. 2011) and are predicted to worsen with global pressures of increasing temperature and ocean acidification (Maynard et al. 2015; O’Brien et al. 2016). Coral disease manifests as a general response to multiple stressors (Chapter 14) of corals and has been positively correlated to sedimentation, elevated concentrations of nutrients and organic matter and increased plastic pollution (Harvell et al. 2007; Haapkylä et al. 2011; D’Angelo and Wiedenmann 2014; Pollock et al. 2014; Thompson et al. 2014; Vega Thurber et al. 2014; Lamb et al. 2016, 2018; Zaneveld et al. 2016).
-
Light Reduction
Algal blooms can be associated with flood plumes (Figure 4.7) due to inputs of river-derived nutrients (Devlin et al. 2001; Devlin and Schaffelke 2009; Brodie et al. 2013) and localised inputs of nutrients. Phytoplankton blooms, as well as non-algal, suspended particulate matter (e.g. detritus, clay particles) in flood plumes, reduce light availability for benthic plant communities including seagrass and coral (Bauman et al. 2010; Petus et al. 2014; Collier et al. 2016). In shallow waters, the reduction of in situ light penetration due to resuspended sediment is usually a more dominant effect, but in deeper waters (>15 m) where resuspension does not normally occur (except in cyclonic conditions), the light reduction due to phytoplankton (and zooplankton) may be an important factor for communities such as deep water seagrasses (Collier et al. 2016) and coral reefs (D’Angelo and Wiedenmann 2014).

Riverine plume discharging into the Great Barrier Reef, Australia. This image was captured a few days after the torrential rain and shows the muddy waters flowing from the Burdekin River into the Coral Sea. Image: European Space Agency CC BY-SA 2.0 contains modified Copernicus Sentinel data (2019), processed by ESA, CC BY-SA 3.0 IGO
4.3 Case Studies
4.3.1 Baltic Sea
Over the twentieth-century nutrient inputs to the Baltic Sea increased by factors of three and five for nitrogen and phosphorus, respectively, with consequent widespread eutrophication across the Baltic Sea (Gustafsson et al. 2012). Declining dissolved oxygen concentrations were noted in the Baltic Sea as early as the 1930s, with widespread reporting of this by the 1950s. This sustained increase in nutrients originates from farm fertiliser, industry, atmospheric deposition and waste water associated with population increases in the large catchment area of the Baltic countries.
Large amounts of nutrients in the water increase primary production and hence intensify phytoplankton growth. Dead algae sink to the bottom, where their decomposition consumes oxygen, leading to hypoxia. In hypoxic conditions, sediments can no longer retain previously stored nutrients which then start to leak from the sediments. This leakage increases the amount of available nutrients which, in turn, increases primary production. This so-called vicious circle is an important indirect effect of eutrophication (Andersen et al. 2017; Murray et al. 2019). Benthic animals cannot survive in these hypoxic (and eventually anoxic) conditions, and large areas on the sea floor become completely depleted of life.
In much of the Baltic Sea, the direct consequences of elevated nutrient concentrations are increased primary production and phytoplankton biomass, and often manifest as algal blooms (Murray et al. 2019). Subsequently, the increased deposition of dead algae has reduced oxygen concentrations. These dissolved oxygen sags have affected the benthic invertebrates, with high rates of mortality, and impacted the spawning success rate of cod, a commercially important fish species.
As the causes and consequences of eutrophication become better understood in the Baltic Sea, many policies have been implemented to reduce external nutrient inputs (Andersen et al. 2017). These policies include the Helsinki Commission (HELCOM) Baltic Sea Action Plan (BSAP), an ambitious program that established nutrient reduction targets to restore the ecological status of the Baltic marine environment by 2021. Additionally, a number of European Union (EU) policies legally require member states—eight of the nine coastal counties—to reduce nutrient inputs to surface waters in order to meet environmental goals (Borja 2005; Devlin et al. 2007; Borja et al. 2010a; Bermejo et al. 2012).
These policies and associated measures have seen nitrogen and phosphorus inputs to the Baltic Sea decrease by 9% and 14%, respectively, and human exposure to potential toxins has been reduced (Svendsen et al. 2018). The combined effects of nutrient and fisheries management have also resulted in top predator population recovery (including cod). Nutrient loads are decreasing, however, legacy pollution and different rates of load reductions have limited full ecosystem recovery with many serious problems still to be addressed for the Baltic Sea. Potentially toxic contaminants are still at levels of concern in wildlife and fish catches, and new contaminants continue to come into use, undesirable symptoms of eutrophication remain evident in many coastal areas; deep water oxygen deficiency is still recorded extensively through the Baltic Sea, and toxic blooms of cyanobacteria interfere frequently with tourism and recreation (Elmgren et al. 2015), and climate change impacts the fragile recovery (Elmgren et al. 2015; Cloern et al. 2016).
4.3.2 Chesapeake Bay, USA
Since USA1950, the population of the Chesapeake Bay watershed in the eastern USA has doubled to 18 million people, leading to expansion of agriculture and urbanised land use and adding to the substantial nutrient and sediment runoff from previously established urban and agricultural lands. From the 1950s through to the 1970s, tens of thousands of hectares of submerged aquatic vegetation (SAV) were lost in the largest decline documented in over 400 years with ongoing algal blooms (Figure 4.8) (Harding 1994; Harding and Perry 1997; Boesch et al. 2001; Kemp et al. 2005). Concern over the loss of SAV and declines in the overall health and economy of the bay led to unparalleled cooperation among federal, state, local and scientific agencies, whose joint efforts identified nutrient pollution and subsequent loss of SAV as the two most critical issues facing Chesapeake Bay (Lefcheck et al. 2018). These agencies instituted measures to reduce nutrient inputs, as well as long-term monitoring programmes to gauge their effectiveness, thereby establishing the Chesapeake Bay as one of the few places on Earth where comprehensive long-term data exist to mechanistically link human impacts and ecological restoration at broad scales.

Organic inputs into rivers and coastal waters can increase turbidity and algal blooms. Turbid waters identified in the Potomac and Wilcomico Rivers section of Chesapeake Bay. Image: NASA Earth Observatory image by Joshua Stevens and Jesse Allen, using Landsat data from the U.S. Geological Survey
The sustained management actions that have evolved out of that cooperation have been successful in reducing N concentrations in the Chesapeake Bay by 23% with a recent study showing seagrass coverage in the Chesapeake Bay increased by 17,000 ha between 1984 and 2015, a 23% improvement (Lefcheck et al. 2018). This cooperative management demonstrates that nutrient reductions, improvements in water quality (Zhang et al. 2018) and biodiversity conservation are effective strategies to aid the successful recovery of degraded systems at regional scales, a finding which has been highly relevant to environmental management programs worldwide (Lefcheck et al. 2018).
4.3.3 Yellow Sea and Qingdao
Massive free-floating macroalgal blooms of Ulva prolifera occur in the Yellow Sea, covering thousands of square kilometres, with millions of tons of biomass and causing huge economic losses. These blooms have been identified as the world’s largest green tide events, occurring annually from 2007 to 2017 along the coast of the Yellow Sea, China, seriously impacting the downstream marine environments and ecological services. One of the most prominent examples of this happened in 2008, when a large green tide covered Qingdao beaches, making it a prominent feature during the Beijing Olympics. Masses of Ulva floated in from the open water of the Yellow Sea and beached a few weeks before the competition was due to start, ensuring prominent coverage by the international media (Figure 4.9). Mitigation included the deployment of a 30-km-long boom to keep the masses of floating algae out of the bay, and the physical removal of more than a million tonnes of algae from the beaches involved 10,000 people at an estimated cost to the province of US$30 million. In addition, aquaculture operations along the shore suffered losses of US$100 million (Liu et al. 2013a).

Image of green tides in Qingdao beach, China, in 2010. Photo: Philip Roeland CC BY-NC-ND 2.0
The pelagic seaweed bloom, as well as those in subsequent years, could be traced in satellite images to the coastline some 200 km south of Qingdao, where aquaculture of the edible red alga Porphyra yezoensis (which is grown on rafts along the intertidal zone) has expanded rapidly since 2004. As the algae Ulva prolifera also grows profusely on the rafts, algal fragments dislodged and discarded in the sea during harvesting of Porphyra are the most likely seed source of the mid-summer green tide. It is estimated that 500 tonnes of Ulva algae, discarded from the Porphyra rafts, grow into one million tonnes in 6 weeks (Liu et al. 2013b). The floating algae are transported more than 200 km northward to the Shandong coast and proliferate sufficiently to generate this massive green tide.
Management of the Olympics bloom involved hand and mechanical clearance from the beaches but efforts to reduce the incidence of the blooms are also occurring (Yuan et al. 2017a, b).
4.3.4 Caribbean Wide Algal Blooms and West Africa
In recent years, Sargassum seaweed has been washing up in unprecedented quantities on beaches in the Caribbean, Florida and the Gulf of Mexico (Louime et al. 2017; Langin 2018; Gower and King 2019) (Figure 4.10). NASA satellites recently observed the largest seaweed bloom in the world, stretching from West Africa to the Gulf of Mexico. A major cause of the algae bloom was likely to be nutrient discharge from deforestation and fertiliser use along the Amazon River (Wang et al. 2019). Fertiliser consumption in Brazil between 2011 and 2018 increased by about 67% compared to the rates in 2002, while the total forest loss along the Brazilian Amazon increased by 25%. In June 2018, Wang et al. (2019) documented that the 8850-km algal bloom contained >20 million metric tons of Sargassum biomass. The bloom of 2011 may be a result of the Amazon River discharge in previous years, but recent increases and interannual variability after 2011 appear to be driven by upwelling off west Africa during boreal winter, and by the Amazon River discharge during spring and summer, indicating a possible regime shift and raising the possibility that recurrent blooms in the tropical Atlantic and the Caribbean Sea may become the new norm.

Proliferation of Sargassum golden tide in a bay in the southern Caribbean. Photo: Mark Yokoyama CC BY-NC-ND 2.0
During 2011, there was an ocean-scale build-up of Sargassum in the Caribbean that, at its peak, extended across the Atlantic Ocean and resulted in massive golden tides along the West African coast, from Sierra Leone to Ghana, and, on the other side of the Atlantic Ocean, from Trinidad to the Dominican Republic (Figure 4.12). It is believed Sargassum was unknown in north-west Africa before 2011, so the event came as a shock to the many afflicted fishing villages. A similar event occurred again in 2019 (Wang et al. 2019). Satellite images showed that the algal rafts had developed along the northern coast of Brazil, north of the mouth of the Amazon, from where they moved east and west, eventually stretching across the Atlantic Ocean (Figure 4.11). A notable event was the whole length of the western coastline in Ghana covered in Sargassum and extended offshore, clogging fishing nets and impacting small boat traffic and fishing. This resulted in food shortages for people living in villages dependent on artisanal fisheries for their livelihood (Smetacek and Zingone 2013). In the Caribbean, tourism has been negatively affected because of the closure of beaches and bays. These large-scale events seem to be unprecedented in this area (Louime et al. 2017; Langin 2018; Resiere et al. 2018).

The Great Atlantic Sargassum Belt in July 2018. Scientists used NASA’s Moderate Resolution Imaging Spectroradiometer (MODIS) on Terra and Aqua satellites to discover the Great Atlantic Sargassum Belt (GASB), which started in 2011. It has occurred every year, with the exception of 2013 and typically stretches from the west coast of Africa to the Gulf of Mexico. Image: NASA/Earth Observatory. Data provided by Mengqiu Wang and Chuanmin Hu, USF College of Marine Science

Image of green tides taken in South Coast, United Kingdom. Photo: Mike Best, Environment Agency
4.3.5 Brittany
The increase in Ulva biomass on European and American beaches that began in the 1970s was linked to coastal eutrophication. These visible, rotting coastal blooms impacted tourism-based economies, smothered aquaculture operations and disrupted traditional artisanal fisheries (Smetacek and Zingone 2013). As the many harmful effects became evident, the affected countries took measures to understand the drivers and the extent of the problem (Newton et al. 2014; Perrot et al. 2014; Gaspar et al. 2017). In the popular tourist beaches of Brittany (Figure 4.12), the magnitude of green tides has been increasing since the 1970s (Charlier et al. 2008). Events have been managed through the collection of seaweed and use as fertiliser by local farmers, but this was untenable by the 1990s as the magnitude of the seaweed became unmanageable. There have been many incidents connected to the large volume of seaweed on the Brittany beaches including the death of a horse in 2009 from H2S gas coming from rotting Ulva, and, in 2011, the death of around 30 wild boars. Both incidents were widely reported in the press admist rising public concerns about the toxicity of the algae. Tourism was severely impacted, with a loss of visits felt by the local economy, in addition to the costs of removing and disposing of 100,000 tonnes of beached algae (estimated up to US$150 per tonne).
The consensus among the scientific community is that eutrophication from the effluents of intensive stock rearing was one of the primary causes of the increase in the number and magnitude of green tides since the 1990s. Brittany is a wet region overloaded with nutrients released by the high density of animals—equivalent to those from 50 million people—and so eutrophication is inevitable because the manure is not being shipped back to the animal feed producers outside the province. The meat-producing and tourist industries are both mainstays of the provincial economy, and, following the animal deaths, confrontation between the two industries increased. In efforts to make the best out of a situation that is unlikely to change soon, Ulva biomass has been used as a raw material for biogas production, as an organic fertiliser and as an additive to animal and human food. However, the value barely meets the costs of current methods of algal collection and processing (Smetacek and Zingone 2013).
4.3.6 Tampa Bay, Florida, USA
In Tampa Bay, Florida, USA, large increases in population in the catchment area led to increased nutrient loads so that by the late 1970s the effects of eutrophic decline became obvious, including reduced water clarity, accumulations of macroalgae, noxious phytoplankton blooms, intermittent hypoxia and loss of about 50% of the seagrass meadows in Tampa Bay (Greening et al. 2014). The bay was already phosphorus-enriched due to catchment drainage from phosphorus ore mining operations. The ecosystem is strongly nitrogen-limited and thus management was focused on nitrogen removal from point source discharges of sewage and industrial wastes that, in the mid-1970s, comprising 60% of the total nitrogen load. Political responses at the state and local levels led the way, with the enactment of a 1978 Florida statute that required advanced treatment of water from all wastewater treatment plants discharging to Tampa Bay. Additional nutrient limits were required for stormwater discharges from 1985. This reduction in wastewater nitrogen loading of approximately 90% in the late 1970s lowered external total nitrogen loading by more than 50% within 3 years. Continuing nutrient management actions from public and private sectors were associated with a steadily declining total nitrogen load rate, despite an increase of more than 1 million people living within the Tampa Bay metropolitan area. Following recovery from an extreme weather event in 1997–1998, water clarity has increased significantly, and seagrass is expanding at a rate significantly different than before the event (Boesch 2019; Greening et al. 2018). Seagrass extent has increased by more than 65% since the 1980s, and in 2014 exceeded the recovery goal adopted in 1996 (Figure 4.13) (Greening et al. 2018).

Trends in mean annual chlorophyll-a concentrations and Secchi disk depth Seagrass extent and watershed population estimates for Tampa Bay. Produced by TBEP; data sources: Environmental Protection Commission of Hillsborough County (in public domain); Southwest Florida Water Management District (in public domain) and US Census Bureau (in public domain). Image: Greening et al. 2018, figure used with permission from Ed Sherwood, Executive Director. Tampa Bay Estuary Program
Key elements supporting the nutrient management strategy and concomitant ecosystem recovery in Tampa Bay include:
-
active community involvement, including agreement about quantifiable restoration goals;
-
regulatory and voluntary reduction in nutrient loadings from point, atmospheric and nonpoint sources;
-
long-term water quality and Seagrass extent monitoring; and
-
a commitment from public and private sectors to work together to attain restoration goals.
4.3.7 Kāne’ohe Bay, Oahu, Hawaii, USA
Sewage discharges into Kāne’ohe Bay, Hawaii, increased from the end Second World War due to increasing population and urbanisation, and reached a peak of 20 ML/d in 1977. This chronic discharge into the lagoon introduced high levels of inorganic nitrogen and inorganic phosphorus, with the southern lagoon waters becoming increasingly rich in phytoplankton (Figure 4.14). Reefs closest to the outfall became overgrown by filter-feeding organisms, such as sponges, tube-worms and barnacles. Reefs in the centre of the bay further from the outfalls were overgrown by the indigenous green algae Dictyosphaeria cavernosa. After diversion of the outfalls into the deeper ocean in 1978, coastal nutrient levels were reduced with corresponding declines in the phytoplankton and zooplankton populations and D. cavernosa abundance. At the same time, increases in the abundance and distribution of coral species were reported, as the reefs slowly recovered (Bahr et al. 2015). A drastic decline in previously dominant D. cavernosa occurred in 2006, attributed to a gradual return to a coral-dominated state following relocation of the sewage outfall in 1978 that eliminated the sewage nutrient inputs that drove the initial phase shift to macroalgae in the 1970s. However, urban stormwater runoff continues to cause short-term eutrophication of the bay (Drupp et al. 2011) via spikes in nitrogen inputs and subsequent phytoplankton blooms (Stimson 2015).

Kāne’ohe Bay with Moku O Loe island at right centre, Hawaii, USA. Image: NASA Earth Expeditions, National Aeronautics and Space Administration. NASA Official: Brian Dunbar
4.3.8 Pago Pago Harbour, American Samoa
Diverse coral communities have been monitored at Aua village in Pago Pago Harbour, American Samoa (Figure 4.15). Between the 1950s and 1980s, this area was seriously degraded by chronic pollution from two tuna canneries, fuel spills in the inner harbour and coastal development. By the 1970s, coral communities had declined substantially (Dahl and Lamberts 1977). Improved management of coastal development, fuel spills and the installation of a pipe to export wastewater from the tuna canneries to the harbour mouth have seen a significant recovery of coral communities on the reef crest and outer reef flat where there is consolidated reef substratum (up to 30 m behind the reef crest) (Birkeland et al. 2013). In contrast, it was found that recovery has been substantially slower or non-existent behind the reef crest, where the substratum is primarily loose rubble.

Pago Pago Harbor, American Samoa. Image: Tavita Togia, National Park Service of American Samoa, Wikimedia Commons
4.4 Time Lags and Non-linear Responses
In nutrient-enriched conditions, there are well-documented cases of eutrophic marine systems, dominated by algae, where reductions in nutrient loading have not returned the systems to their original ecological status (Duarte et al. 2008; Lotze et al. 2011b; McCracken and Phillips 2017) or where only partial recovery was observed (Borja et al. 2010a; Elliott and Whitfield 2011). This can be partly attributed to the range of other factors in the system that have dramatically changed during the period of increased nutrient loading, such as human population increases, increased carbon dioxide in the atmosphere, changed catchment hydrology and discharge volumes, global temperature increases and fish stock losses where the functioning of the system is highly modified from the original pristine state.
In coral reef systems, the issues of reversibility, time lags and phase change have been the subject of much recent research (Bruno et al. 2009; Dudgeon et al. 2010; Hughes et al. 2011; Wolff et al. 2018; MacNeil et al. 2019). However, further research is required on ecosystem responses to changing water quality, particularly in combination with other stressors such as climate change, to quantify the likely time lags of the response of the reef ecosystems and the nature and trajectory of the response (Devlin et al. 2021).
4.5 Management, Future Prospects and Conclusions
Four decades following the onset of major efforts to reverse widespread eutrophication of coastal ecosystems via improved sewage treatment, fertiliser management and erosion controls (i.e. from about 1980), evidence of improvement of ecosystem status is growing. However, cumulative pressures have developed in parallel to eutrophication, including those associated with climate change, such as warming, deoxygenation, ocean acidification and increased runoff. These additional pressures risk countering efforts to mitigate eutrophication and arrest coastal ecosystems in a state of eutrophication despite the efforts and significant resources already invested to revert coastal eutrophication (Duarte and Krause-Jensen 2018). With over 40% of the human population residing in coastal areas, ecosystem degradation in these areas can have disproportionate effects on society (Wright et al. 2006).
Given the seriousness of eutrophication, major efforts have been made to reduce nutrient inputs and hence restore ecosystems to their original state or at least to a better state (Conley et al. 2009) (Chapter 15). However, there are concerns about the possibility of a full restoration or the time required for impacted systems improving to a more desirable state (Duarte 2009). Although reversing the effects of eutrophication and achieving some recovery of marine ecosystems requires actions beyond reducing nutrient loading (Duarte 2009), implementing coordinated and long-term management strategies has led to at least partial recovery in some systems, albeit over long time periods (Borja et al. 2008, 2010a, b; Jones and Schmitz 2009). Recent reviews, however, have shown that, in many cases, coastal ecosystems are failing to meet their recovery objectives (Jeppesen et al. 2005; Duarte 2009; Duarte et al. 2008; Kemp et al. 2009; Borja et al. 2010a; Verdonschot et al. 2013, Lefcheck et al. 2018). The recent review by McCrackin et al. (2017) of 89 case studies of nutrient reductions and recovery of lakes and coastal marine ecosystems from eutrophication showed that for coastal marine areas only 24% achieved baseline conditions after the cessation or partial reduction of nutrients with most taking decades to recover. In a similar study, Gross and Hagy (2017) identified 16 case studies where nutrient reductions had been achieved and found that improvements in 8 studies had fallen short of stated restoration goals. Five more were successful initially, but their conditions subsequently declined. Three of the case studies achieved their goals fully and are currently managing to maintain the restored condition. It is of noteworthy interest that of the marine examples identified in McCrackin et al. (2017) and Gross and Hagy (2017), only one is in the tropics (Kaneohe Bay, Hawaii) and one in the sub-tropics (Tampa Bay, Florida).
A study by Desmit et al. (2018) shows that a significant decrease in nitrogen fluxes from land to sea is possible by adapting human activities in the watersheds, which prevents at least part of the eutrophication symptoms in the adjacent coastal zones. The United Nations Sustainable Development Goal (SDG) framework recognises the importance of monitoring oceans with a dedicated goal on oceans (SDG 14). Sustainable Development Goal SDG 14 Life below water sets the aim to conserve and sustainably use the oceans, seas and marine resources for sustainable development. This includes targets dedicated to coastal eutrophication and marine debris, marine area management and conservation. SDG 14.1 states by 2025, countries should prevent and significantly reduce marine pollution of all kinds, in particular from land-based activities, including marine debris and nutrient pollution. To assist towards SDG 14.1, UNEP is implementing a global initiative to address excess nitrogen in the environment and its negative effects via a project titled ‘Towards the Establishment of an International Nitrogen Management System’. It aims to provide recommendations on strategies to reduce emissions of reactive nitrogen, including measures to make production systems, especially farms, more efficient in their use of fertiliser. However, recent analyses have concluded that new initiatives, not just relying on the reduction of nutrient loadings, will be required to solve coastal and marine eutrophication issues. Duarte and Krause-Jensen (2018) suggest (from the abstract) that
“the time has arrived for a broader, more comprehensive approach to intervening to control eutrophication. Options for interventions include multiple levers controlling major pathways of nutrient budgets of coastal ecosystems, i.e., nutrient inputs, which is the intervention most commonly deployed, nutrient export, sequestration in sediments, and emissions of nitrogen to the atmosphere as N2 gas (denitrification). The levers involve local-scale hydrological engineering to increase flushing and nutrient export from (semi)enclosed coastal systems ecological engineering such as sustainable aquaculture of seaweeds and Mussels to enhance nutrient export and restoration of benthic habitats to increase sequestration in sediments as well as denitrification, and geo-engineering approaches including, with much precaution, aluminum injections in sediments.”
4.6 Summary
Eutrophication has been a key issue for coastal and marine waters for many years. The consequences of eutrophication are wide-ranging and can occur at both small and large scales, with multiple impacts on many parts of the marine environment. Negative impacts on the coastal and marine environment can result through the process of eutrophication as the marine environment becomes enriched with nutrients, increasing the amount of plant and algae growth to estuaries and coastal waters. Known consequences of nutrient enrichment in coastal and marine waters include increased primary production, increased biomass of primary producers such as phytoplankton and depletion of dissolved oxygen due to decomposition of accumulated biomass, resulting in local hypoxic or anoxic conditions. Other consequences can include shifts in species composition, blooms of nuisance and toxic algae and macroalgae, increased growth of epiphytic algae, red tides, water discolouration and foaming, loss of submerged vegetation due to shading and changes in benthic community structure due to oxygen deficiency or the presence of toxic phytoplankton species (Devlin et al. 2011). Our understanding of eutrophication has certainly improved over the last few decades, as long-term data sets provide a unique baseline to understand the changes and variability associated with long-term nutrient enrichment. Long-term studies have shown the impacts of eutrophication to be variable depending on the susceptibility of the coastal and marine system and require consideration of the many factors that influence that susceptibility and vulnerability (Cloern 2001; Cloern and Jassby 2009). Long-term data has also shown us that systems can recover, given enough time and ongoing management actions to reduce nutrients below acceptable thresholds.
Management of eutrophication has also improved over recent years, with programmes that focus across the catchment to the coast and look upstream to resolve the downstream eutrophication issues. Nutrient inputs to riverine and coastal systems come from a variety of diffuse sources (e.g. agricultural runoff and atmospheric deposition) and point sources (e.g. sewage treatment and industrial discharge). However, measures to reduce nitrogen and phosphorus inputs via targeted policies tend to focus on individual actions rather than addressing the wide range of activities that export nutrients into coastal waters. Future management should focus on parallel reductions in both nitrogen and phosphorus inputs to reduce coastal eutrophication and the impacts associated with an imbalanced nutrient system (Greenwood et al. 2019).
These long-term impacts on our coastal systems continue to degrade our coastal systems and impact coastal functioning. This is becoming increasingly more important as we recognise the importance of our coastal habitats in supporting biodiversity, carbon cycling, coastal protection and maintenance of a functioning food web. Management of eutrophication impacts must consider a changing baseline as climate change shifts coastal resilience with the cumulative and additive impacts of pollution and climate (Borja et al. 2010b). Management decisions must also reflect the recovery processes can be lengthy and require multiple facets of environmental management. Our coastal systems are integral to our environment, economy and community and urgently need long-term protection. These systems are facing an ever-increasing set of pressures, with climate change and extreme weather reducing the resilience of coastal waters. Eutrophication is an issue that can be solved, despite the complexity of the drivers and impacts, and the uncertainty and timing related to mitigation and recovery processes. There have, and continue to be, positive stories of systems recovering when nutrient inputs are reduced or eliminated. Solutions are possible, though almost never simple, and rely on a combination of long-term strategies, sewage and groundwater infrastructure, best management practices around agriculture and aquaculture, detailed monitoring and assessment and close partnerships between all stakeholders, public users and government.
4.7 Study Questions and Activities
-
1.
Research how sewage treatment plants work and create a diagram that shows the various steps in treatment processes.
-
2.
Four common N-containing fertilisers are ammonia [NH3], ammonium nitrate [NH4NO3], ammonium sulfate [(NH4)2SO4] and urea [(NH2)2CO]. How much of each compound must be used to provide 1 kg of N?
-
3.
Describe the process of eutrophication in your own words.
-
4.
Using the various case studies described in Section 4.3 create a single table that summarises the causes, effects of nutrient enrichment and what solutions have been used.
-
5.
Explore the recent media in your country and find an article about nutrient pollution. Critique the article and suggest some management options that will help mitigate the problem (see also Chapter 16).
Abbreviations
- CoTS:
-
Crown of Thorns Starfish
- Chl-a:
-
Chlorophyll-a
- DIN:
-
Dissolved inorganic nitrogen
- DON:
-
Dissolved organic nitrogen
- DOP:
-
Dissolved organic phosphorus
- GBR:
-
Great Barrier Reef
- HABs:
-
Harmful algal blooms
- PIN:
-
Particulate inorganic nitrogen
- PON:
-
Particulate organic nitrogen
- POP:
-
Particulate organic phosphorus
- SAV:
-
Submerged aquatic vegetation
- STP:
-
Sewage treatment plant
- USA:
-
United States of America
- TM4-ECPL:
-
Tracer Model 4 of the Environmental Chemical Processes Laboratory
References
Altieri AH, Harrison SB, Seemann J, Collin R, Diaz RJ, Knowlton N (2017) Tropical dead zones and mass mortalities on coral reefs’. Proc Natl Acad Sci 114(14):3660–3665
Andersen JH, Carstensen J, Conley DJ, Dromph K, Fleming‐Lehtinen V, Gustafsson BG, Josefson AB, Norkko A, Villnäs A, Murray C (2017) Long‐term temporal and spatial trends in eutrophication status of the Baltic Sea. Biol Rev 92(1):135–149
Anderson DM, Glibert PM, Burkholder JM (2002) Harmful algal blooms and eutrophication: nutrient sources, composition, and consequences. Estuaries 25(4):704–726
Asmala E, Carstensen J, Conley DJ, Slomp CP, Stadmark J, Voss M (2017) Efficiency of the coastal filter: nitrogen and phosphorus removal in the Baltic Sea. Limnol Oceanogr 62(S1):S222–S238
Bahr KD, Jokiel PL, Toonen RJ (2015) The unnatural history of Kāne ‘ohe Bay: coral reef resilience in the face of centuries of anthropogenic impacts. PeerJ 3:e950
Bainbridge Z, Lewis S, Bartley R, Fabricius K, Collier C, Waterhouse J, Garzon-Garcia A, Robson B, Burton J, Wenger A (2018) Fine sediment and particulate organic matter: a review and case study on ridge-to-reef transport, transformations, fates, and impacts on marine ecosystems. Mar Pollut Bull 135:1205–1220
Bakun A, Black BA, Bograd SJ, Garcia-Reyes M, Miller AJ, Rykaczewski RR, Sydeman WJ (2015) Anticipated effects of climate change on coastal upwelling ecosystems. Curr Clim Change Rep 1(2):85–93
Bauman AG, Burt JA, Feary DA, Marquis E, Usseglio P (2010) Tropical harmful algal blooms: an emerging threat to coral reef communities? Mar Pollut Bull 60(11):2117–2122
Bermejo R, Vergara JJ, Hernández I (2012) Application and reassessment of the reduced species list index for macroalgae to assess the ecological status under the water framework directive in the Atlantic coast of Southern Spain. Ecol Ind 12(1):46–57
Beusen AH, Bouwman AF, Van Beek LP, Mogollón JM, Middelburg JJ (2016) Global riverine N and P transport to ocean increased during the 20th century despite increased retention along the aquatic continuum. Biogeosciences 13(8):2441–2451
Birkeland C, Green A, Fenner D, Squair C, Dahl A (2013) Substratum stability and coral reef resilience: insights from 90 years of disturbances on a reef in American Samoa. Micronesica 6:1–16
Birrell CL, McCook LJ, Willis BL, Diaz-Pulido GA (2008) Effects of benthic algae on the replenishment of corals and the implications for the resilience of coral reefs. In: Oceanography and marine biology, pp 31–70. CRC Press
Boesch DF (2019) Barriers and bridges in abating coastal eutrophication. Front Mar Sci 6:123
Boesch DF, Brinsfield RB, Magnien RE (2001) Chesapeake Bay eutrophication. J Environ Qual 30(2):303–320
Borja Á (2005) The European water framework directive: a challenge for nearshore, coastal and continental shelf research. Cont Shelf Res 25(14):1768–1783
Borja A, Bricker SB, Dauer DM, Demetriades NT, Ferreira JG, Forbes AT, Hutchings P, Jia X, Kenchington R, Carlos Marques J, Zhu C (2008) Overview of integrative tools and methods in assessing ecological integrity in estuarine and coastal systems worldwide. Mar Pollut Bull 56(9):1519–1537
Borja Á, Dauer DM, Elliott M, Simenstad CA (2010a) Medium-and long-term recovery of estuarine and coastal ecosystems: patterns, rates and restoration effectiveness. Estuaries Coasts 33(6):1249–1260
Borja Á, Elliott M, Carstensen J, Heiskanen A-S, van de Bund W (2010b) Marine management—Towards an integrated implementation of the European Marine Strategy Framework and the water framework directives. Mar Pollut Bull 60(12):2175–2186
Bouwman A, Beusen AH, Billen G (2009) Human alteration of the global nitrogen and phosphorus soil balances for the period 1970–2050. Glob Biogeochem Cycles 23(4)
Bouwman A, Van Drecht G, Knoop J, Beusen A, Meinardi C (2005) Exploring changes in river nitrogen export to the worlds oceans. Glob Biogeochem Cycles 19(1)
Boyd CE (2020) Water quality—An introduciton, 3rd edn. Spinger, Cham, p 440
Breitburg D, Levin LA, Oschlies A, Grégoire M, Chavez FP, Conley DJ, Garçon V, Gilbert D, Gutiérrez D, Isensee K (2018) Declining oxygen in the global ocean and coastal waters. Science 359(6371):eaam7240
Bricker SB, Longstaff B, Dennison W, Jones A, Boicourt K, Wicks C, Woerner J (2008) Effects of nutrient enrichment in the nations estuaries: a decade of change. Harmful Algae 8(1):21–32
Brodie G, Brodie J, Maata M, Peter M, Otiawa T, Devlin M (2020) Seagrass habitat in Tarawa Lagoon, Kiribati: service benefits and links to national priority issues. Mar Pollut Bull 155:111099
Brodie J (1992) Enhancement of larval and juvenile survival and recruitment in Acanthaster planci: effects of terrestrial runoff—A review. Aust J Mar Freshw Res 43:539–554
Brodie J, Devlin M, Haynes D, Waterhouse J (2011) Assessment of the eutrophication status of the Great Barrier Reef lagoon (Australia). Biogeochemistry 106(2):281–302
Brodie J, Devlin M, Lewis S (2017) Potential enhanced survivorship of crown of thorns starfish larvae due to near-annual nutrient enrichment during secondary outbreaks on the central mid-shelf of the Great Barrier Reef, Australia. Diversity 9(1):17
Brodie J, Fabricius K, Death G, Okaji K (2005) Are increased nutrient inputs responsible for more outbreaks of crown-of-thorns starfish? An appraisal of the evidence. Mar Pollut Bull 51(1–4):266–278
Brodie J, Waterhouse J, Schaffelke B, Johnson J, Kroon F, Thorburn P, Rolfe J, Lewis S, Warne MStJ, Fabricius K (2013) Reef water quality scientific consensus statement 2013. Department of the Premier and Cabinet, Queensland Government, Brisbane
Bruno JF, Sweatman H, Precht WF, Selig ER, Schutte VG (2009) Assessing evidence of phase shifts from coral to macroalgal dominance on coral reefs. Ecology 90(6):1478–1484
Burson A, Stomp M, Akil L, Brussaard CP, Huisman J (2016) Unbalanced reduction of nutrient loads has created an offshore gradient from phosphorus to nitrogen limitation in the North Sea. Limnol Oceanogr 61(3):869–888
Cai W-J, Hu X, Huang W-J, Murrell MC, Lehrter JC, Lohrenz SE, Chou W-C, Zhai W, Hollibaugh JT, Wang Y (2011) Acidification of subsurface coastal waters enhanced by eutrophication. Nat Geosci 4(11):766
Carpenter SR, Caraco NF, Correll DL, Howarth RW, Sharpley AN, Smith VH (1998) Nonpoint pollution of surface waters with phosphorus and nitrogen. Ecol Appl 8(3):559–568
Charlier RH, Morand P, Finkl CW (2008) How Brittany and Florida coasts cope with green tides. Int J Environ Stud 65(2):191–208
Chazottes V, Hutchings P, Osorno A (2017) Impact of an experimental eutrophication on the processes of bioerosion on the reef. One Tree Island, Great Barrier Reef, Australia. Mar Pollut Bull 118(1–2):125–130
Cloern J (2001) Our evolving conceptual model of the coastal eutrophication problem. Mar Ecol Prog Ser 210:223–253
Cloern JE, Abreu PC, Carstensen J, Chauvaud L, Elmgren R, Grall J, Greening H, Johansson JOR, Kahru M, Sherwood ET (2016) Human activities and climate variability drive fast-paced change across the worlds estuarine-coastal ecosystems. Glob Change Biol 22(2):513–529
Cloern JE, Jassby AD (2009) Patterns and scales of phytoplankton variability in estuarine-coastal ecosystems. Estuaries Coasts 33(2):230–241
Collier C, Adams M, Langlois L, Waycott M, O’Brien K, Maxwell P, McKenzie L (2016) Thresholds for morphological response to light reduction for four tropical seagrass species. Ecol Ind 67:358–366
Conley DJ, Paerl HW, Howarth RW, Boesch DF, Seitzinger SP, Havens KE, Lancelot C, Likens GE (2009) Controlling eutrophication: nitrogen and phosphorus. Science 323(5917):1014–1015
Crain CM, Kroeker K, Halpern BS (2008) Interactive and cumulative effects of multiple human stressors in marine systems. Ecol Lett 11(12):1304–1315
D’Angelo C, Wiedenmann J (2014) Impacts of nutrient enrichment on coral reefs: new perspectives and implications for coastal management and reef survival. Curr Opin Environ Sustain 7:82–93
Dahl AL, Lamberts AE (1977) Environmental impact on a Samoan coral reef: a resurvey of Mayors 1917 transect. Pac Sci 31(3):309–319
De’ath D, Fabricius K (2010) Water quality as a regional driver of coral biodiversity and macroalgae on the Great Barrier Reef. Ecol Appl 20(3):840–850
De’ath G, Fabricius KE, Sweatman H, Puotinen M (2012) The 27–year decline of coral cover on the Great Barrier Reef and its causes. Proc Natl Acad Sci 109(44):17995–17999
DeCarlo TM, Cohen AL, Barkley HC, Cobban Q, Young C, Shamberger KE, Brainard RE, Golbuu Y (2015) Coral macrobioerosion is accelerated by ocean acidification and nutrients. Geology 43(1):7–10
Desmit X, Thieu V, Billen G, Campuzano F, Dulière V, Garnier J, Lassaletta L, Ménesguen A, Neves R, Pinto L, Silvestre M (2018) Reducing marine eutrophication may require a paradigmatic change. Sci Total Environ 635:1444–1466
Devlin M, Best M, Haynes D (2007) Implementation of the water framework directive in European marine waters. Mar Pollut Bull 55(1–6):1–2
Devlin M, Bricker S, Painting S (2011) Comparison of five methods for assessing impacts of nutrient enrichment using estuarine case studies. Biogeochemistry 106(2):177–205
Devlin M, Schaffelke B (2009) Spatial extent of riverine flood plumes and exposure of marine ecosystems in the Tully coastal region, Great Barrier Reef. Mar Freshw Res 60(11):1109–1122
Devlin M, Waterhouse J, Taylor J, Brodie J (2001) Flood plumes in the Great Barrier Reef: spatial and temporal patterns in composition and distribution. Great Barrier Reef Marine Park Authority, p 113. Available at: https://elibrary.gbrmpa.gov.au/jspui/handle/11017/354. Accessed 14 Jan 2022
Devlin MJ, da Silva E, Petus C, Wenger A, Zeh D, Tracey D, Álvarez-Romero JG, Brodie J (2013) Combining in-situ water quality and remotely sensed data across spatial and temporal scales to measure variability in wet season chlorophyll-a: Great Barrier Reef lagoon (Queensland, Australia). Ecol Processes 2(1):31
Devlin MJ, Lyons BP, Johnson JE, Hills JM (2021) The tropical Pacific Oceanscape: current issues, solutions and future possibilities. Mar Pollut Bull 166:112181
Devlin MJ, McKinna LW, Alvarez-Romero JG, Petus C, Abott B, Harkness P, Brodie J (2012) Mapping the pollutants in surface riverine flood plume waters in the Great Barrier Reef, Australia. Mar Pollut Bull 65(4–9):224–235
Diaz RJ, Rosenberg R (2008) Spreading dead zones and consequences for marine ecosystems. Science 321(5891):926–929
Drupp P, De Carlo EH, Mackenzie FT, Bienfang P, Sabine CL (2011) Nutrient inputs, phytoplankton response, and CO2 variations in a semi-enclosed subtropical embayment, Kaneohe Bay, Hawaii. Aquat Geochem 17(4–5):473–498
Duarte CM (2009) Coastal eutrophication research: a new awareness. Hydrobiologia 629(1):263–269
Duarte CM, Conley DJ, Carstensen J, Sánchez-Camacho M (2008) Return to neverland: shifting baselines affect eutrophication restoration targets. Estuaries Coasts 32(1):29–36
Duarte CM, Krause-Jensen D (2018) Intervention options to accelerate ecosystem recovery from coastal eutrophication. Front Mar Sci 5:470
Duce RA, LaRoche J, Altieri K, Arrigo KR, Baker AR, Capone DG, Cornell S, Dentener F, Galloway J, Ganeshram RS, Geider RJ (2008) Impacts of atmospheric anthropogenic nitrogen on the open ocean. Science 320(5878):893–897
Dudgeon SR, Aronson RB, Bruno JF, Precht WF (2010) Phase shifts and stable states on coral reefs. Mar Ecol Prog Ser 413:201–216
Ekau W, Auel H, Pörtner H-O, Gilbert D (2010) Impacts of hypoxia on the structure and processes in pelagic communities (zooplankton, macro-invertebrates and fish). Biogeosciences 7(5):1669–1699
Elliott M, Whitfield AK (2011) Challenging paradigms in estuarine ecology and management. Estuar Coast Shelf Sci 94(4):306–314
Ellis JD (2017) J Appl Commun 101(1) Full Issue
Elmgren R, Blenckner T, Andersson A (2015) Baltic Sea management: successes and failures. Ambio 44(3):335–344
Fabricius KE, Cséke S, Humphrey C, De’ath G (2013) Does trophic status enhance or reduce the thermal tolerance of scleractinian corals? A review, experiment and conceptual framework. PloS One 8(1):e54399
Fabricius KE, Okaji K, De’ath G (2010) Three lines of evidence to link outbreaks of the crown-of-thorns seastar Acanthaster planci to the release of larval food limitation. Coral Reefs 29(3):593–605
FAO (Food and Agricutlure Organisation of the United Nations) (2012) FAO statistical yearbook. Available at: https://www.fao.org/3/i2490e/i2490e00.htm. Accessed 14 January 2022
Ferreira JG, Andersen JH, Borja A, Bricker SB, Camp J, Cardoso da Silva M, Garcés E, Heiskanen A-S, Humborg C, Ignatiades L, Lancelot C, Menesguen A, Tett P, Hoepffner N, Claussen U (2011) Overview of eutrophication indicators to assess environmental status within the European Marine Strategy Framework Directive. Estuar Coast Shelf Sci 93(2):117–131
Fowler D, Coyle M, Skiba U, Sutton MA, Cape JN, Reis S, Sheppard LJ, Jenkins A, Grizzetti B, Galloway JN (2013) The global nitrogen cycle in the twenty-first century. Philos Trans R Soc B: Biol Sci 368(1621):20130164
Galloway JN, Townsend AR, Erisman JW, Bekunda M, Cai Z, Freney JR, Martinelli LA, Seitzinger SP, Sutton MA (2008) Transformation of the nitrogen cycle: recent trends, questions, and potential solutions. Science 320(5878):889–892
Galloway JN, Winiwarter W, Leip A, Leach AM, Bleeker A, Erisman JW (2014) Nitrogen footprints: past, present and future. Environ Res Lett 9(11):115003
Gaspar R, Marques L, Pinto L, Baeta A, Pereira L, Martins I, Marques JC, Neto JM (2017) Origin here, impact there—The need of integrated management for river basins and coastal areas. Ecol Ind 72:794–802
Greening H, Janicki A, Sherwood ET, Pribble R, Johansson JOR (2014) Ecosystem responses to long-term nutrient management in an urban estuary: Tampa Bay, Florida, USA. Estuar Coast Shelf Sci 151:A1–A16
Geider R, La Roche J (2002) Redfield revisited: variability of C:N:P in marine microalgae and its biochemical basis. Eur J Phycol 37(1):1–17
Gilbert D, Rabalais N, Diaz R, Zhang J (2010) Evidence for greater oxygen decline rates in the coastal ocean than in the open ocean. Biogeosciences 7(7):2283
Glibert P, Bouwman L (2012) Land-based nutrient pollution and the relationship to harmful algal blooms in coastal marine systems. LOICZ Newslett Inprint 2:5–7
Glibert PM (2017) Eutrophication, harmful algae and biodiversity—Challenging paradigms in a world of complex nutrient changes. Mar Pollut Bull 124(2):591–606
Glibert PM, Burford MA (2017) Globally changing nutrient loads and harmful algal blooms: recent advances, new paradigms, and continuing challenges. Oceanography 30(1):58–69
Glynn PW, Manzello DP, Enochs IC (eds) (2017) Coral Reefs of the Eastern Tropical Pacific: persistence and loss in a dynamic environment. Springer, Dordrecht, p 548
Gower J, King S (2019) Seaweed, seaweed everywhere. Science 365(6448):27–27
Greening H, Janicki A, Sherwood ET (2018) Seagrass recovery in Tampa Bay, Florida (USA). In: The wetland book: II: distribution, description, and conservation, pp 495–506. Springer, Dordrecht
Greenwood N, Devlin MJ, Best M, Fronkova L, Graves CA, Milligan A, Barry J, Van Leeuwen SM (2019) Utilizing eutrophication assessment directives from transitional to marine systems in the Thames Estuary and Liverpool Bay, UK. Front Mar Sci 6:116
Gross C, Hagy JD (2017) Attributes of successful actions to restore lakes and estuaries degraded by nutrient pollution. J Environ Manage 187:122–136
Gruber N, Galloway JN (2008) An Earth-system perspective of the global nitrogen cycle. Nature 451(7176):293
Gustafsson BG, Schenk F, Blenckner T, Eilola K, Meier HM, Müller-Karulis B, Neumann T, Ruoho-Airola T, Savchuk OP, Zorita E (2012) Reconstructing the development of Baltic Sea eutrophication 1850–2006. Ambio 41(6):534–548
Haapkylä J, Unsworth RK, Flavell M, Bourne DG, Schaffelke B, Willis BL (2011) Seasonal rainfall and runoff promote coral disease on an inshore reef. PLoS ONE 6(2):e16893
Halpern BS, Walbridge S, Selkoe KA, Kappel CV, Micheli F, D’agrosa C, Bruno JF, Casey KS, Ebert C, Fox HE (2008) A global map of human impact on marine ecosystems. Science 319(5865):948–952
Harding L Jr, Perry E (1997) Long-term increase of phytoplankton biomass in Chesapeake Bay, 1950–1994. Mar Ecol Prog Ser 157:39–52
Harding LW (1994) Long-term trends in the distribution of phytoplankton in Chesapeake Bay: roles of light, nutrients and streamflow. Mar Ecol Prog Ser 104:267–267
Harvell D, Jordán-Dahlgren E, Merkel S, Rosenberg E, Raymundo L, Smith G, Weil E, Willis B (2007) Coral disease, environmental drivers, and the balance between coral and microbial associates. Oceanography 20:172–195
Hauri C, Fabricius KE, Schaffelke B, Humphrey C (2010) Chemical and physical environmental conditions underneath mat-and canopy-forming macroalgae, and their effects on understorey corals. PLoS ONE 5(9):e12685
Heffer P, Prud’homme M (2012) Fertilizer Outlook 2012–2016. International Fertilizer Industry Association (IFA), Paris, France. Available at http://www.anpifert.pt/Destaques/2012_doha_ifa_summary.pdf. Accessed 14 Jan 2022
Heffer P, Prud’homme M (2013) Fertiliser Outlook 2013–1017. In: Proceedings of the 81st international fertilizer industry association conference. Available at: https://www.fertilizer.org/Search?SearchTerms=81st+. Accessed 14 Jan 2022
Heffer P, Prud’homme M (2014) Fertilizer Outlook 2014–2018. International Fertilizer Industry Association (IFA). Paris, France. Avaiable at: https://www.fertilizer.org/images/Library_Downloads/2014_ifa_sydney_summary.pdf. Accessed 14 Jan 2022
Heffer P, Prud’homme M (2015) Fertilizer Outlook 2015–2019. In: 83rd IFA annual conference. International Fertilizer Industry Association (IFA). Istanbul, (Turkey). Available at: https://www.fertilizer.org/images/Library_Downloads/2015_ifa_istanbul_summary.pdf. Accessed 14 Jan 2022
Heisler J, Glibert PM, Burkholder JM, Anderson DM, Cochlan W, Dennison WC, Dortch Q, Gobler CJ, Heil CA, Humphries E (2008) Eutrophication and harmful algal blooms: a scientific consensus. Harmful Algae 8(1):3–13
Howarth R, Paerl HW (2008) Coastal marine eutrophication: Control of both nitrogen and phosphorus is necessary. Proc Natl Acad Sci 105(49):E103–E103
Howarth RW, Marino R (2006). Nitrogen as the limiting nutrient for eutrophication in coastal marine ecosystems: evolving views over three decades. Limnol Oceanogr 51(1 part2):364–376
Hudnell HK (2008) Cyanobacterial harmful algal blooms: state of the science and research needs. Springer, New York, p 950
Hughes T, Bellwood D, Baird A, Brodie J, Bruno J, Pandolfi J (2011) Shifting base-lines, declining coral cover, and the erosion of reef resilience: comment on Sweatman et al. (2011). Coral Reefs 30(3):653–660
Humanes A, Noonan SH, Willis BL, Fabricius KE, Negri AP (2016) Cumulative effects of nutrient enrichment and elevated temperature compromise the early life history stages of the coral Acropora tenuis. PLoS ONE 11(8):e0161616
Hutchings P, Peyrot-Clausade M, Osnorno A (2005). Influence of land runoff on rates and agents of bioerosion of coral substrates. Mar Pollu Bull 51(1–4):438–447
Jacquet S, Delesalle B, Torréton J-P, Blanchot J (2006) Response of phytoplankton communities to increased anthropogenic influences (southwestern lagoon, New Caledonia). Mar Ecol Prog Ser 320:65–78
Jeppesen E, Jensen JP, Soendergaard M, Lauridsen TL (2005) Response of fish and plankton to nutrient loading reduction in eight shallow Danish lakes with special emphasis on seasonal dynamics. Freshw Biol 50(10):1616–1627
Jickells T, Buitenhuis E, Altieri K, Baker A, Capone D, Duce R, Dentener F, Fennel K, Kanakidou M, LaRoche J (2017) A reevaluation of the magnitude and impacts of anthropogenic atmospheric nitrogen inputs on the ocean. Glob Biogeochem Cycles 31(2):289–305
Jickells T, Weston K (2011a) Nitrogen cycle–external cycling: losses and gains. Health Environ Res Online pp 261–278
Jickells TD, Weston K (2011b) 5.08 Nitrogen cycle—External cycling: losses and gains. In: Mclusky D, Wolanski E (eds) Treatise on Estuarine and Coastal Science. Academic Press, Waltham, pp 261–278
Johnson A, Harrison M (2015) The increasing problem of nutrient runoff on the coast: as development increases along coastlines worldwide, water quality—And everything that depends on it—Degrades. Am Sci 103(2):98–102
Jones HP, Schmitz OJ (2009) Rapid recovery of damaged ecosystems. PLoS ONE 4(5):e5653
Kemp W, Boynton W, Adolf J, Boesch D, Boicourt W, Brush G, Cornwell J, Fisher T, Glibert P, Hagy J (2005) Eutrophication of Chesapeake Bay: historical trends and ecological interactions. Mar Ecol Prog Ser 303(21):1–29
Kemp W, Testa J, Conley D, Gilbert D, Hagy J (2009) Temporal responses of coastal hypoxia to nutrient loading and physical controls. Biogeosciences 6(12):2985–3008
Kroeze C, Seitzinger SP (1998) Nitrogen inputs to rivers, estuaries and continental shelves and related nitrous oxide emissions in 1990 and 2050: a global model. Nutr Cycl Agroecosyst 52(2–3):195–212
Lamb JB, Wenger AS, Devlin MJ, Ceccarelli DM, Williamson DH, Willis BL (2016) Reserves as tools for alleviating impacts of marine disease. Philos Trans R Soc B: Biol Sci 371(1689):20150210
Lamb JB, Willis BL, Fiorenza EA, Couch CS, Howard R, Rader DN, True JD, Kelly LA, Ahmad A, Jompa J (2018) Plastic waste associated with disease on coral reefs. Science 359(6374):460–462
Langin K (2018) Seaweed masses assault Caribbean islands. Science 360(6394):1157–1158
Lapointe BE, Burkholder JM, Van Alstyne KL (2018) Harmful macroalgal blooms in a changing world: causes, impacts, and management. In: Shumway S, Burkholder J, Morton S (eds) Harmful algal blooms: a compendium desk reference. John Wiley & Sons, Hoboken, pp 515–560
Lapointe BE, Herren LW, Brewton RA, Alderman P (2019) Nutrient over-enrichment and light limitation of seagrass communities in the Indian River Lagoon, an urbanized subtropical estuary. Sci Total Environ 134068
Le Grand HM, Fabricius K (2011) Relationship of internal macrobioeroder densities in living massive Porites to turbidity and chlorophyll on the Australian Great Barrier Reef. Coral Reefs 30(1):97–107
Le Moal M, Gascuel-Odoux C, Ménesguen A, Souchon Y, Étrillard C, Levain A, Moatar F, Pannard A, Souchu P, Lefebvre A (2019) Eutrophication: a new wine in an old bottle? Sci Total Environ 651:1–11
Lee M, Shevliakova E, Stock CA, Malyshev S, Milly PC (2019) Prominence of the tropics in the recent rise of global nitrogen pollution. Nat Commun 10(1):1437
Lefcheck JS, Orth RJ, Dennison WC, Wilcox DJ, Murphy RR, Keisman J, Gurbisz C, Hannam M, Landry JB, Moore KA (2018) Long-term nutrient reductions lead to the unprecedented recovery of a temperate coastal region. Proc Natl Acad Sci 115(14):3658–3662
Liu X, Duan L, Mo J, Du E, Shen J, Lu X, Zhang Y, Zhou X, He C, Zhang F (2011) Nitrogen deposition and its ecological impact in China: an overview. Environ Pollut 159(10):2251–2264
Liu D, Keesing JK, He P, Wang Z, Shi Y, Wang Y (2013a) The worlds largest macroalgal bloom in the Yellow Sea, China: formation and implications. Estuar Coast Shelf Sci 129:2–10
Liu X, Zhang Y, Han W, Tang A, Shen J, Cui Z, Vitousek P, Erisman JW, Goulding K, Christie P (2013b) Enhanced nitrogen deposition over China. Nature 494(7438):459
Liu S, Xie Z, Zeng Y, Liu B, Li R, Wang Y, Wang L, Qin P, Jia B, Xie J (2019) Effects of anthropogenic nitrogen discharge on dissolved inorganic nitrogen transport in global rivers. Glob Change Biol 25(4):1493–1513
Lotze HK, Coll M, Dunne JA (2011a) Historical changes in marine resources, food-web structure and ecosystem functioning in the Adriatic Sea, Mediterranean. Ecosystems 14(2):198–222
Lotze HK, Coll M, Magera AM, Ward-Paige C, Airoldi L (2011b) Recovery of marine animal populations and ecosystems. Trends Ecol Evol 26(11):595–605
Louime C, Fortune J, Gervais G (2017) Sargassum invasion of coastal environments: a growing concern. Am J Environ Sci 13(1):58–64
Lu CC, Tian H (2017) Global nitrogen and phosphorus fertilizer use for agriculture production in the past half century: shifted hot spots and nutrient imbalance. Earth Syst Sci Data 9:181
MacNeil MA, Mellin C, Matthews S, Wolff NH, McClanahan TR, Devlin M, Drovandi C, Mengersen K, Graham NAJ (2019) Water quality mediates resilience on the Great Barrier Reef. Nat Ecol Evol 3:620–627
Maynard J, Van Hooidonk R, Eakin CM, Puotinen M, Garren M, Williams G, Heron SF, Lamb J, Weil E, Willis B (2015) Projections of climate conditions that increase coral disease susceptibility and pathogen abundance and virulence. Nat Clim Chang 5(7):688
McCook L, Jompa J, Diaz-Pulido G (2001) Competition between corals and algae on coral reefs: a review of evidence and mechanisms. Coral Reefs 19(4):400–417
McCracken K, Phillips DR (2017) Global health: an introduction to current and future trends, 2nd edn. Routledge: Taylor and Francis Group, p 466
McCrackin ML, Jones HP, Jones PC, Moreno‐Mateos D (2017) Recovery of lakes and coastal marine ecosystems from eutrophication: a global meta‐analysis. Limnol Oceanogr 62(2):507–518
Mee LD (1992) The Black Sea in crisis: a need for concerted international action. Ambio 21(4):278–286
Mills MM, Ridame C, Davey M, La Roche J, Geider RJ (2004) Iron and phosphorus co-limit nitrogen fixation in the eastern tropical North Atlantic. Nature 429(6989):292–294
Morrow KM, Bromhall K, Motti CA, Munn CB, Bourne DG (2017) Allelochemicals produced by brown macroalgae of the Lobophora genus are active against coral larvae and associated bacteria, supporting pathogenic shifts to Vibrio dominance. Appl Environ Microbiol 83(1):e02391-e2416
Murray CJ, Muller-Karulis B, Carstensen J, Conley DJ, Gustafsson B, Andersen JH (2019) Past, present and future eutrophication status of the Baltic Sea. Front Mar Sci 6:2
Newton A, Icely J, Cristina S, Brito A, Cardoso AC, Colijn F, Dalla Riva S, Gertz F, Hansen JW, Holmer M (2014) An overview of ecological status, vulnerability and future perspectives of European large shallow, semi-enclosed coastal systems, lagoons and transitional waters. Estuar Coastal Shelf Sci 140:95–122
Nixon SW (1995) Coastal marine eutrophication: a definition, social causes, and future concerns. Ophelia 41(1):199–219
Nixon SW (2009) Eutrophication and the macroscope. Hydrobiologia 629(1):5–19
O'Brien PA, Morrow KM, Willis BL, Bourne DG (2016) Implications of ocean acidification for marine microorganisms from the free-living to the host-associated. Front Marine Sci 3:47
Odebrecht C, Villac MC, Abreu PC, Haraguchi L, Gomes PD, Tenenbaum DR (2018) Flagellates versus diatoms: phytoplankton trends in tropical and subtropical estuarine-coastal ecosystems. In: Hoffmeyer M, Sabatini M, Brandini F, Calliari D, Santinelli N (eds) Plankton ecology of the Southwestern Atlantic. Springer, Cham¸ pp 249–267
Osborne K, Dolman AM, Burgess SC, Johns KA (2011) Disturbance and the dynamics of coral cover on the Great Barrier Reef (1995–2009). PLoS ONE 6(3):e17516
Paerl HW (2006) Assessing and managing nutrient-enhanced eutrophication in estuarine and coastal waters: interactive effects of human and climatic perturbations. Ecol Eng 26(1):40–54
Paerl HW (2009) Controlling Eutrophication along the freshwater–marine continuum: dual nutrient (N and P) reductions are essential. Estuaries Coasts 32(4):593–601
Paerl HW, Hall NS, Peierls BL, Rossignol KL (2014) Evolving paradigms and challenges in estuarine and coastal eutrophication dynamics in a culturally and climatically stressed world. Estuaries Coasts 37(2):243–258
Pearce F (2018) When the rivers run dry, fully revised and updated edition: water-the defining crisis of the twenty-first century. Beacon Press,, Boston, p 328
Penuelas J, Poulter B, Sardans J, Ciais P, Van Der Velde M, Bopp L, Boucher O, Godderis Y, Hinsinger P, Llusia J (2013) Human-induced nitrogen–phosphorus imbalances alter natural and managed ecosystems across the globe. Nat Commun 4(1):1–10
Perrot T, Rossi N, Ménesguen A, Dumas F (2014) Modelling green macroalgal blooms on the coasts of Brittany, France to enhance water quality management. J Mar Syst 132:38–53
Petus C, Collier C, Devlin M, Rasheed M, McKenna S (2014) Using MODIS data for understanding changes in seagrass meadow health: a case study in the Great Barrier Reef (Australia). Mar Environ Res 98:68–85
Pollock FJ, Lamb JB, Field SN, Heron SF, Schaffelke B, Shedrawi G, Bourne DG, Willis BL (2014) Sediment and turbidity associated with offshore dredging increase coral disease prevalence on nearby reefs. PLoS ONE 9(7):e102498
Potter IC, Veale L, Tweedley JR, Clarke KR (2016) Decadal changes in the ichthyofauna of a eutrophic estuary following a remedial engineering modification and subsequent environmental shifts. Estuar Coast Shelf Sci 181:345–363
Powley HR, Dürr HH, Lima AT, Krom MD, Van Cappellen P (2016) Direct discharges of domestic wastewater are a major source of phosphorus and nitrogen to the Mediterranean Sea. Environ Sci Technol 50(16):8722–8730
Pratchett M, Caballes C, Wilmes J, Matthews S, Mellin C, Sweatman H, Nadler L, Brodie J, Thompson C, Hoey J (2017) Thirty years of research on crown-of-thorns starfish (1986–2016): scientific advances and emerging opportunities. Diversity 9(4):41
Prouty NG, Cohen A, Yates KK, Storlazzi CD, Swarzenski PW, White D (2017) Vulnerability of coral reefs to bioerosion from land-based sources of pollution. J Geophys Res: Oceans 122(12):9319–9331
Rabalais NN, Cai W-J, Carstensen J, Conley DJ, Fry B, Hu X, Quinones-Rivera Z, Rosenberg R, Slomp CP, Turner RE (2014) Eutrophication-driven deoxygenation in the coastal ocean. Oceanography 27(1):172–183
Rabalais NN, Turner RE, Díaz RJ, Justić D (2009) Global change and eutrophication of coastal waters. ICES J Mar Sci 66(7):1528–1537
Resiere D, Valentino R, Nevière R, Banydeen R, Gueye P, Florentin J, Cabié A, Lebrun T, Mégarbane B, Guerrier G (2018) Sargassum seaweed on Caribbean islands: an international public health concern. The Lancet 392(10165):2691
Richlen ML, Morton SL, Jamali EA, Rajan A, Anderson DM (2010) The catastrophic 2008–2009 red tide in the Arabian gulf region, with observations on the identification and phylogeny of the fish-killing dinoflagellate Cochlodinium polykrikoides. Harmful Algae 9(2):163–172
Riemann B, Carstensen J, Dahl K, Fossing H, Hansen JW, Jakobsen HH, Josefson AB, Krause-Jensen D, Markager S, Stæhr PA (2016) Recovery of Danish coastal ecosystems after reductions in nutrient loading: a holistic ecosystem approach. Estuaries Coasts 39(1):82–97
Righetti D, Vogt M, Gruber N, Psomas A, Zimmermann NE (2019) Global pattern of phytoplankton diversity driven by temperature and environmental variability. Sci Adv 5(5):eaau6253
Rockström J, Steffen W, Noone K, Persson Å, Chapin FS III, Lambin EF, Lenton TM, Scheffer M, Folke C, Schellnhuber HJ (2009) A safe operating space for humanity. Nature 461(7263):472
Rosenberg R, Cato I, Förlin L, Grip K, Rodhe J (1996) Marine environment quality assessment of the Skagerrak-Kattegat. J Sea Res 35(1–3):1–8
Rosset S, Wiedenmann J, Reed AJ, D’Angelo C (2017) Phosphate deficiency promotes coral bleaching and is reflected by the ultrastructure of symbiotic dinoflagellates. Mar Pollut Bull 118(1–2):180–187
Schaffelke B, Collier C, Kroon F, Lough J, McKenzie L, Ronan M, Uthicke S, Brodie J (2017) Scientific consensus statement 2017. A synthesis of the science of land-based water quality impacts on the Great Barrier Reef, Chapter 1: The Condition of Coastal and Marine Ecosystems of the Great Barrier Reef and Their Responses to Water Quality and Disturbances. State of Queensland. Avaialbe at: https://www.reefplan.qld.gov.au/__data/assets/pdf_file/0030/45993/2017-scientific-consensus-statement-summary-chap01.pdf. Accessed 14 Jan 2022
Seitzinger S, Harrison J, Dumont E, Beusen AH, Bouwman A (2005) Sources and delivery of carbon, nitrogen, and phosphorus to the coastal zone: an overview of global Nutrient Export from Watersheds (NEWS) models and their application. Glob Biogeochem Cycles 19(4):GB4S01
Seitzinger S, Mayorga E, Bouwman A, Kroeze C, Beusen A, Billen G, Van Drecht G, Dumont E, Fekete B, Garnier J (2010) Global river nutrient export: a scenario analysis of past and future trends. Glob Biogeochem Cycles 24(4):GB0A08
Smetacek V, Zingone A (2013) Green and golden seaweed tides on the rise. Nature 504(7478):84–88
Smith VH, Schindler DW (2009) Eutrophication science: where do we go from here? Trends Ecol Evol 24(4):201–207
Steffen W, Richardson K, Rockström J, Cornell SE, Fetzer I, Bennett EM, Biggs R, Carpenter SR, De Vries W, De Wit CA (2015) Planetary boundaries: guiding human development on a changing planet. Science 347(6223):1259855
Stimson J (2015) Long-term record of nutrient concentrations in Kāne ‘ohe Bay, O ‘ahu, Hawai ‘i, and its relevance to onset and end of a phase shift involving an indigenous alga, Dictyosphaeria cavernosa1. Pac Sci 69(3):319–340
Svendsen LM, Gustafsson B, Larsen SE, Sonesten L, Frank-Kamenetsky D (2018). Inputs of nutrients (nitrogen and phosphorus) to the Sub-basins of the Baltic Sea (2016). HELCROM core indicator report, p 30
Tett P, Droop M, Heaney S (1985) The Redfield ratio and phytoplankton growth rate. J Mar Biol Assoc UK 65(2):487–504
Tett P, Gowen R, Mills D, Fernandes T, Gilpin L, Huxham M, Kennington K, Read P, Service M, Wilkinson M (2007) Defining and detecting undesirable disturbance in the context of marine eutrophication. Mar Pollu Bull 55(1):282–297
Thompson A, Schroeder T, Brando VE, Schaffelke B (2014) Coral community responses to declining water quality: Whitsunday Islands, Great Barrier Reef, Australia. Coral Reefs 33(4):923–938
Thurber RV, Payet JP, Thurber AR, Correa AM (2017) Virus–host interactions and their roles in coral reef health and disease. Nat Rev Microbiol 15(4):205
Ulloa MJ, Álvarez-Torres P, Horak-Romo KP, Ortega-Izaguirre R (2017) Harmful algal blooms and eutrophication along the Mexican coast of the Gulf of Mexico large marine ecosystem. Environ Dev 22:120–128
Van Drecht G, Bouwman A, Harrison J, Knoop J (2009) Global nitrogen and phosphate in urban wastewater for the period 1970–2050. Glob Biogeochem Cycles 23(4)
Vega Thurber RL, Burkepile DE, Fuchs C, Shantz AA, McMinds R, Zaneveld JR (2014) Chronic nutrient enrichment increases prevalence and severity of coral disease and bleaching. Glob Change Biol 20(2):544–554
Verdonschot P, Spears B, Feld C, Brucet S, Keizer-Vlek H, Borja A, Elliott M, Kernan M, Johnson R (2013) A comparative review of recovery processes in rivers, lakes, estuarine and coastal waters. Hydrobiologia 704(1):453–474
Wang M, Hu C, Barnes BB, Mitchum G, Lapointe B, Montoya JP (2019) The great Atlantic Sargassum belt. Science 365(6448):83–87
Wang R, Balkanski Y, Boucher O, Ciais P, Peñuelas J, Tao S (2015) Significant contribution of combustion-related emissions to the atmospheric phosphorus budget. Nat Geosci 8(1):48
Waterhouse J, Brodie J, Lewis S, Mitchell A (2012) Quantifying the sources of pollutants in the Great Barrier Reef catchments and the relative risk to reef ecosystems. Mar Pollut Bull 65(4–9):394–406
Waycott M, Duarte CM, Carruthers TJ, Orth RJ, Dennison WC, Olyarnik S, Calladine A, Fourqurean JW, Heck KL, Hughes AR (2009) Accelerating loss of seagrasses across the globe threatens coastal ecosystems. Proc Natl Acad Sci 106(30):12377–12381
Wiedenmann J, D’Angelo C, Smith EG, Hunt AN, Legiret F-E, Postle AD, Achterberg EP (2013) Nutrient enrichment can increase the susceptibility of reef corals to bleaching. Nat Clim Chang 3(2):160
Wolff NH, Mumby PJ, Devlin M, Anthony KR (2018) Vulnerability of the Great Barrier Reef to climate change and local pressures. Glob Change Biol 24(5):1978–1991
Wooldridge SA (2009) Water quality and coral bleaching thresholds: formalising the linkage for the inshore reefs of the Great Barrier Reef, Australia. Mar Pollut Bull 58(5):745–751
Wooldridge SA (2017) Instability and breakdown of the coral–algae symbiosis upon exceedence of the interglacial pCO2 threshold (>260 ppmv): the “missing” Earth-System feedback mechanism. Coral Reefs 36(4):1025–1037
Wooldridge SA, Brodie JE (2015) Environmental triggers for primary outbreaks of crown-of-thorns starfish on the Great Barrier Reef, Australia. Mar Pollu Bull 101(2):805–815
Wooldridge SA, Brodie JE, Kroon FJ, Turner RD (2015) Ecologically based targets for bioavailable (reactive) nitrogen discharge from the drainage basins of the Wet Tropics region, Great Barrier Reef. Mar Pollu Bull 97(1–2):262–272
Wooldridge SA, Heron SF, Brodie JE, Done TJ, Masiri I, Hinrichs S (2017) Excess seawater nutrients, enlarged algal symbiont densities and bleaching sensitive reef locations: 2. A regional-scale predictive model for the Great Barrier Reef, Australia. Mar Pollu Bull 114(1):343–354
Wright A, Stacey N, Holland P (2006) The cooperative framework for ocean and coastal management in the Pacific Islands: effectiveness, constraints and future direction. Ocean Coast Manag 49(9–10):739–763
Wu J, Sunda W, Boyle EA, Karl DM (2000) Phosphate depletion in the western North Atlantic Ocean. Science 289(5480):759–762
Yan W, Mayorga E, Li X, Seitzinger SP, Bouwman A (2010) Increasing anthropogenic nitrogen inputs and riverine DIN exports from the Changjiang River basin under changing human pressures. Glob Biogeochem Cycles 24(4):GB0A06
Ye NH, Zhang XW, Mao YZ, Liang CW, Xu D, Zou J, Zhuang ZM, Wang QY (2011) ‘Green tides’ are overwhelming the coastline of our blue planet: taking the world’s largest example. Ecol Res 26(3):477–485
Yuan D, Li Y, Wang B, He L, Hirose N (2017a) Coastal circulation in the southwestern Yellow Sea in the summers of 2008 and 2009. Cont Shelf Res 143:101–117
Yuan Y, Yu Z, Song X, Cao X (2017b) Temporal and spatial characteristics of harmful algal blooms in Qingdao Waters, China. Chin J Oceanol Limnol 35(2):400–414
Zaneveld JR, Burkepile DE, Shantz AA, Pritchard CE, McMinds R, Payet JP, Welsh R, Correa AM, Lemoine NP, Rosales S (2016) Overfishing and nutrient pollution interact with temperature to disrupt coral reefs down to microbial scales. Nat Commun 7:11833
Zhang Q, Murphy RR, Tian R, Forsyth MK, Trentacoste EM, Keisman J, Tango PJ (2018) Chesapeake Bay’s water quality condition has been recovering: insights from a multimetric indicator assessment of thirty years of tidal monitoring data. Sci Total Environ 637:1617–1625
Author information
Authors and Affiliations
Corresponding author
Editor information
Editors and Affiliations
Rights and permissions
Open Access This chapter is licensed under the terms of the Creative Commons Attribution 4.0 International License (http://creativecommons.org/licenses/by/4.0/), which permits use, sharing, adaptation, distribution and reproduction in any medium or format, as long as you give appropriate credit to the original author(s) and the source, provide a link to the Creative Commons license and indicate if changes were made.
The images or other third party material in this chapter are included in the chapter's Creative Commons license, unless indicated otherwise in a credit line to the material. If material is not included in the chapter's Creative Commons license and your intended use is not permitted by statutory regulation or exceeds the permitted use, you will need to obtain permission directly from the copyright holder.
Copyright information
© 2023 The Author(s)
About this chapter

Cite this chapter
Devlin, M., Brodie, J. (2023). Nutrients and Eutrophication. In: Reichelt-Brushett, A. (eds) Marine Pollution – Monitoring, Management and Mitigation . Springer Textbooks in Earth Sciences, Geography and Environment. Springer, Cham. https://doi.org/10.1007/978-3-031-10127-4_4
Download citation
DOI: https://doi.org/10.1007/978-3-031-10127-4_4
Published:
Publisher Name: Springer, Cham
Print ISBN: 978-3-031-10126-7
Online ISBN: 978-3-031-10127-4
eBook Packages: Earth and Environmental ScienceEarth and Environmental Science (R0)