
Abstract
Water resource systems are characterized by multiple interdependent components that together produce multiple economic, environmental, ecological, and social impacts. As discussed in the previous chapter, planners and managers working toward improving the design and performance of these complex systems must identify and evaluate alternative designs and operating policies, comparing their predicted performance with desired goals or objectives. Typically, this identification and evaluation process is accomplished with the aid of optimization and simulation models . While optimization methods are designed to provide preferred values of system design and operating policy variables—values that will lead to the highest levels of system performance—they are often used to eliminate the clearly inferior options. Using optimization for a preliminary screening followed by more detailed and accurate simulation is the primary way we have, short of actually building physical models, of estimating effective system designs and operating policies. This chapter introduces and illustrates the art of optimization model development and use in analyzing water resources systems. The models and methods introduced in this chapter are extended in subsequent chapters.
You have full access to this open access chapter, Download chapter PDF
Keywords
- Wellfield
- Final Storage Volume
- Discrete Dynamic Programming
- Lagrange multipliersLagrange Multipliers
- Steady State Policy
These keywords were added by machine and not by the authors. This process is experimental and the keywords may be updated as the learning algorithm improves.
Water resource systems are characterized by multiple interdependent components that together produce multiple economic, environmental, ecological, and social impacts. As discussed in the previous chapter, planners and managers working toward improving the design and performance of these complex systems must identify and evaluate alternative designs and operating policies, comparing their predicted performance with desired goals or objectives. Typically, this identification and evaluation process is accomplished with the aid of optimization and simulation models . While optimization methods are designed to provide preferred values of system design and operating policy variables—values that will lead to the highest levels of system performance—they are often used to eliminate the clearly inferior options. Using optimization for a preliminary screening followed by more detailed and accurate simulation is the primary way we have, short of actually building physical models, of estimating effective system designs and operating policies. This chapter introduces and illustrates the art of optimization model development and use in analyzing water resources systems. The models and methods introduced in this chapter are extended in subsequent chapters.
4.1 Introduction
This chapter introduces some optimization modeling approaches for identifying ways of satisfying specified goals or objectives. The modeling approaches are illustrated by their application to some relatively simple water resources planning and management problems. The purpose here is to introduce and compare some commonly used optimization methods and approaches. This is not a text on the state of the art of optimization modeling. More realistic and more complex problems usually require much bigger and more complex models than those developed and discussed in this chapter, but these bigger and more complex models are often based on the principles and techniques introduced here.
The emphasis here is on the art of model development—just how one goes about constructing and solving optimization models that will provide information useful for addressing and perhaps even solving particular problems. It is unlikely anyone will ever use any of the specific models developed in this or other chapters simply because the specific examples used to illustrate the approach to model development and solution will not be the ones they face. However, it is quite likely water resource managers and planners will use these modeling approaches and solution methods to analyze a variety of water resource systems. The particular systems modeled and analyzed here, or any others that could have been used, can be the core of more complex models needed to analyze more complex problems in practice.
Water resources planning and management today is dominated by the use of optimization and simulation models . Computer software is becoming increasingly available for solving various types of optimization and simulation models. However, no software currently exists that will build models of particular water resource systems. What and what not to include and assume in models requires judgment, experience, and knowledge of the particular problems being addressed, the system being modeled and the decision-making environment—including what aspects can be changed and what cannot. Understanding the contents of this and following chapters and performing the suggested exercises at the end of each chapter can only be a first step toward gaining some judgment and experience in model development .
Before proceeding to a more detailed discussion of optimization , a review of some methods of dealing with time streams of economic incomes or costs (engineering economics) may be useful. Those familiar with this subject that is typically covered in applied engineering economics courses can skip this next section.
4.2 Comparing Time Streams of Economic Benefits and Costs
All of us make decisions that involve future benefits and costs. The extent to which we value future benefits or costs compared to present benefits or costs is reflected by what is called a discount rate . While economic criteria are only one aspect of everything we consider when making decisions, they are often among the important ones. Economic evaluation methods involving discount rates can be used to consider and compare alternatives characterized by various benefits and costs that are expected to occur now and in the future. This section offers a quick and basic review of the use of discount rates that enable comparisons of alternative time series of benefits and costs. Many economic optimization models incorporate discount rates in their economic objective functions.
Engineering economic methods typically focus on the comparison of a discrete set of mutually exclusive alternatives (only one of which can be selected) each characterized by a time series of benefits and costs. Using various methods involving the discount rate, the time series of benefits and costs are converted to a single net benefit that can be compared with other such net benefits in order to identify the one that is best. The values of the decision variables (e.g., the design and operating policy variable values) are known for each discrete alternative being considered. For example, consider again the tank design problem presented in the previous chapter. Alternative tank designs could be identified, and then each could be evaluated, on the basis of cost and perhaps other criteria as well. The best would be called the optimal one, at least with respect to the objective criteria used and the discrete alternatives being considered.
The optimization methods introduced in the following sections of this chapter extend those engineering economics methods. Some methods are discrete, some are continuous. Continuous optimization methods, such as the model defined by Eqs. 3.1–3.3 in Sect. 3.2 of the previous chapter can identify the “best” tank design directly without having to identify and compare numerous discrete, mutually exclusive alternatives. Just how such models can be solved will be discussed later in this chapter. For now, consider the comparison of alternative discrete plans p having different benefits and costs over time.
Let the net benefit generated at the end of time period t by plan p be designated simply as B p(t). Each plan is characterized by the time stream of net benefits it generates over its planning period T p.
Clearly, if in any time period t the benefits exceed the costs, then \( B^{\text{p}} (t) > 0 \); and if the costs exceed the benefits, \( B^{\text{p}} (t) < 0 \). This section defines two ways of comparing different benefit, cost or net-benefit time streams produced by different plans perhaps having different planning period durations T p.
4.2.1 Interest Rates
Fundamental to the conversion of a time series of incomes and costs to an equivalent single value, so that it can be compared to other equivalent single values of other time series, is the concept of the time value of money. From time to time, individuals, private corporations, and governments need to borrow money to do what they want to do. The amount paid back to the lender has two components: (1) the amount borrowed and (2) an additional amount called interest . The interest amount is the cost of borrowing money, of having the money when it is loaned compared to when it is paid back. In the private sector the interest rate, the added fraction of the amount owed that equals the interest, is often identified as the marginal rate of return on capital . Those who have money, called capital, can either use it themselves or they can lend it to others, including banks, and receive interest. Assuming people with capital invest their money where it yields the largest amount of interest, consistent with the risk they are willing to take, most investors should be receiving at least the prevailing interest rate as the return on their capital.
Any interest earned by an investor or paid by a debtor depends on the size of the loan, the duration of the loan, and the interest rate . The interest rate includes a number of considerations. One is the time value of money (a willingness to pay something to obtain money now rather than to obtain the same amount later). Another is the risk of losing capital (not getting the full amount of a loan or investment returned at some future time). A third is the risk of reduced purchasing capability (the expected inflation over time). The greater the risks of losing capital or purchasing power, the higher the interest rate compared to the rate reflecting only the time value of money in a secure and inflation-free environment.
4.2.2 Equivalent Present Value
To compare projects or plans involving different time series of benefits and costs, it is often convenient to express these time series as a single equivalent value. One way to do this is to convert each amount in the time series to what it is worth today, its present worth, that is, a single value at the present time. This present worth will depend on the prevailing interest rate in each future time period. Assuming a value V 0 is invested at the beginning of a time period, e.g., a year, in a project or a savings account earning interest at a rate r per period, then at the end of the period the value of that investment is (1 + r)V 0.
If one invests an amount V 0 at the beginning of period t = 1 and at the end of that period immediately reinvests the total amount (the original investment plus interest earned), and continues to do this for n consecutive periods at the same period interest rate r, the value, V n , of that investment at the end of n periods would be
This results from \( V_{1} = V_{0} /\left( {1 + r} \right) \) at the end of period 1, \( V_{2} = V_{1} / ( {1 + r} ) = V_{0} ( {1 + r} )^{2} \) at the end of period 2, and so on until at the end of period n.
The initial amount V 0 is said to be equivalent to V n at the end of n periods. Thus the present worth or present value , V 0, of an amount of money V n at the end of period n is
Equation 4.3 is the basic compound interest discounting relation needed to determine the present value at the beginning of period 1 (or end of period 0) of net benefits V n that accrue at the end of n time periods .
The total present value of the net benefits generated by plan p, denoted \( V_{0}^{\text{p}} \), is the sum of the values of the net benefits V p(t) accrued at the end of each time period t times the discount factor for that period t. Assuming the interest or discount rate r in the discount factor applies for the duration of the planning period, i.e., from t = 1 to t = T p.
The present value of the net benefits achieved by two or more plans having the same economic planning horizons T p can be used as an economic basis for plan selection. If the economic lives or planning horizons of projects differ, then the present value of the plans may not be an appropriate measure for comparison and plan selection. A valid comparison of alternative plans using present values is possible if all plans have the same planning horizon or if funds remaining at the end of the shorter planning horizon are invested for the remaining time up until the longer planning horizon at the same interest rate r.
4.2.3 Equivalent Annual Value
If the lives of various plans differ, but the same plans will be repeated on into the future, then one need to only compare the equivalent constant annual net benefits of each plan. Finding the average or equivalent annual amount V p is done in two steps. First, one can compute the present value, \( V_{0}^{\text{p}} \), of the time stream of net benefits, using Eq. 4.4. The equivalent constant annual benefits, V p, all discounted to the present must equal the present value, \( V_{0}^{\text{p}} \).
Using a little algebra the average annual end-of-year benefits V p of the project or plan p is
The capital recovery factor CRF n is the expression \( \left[ {r( 1 { } + r)^{{T_{\text{p}} }} } \right]/\left[ {( 1 { } + r)^{{T_{\text{p}} }} - 1} \right] \) in Eq. 4.6 that converts a fixed payment or present value \( V_{0}^{\text{p}} \) at the beginning of the first time period into an equivalent fixed periodic payment V p at the end of each time period. If the interest rate per period is r and there are n periods involved, then the capital recovery factor is
This factor is often used to compute the equivalent annual end-of-year cost of engineering structures that have a fixed initial construction cost C 0 and annual end-of-year operation, maintenance, and repair (OMR) costs. The equivalent uniform end-of-year total annual cost , TAC, equals the initial cost times the capital recovery factor plus the equivalent annual end-of-year uniform OMR costs .
For private investments requiring borrowed capital, interest rates are usually established, and hence fixed, at the time of borrowing. However, benefits may be affected by changing interest rates, which are not easily predicted. It is common practice in benefit–cost analyses to assume constant interest rates over time, for lack of any better assumption.
Interest rates available to private investors or borrowers may not be the same rates that are used for analyzing public investment decisions. In an economic evaluation of public -sector investments, the same relationships are used even though government agencies are not generally free to loan or borrow funds on private money markets. In the case of public-sector investments, the interest rate to be used in an economic analysis is a matter of public policy; it is the rate at which the government is willing to forego current benefits to its citizens in order to provide benefits to those living in future time periods . It can be viewed as the government’s estimate of the time value of public monies or the marginal rate of return to be achieved by public investments.
These definitions and concepts of engineering economics are applicable to many of the problems faced in water resources planning and management. Each of the equations above is applicable to discrete alternatives whose decision variables (investments over time) are known. The equations are used to identify the best alternative from a set of mutually exclusive alternatives whose decision variable values are known. More detailed discussions of the application of engineering economics are contained in numerous texts on the subject. In the next section, we introduce methods that can identify the best alternative among those whose decision variable values are not known. For example, engineering economic methods can identify, for example, the most cost-effective tank from among those whose dimension values have been previously selected. The optimization methods that follow can identify directly the values of the dimensions of most cost-effective tank.
4.3 Nonlinear Optimization Models and Solution Procedures
Constrained optimization involves finding the values of decision variables given specified relationships that have to be satisfied. Constrained optimization is also called mathematical programming. Mathematical programming techniques include calculus-based Lagrange multipliers and various methods for solving linear and nonlinear models including dynamic programming, quadratic programming, fractional programming, and geometric programming, to mention a few. The applicability of each of these as well as other constrained optimization procedures is highly dependent on the mathematical structure of the model that in turn is dependent on the system being analyzed. Individuals tend to construct models in a way that will allow them to use a particular optimization technique they think is best. Thus, it pays to be familiar with various types of optimization methods since no one method is best for all optimization problems. Each has its strengths and limitations. The remainder of this chapter introduces and illustrates the application of some of the most common constrained optimization techniques used in water resources planning and management.
Consider a river from which diversions are made to three water-consuming firms that belong to the same corporation, as illustrated in Fig. 4.1. Each firm makes a product. Water is needed in the process of making that product, and is the critical resource. The three firms can be denoted by the index j = 1, 2, and 3 and their water allocations by x j . Assume the problem is to determine the allocations x j of water to each of three firms (j = 1, 2, 3) that maximize the total net benefits, \( \sum\nolimits_{j} {{\text{NB}}_{j}(x_{j} )} \), obtained from all three firms. The total amount of water available is constrained or limited to a quantity of Q.

Three water-using firms obtain water from a river. The amounts x j allocated to each firm j will depend on the river flow Q
Assume the net benefits, NB j (x j ), derived from water x j allocated to each firm j, are defined by
These are concave functions exhibiting decreasing marginal net benefits with increasing allocations . These functions look like hills, as illustrated in Fig. 4.2.

Concave net benefit functions for three water users, j, and their slopes at allocations x j
4.3.1 Solution Using Calculus
Calculus can be used to find the allocations that maximize each user’s net benefits, simply by finding where the slope or derivative of the net benefit function for each firm equals zero. The derivative, dNB(x 1)/dx 1, of the net benefit function for Firm 1 is (6 − 2x 1) and hence the allocation to Firm 1 that maximizes its net benefits would be 6/2 or 3. The corresponding allocations for Firms 2 and 3 are 2.33 and 8, respectively. The total amount of water desired by all firms is the sum of each firm’s desired allocation, or 13.33 flow units. However, suppose only 8 units of flow are available for all three firms and 2 units must remain in the river. Introducing this constraint renders the previous solution infeasible. In this case we want to find the allocations that maximize the total net benefits obtained from all firms subject to having only 6 flow units available for allocations. Using simple calculus will not suffice.
4.3.2 Solution Using Hill Climbing
One approach for finding, at least approximately, the particular allocations that maximize the total net benefit derived from all firms in this example is an incremental steepest-hill-climbing method. This method divides the total available flow Q into increments and allocates each successive increment so as to get the maximum additional net benefit from that incremental amount of water. This procedure works in this example because each of the net benefit functions is concave; in other words, the marginal benefits decrease as the allocation increases. This procedure is illustrated by the flow diagram in Fig. 4.3.

Steepest hill-climbing approach for finding allocation of a flow Q max to the three firms, while meeting minimum river flow requirements R
Table 4.1 lists the results of applying the procedure shown in Fig. 4.3 to the problem when (a) only 8 and (b) only 20 flow units are available. Here a minimum river flow of 2 is required and is to be satisfied, when possible, before any allocations are made to the firms.
The hill-climbing method illustrated in Fig. 4.3 and Table 4.1 assigns each incremental flow ΔQ to the use that yields the largest additional (marginal ) net benefit. An allocation is optimal for any total flow Q when the marginal net benefits from each nonzero allocation are equal, or as close to each other as possible given the size of the increment ΔQ. In this example, with a ΔQ of 1 and Q max of 8, it just happens that the marginal net benefits associated with each allocation are all equal (to 4). The smaller the ΔQ, the more precise will be the optimal allocations in each iteration, as shown in the lower portion of Table 4.1, where ΔQ approaches 0.
Based on the allocations derived for various values of available water Q, as shown in Table 4.1, an allocation policy can be defined. For this problem, the allocation policy that maximizes total net benefits for any particular value of Q is shown in Fig. 4.4.

Water-allocation policy that maximizes total net benefits derived from all three water-using firms
This hill-climbing approach leads to optimal allocations only if all of the net benefit functions whose sum is being maximized are concave: that is, the marginal net benefits decrease as the allocation increases. Otherwise, only a local optimum solution can be guaranteed. This is true using any calculus-based optimization procedure or algorithm.
4.3.3 Solution Using Lagrange Multipliers
4.3.3.1 Approach
As an alternative to hill-climbing methods , consider a calculus-based method involving Lagrange multipliers . To illustrate this approach, a slightly more complex water-allocation example will be used. Assume that the benefit, B j (x j ), each water-using firm receives is determined, in part, by the quantity of product it produces and the price per unit of the product that is charged. As before, these products require water and water is the limiting resource. The amount of product produced, p j , by each firm j is dependent on the amount of water, x j , allocated to it.
Let the function P j (x j ) represent the maximum amount of product, p j , that can be produced by firm j from an allocation of water x j . These are called production functions. They are typically concave: as x j increases the slope, dP j (x j )/dx j , of the production function, P j (x j ), decreases. For this example, assume the production functions for the three water-using firms are
Next consider the cost of production. Assume the associated cost of production can be expressed by the following convex functions :
Each firm produces a unique patented product, and hence it can set and control the unit price of its product. The lower the unit price, the greater the demand and thus the more each firm can sell. Each firm has determined the relationship between the unit price and the amount that will be demanded and sold. These are the demand functions for that product. These unit price or demand functions are shown in Fig. 4.5, where the p j s are the amounts of each product produced. The vertical axis of each graph is the unit price. To simplify the problem we are assuming linear demand functions, but this assumption is not a necessary condition.

Unit prices that will guarantee the sale of the specified amounts of products p j produced in each of the three firms (linear functions are assumed in this example for simplicity)
The optimization problem is to find the water allocations, the production levels, and the unit prices that together maximize the total net benefit obtained from all three firms. The water allocations plus the amount that must remain in the river, R, cannot exceed the total amount of water Q available.
Constructing and solving a model of this problem for various values of Q, the total amount of water available, will define the three allocation policies as functions of Q. These policies can be displayed as a graph, as in Fig. 4.4, showing the three best allocations given any value of Q. This of course assumes the firms can adjust to varying allocations. In reality this may not be the case (Chapter 9 examines this problem using more realistic benefit functions that reflect the degree to which firms can adapt to changing inputs over time.)
The model:
Subject to
Definitional constraints :
Production functions defining the relationship between water allocations x j and production p j
Water-allocation restriction
One can first solve this model for the values of each p j that maximize the total net benefits , assuming water is not a limiting constraint. This is equivalent to finding each individual firm’s maximum net benefits, assuming all the water that is needed is available. Using calculus we can equate the derivatives of the total net benefit function with respect to each p j to 0 and solve each of the resulting three independent equations:
Derivatives:
The result (rounded off) is p 1 = 3.2, p 2 = 4.0, and p 3 = 3.9 to be sold for unit prices of 8.77, 13.96, and 18.23, respectively, for a maximum net revenue of 155.75. This would require water allocations x 1 = 10.2, x 2 = 13.6, and x 3 = 14.5, totaling 38.3 flow units. Any amount of water less than 38.3 will restrict the allocation to, and hence the product production at, one or more of the three firms.
If the total available amount of water is less than that desired, constraint Eq. 4.25 can be written as an equality, since all the water available, less any that must remain in the river, R, will be allocated. If the available water supplies are less than the desired 38.3 plus the required streamflow R, then Eqs. 4.22–4.25 need to be added. These can be rewritten as equalities since they will be binding. Equation 4.25 in this case can always be an equality since any excess water will be allocated to the river, R.
To consider values of Q that are less than the desired 38.3 units, constraints 4.22–4.25 can be included in the objective function, Eq. 4.26, once the right-hand side has been subtracted from the left-hand side so that they equal 0. We set this function equal to L.
Since each of the four constraint Eqs. 4.22–4.25 included in Eq. 4.30 equals zero, each can be multiplied by a variable λ i without changing the value of Eq. 4.30, or equivalently, Eq. 4.26. These unknown variables λ i are called the Lagrange multipliers of constraints i. The value of each multiplier , λ i , is the marginal value of the original objective function, Eq. 4.26, with respect to a change in the value of the amount produced, p, or in the case of constraint Eq. 4.25, the amount of water available, Q. We will show this shortly.
Differentiating Eq. 4.30 with respect to each of the ten unknowns and setting the resulting equations to 0 yields :
These ten equations are the conditions necessary for a solution that maximizes Eq. 4.30, or equivalently 4.26. They can be solved to obtain the values of the ten unknown variables. The solutions to these equations for various values of Q, (found in this case using LINGO) are shown in Table 4.2. (A free demo version of LINGO can be obtained (downloaded) from www.LINDO.com.)
4.3.3.2 Meaning of Lagrange Multiplier λ
In this example, Eq. 4.30 is the objective function that is to be maximized. It is maximized or minimized by equating to zero each of its partial derivatives with respect to each unknown variable. Equation 4.30 consists of the original net benefit function plus each constraint i multiplied by a weight or multiplier λ i . This equation is expressed in monetary units. The added constraints are expressed in other units: either the quantity of product produced or the amount of water available. Thus the units of the weights or multipliers λ i associated with these constraints are expressed in monetary units per constraint units. In this example, the multipliers λ 1, λ 2, and λ 3 represent the change in the total net benefit value of the objective function (Eq. 4.26) per unit change in the products p 1, p 2, and p 3 produced. The multiplier λ 4 represents the change in the total net benefit per unit change in the water available for allocation, Q − R.
Note in Table 4.2 that as the quantity of available water increases, the marginal net benefits decrease. This is reflected in the values of each of the multipliers, λ i . In other words, the net revenue derived from a quantity of product produced at each of the three firms, and from the quantity of water available, is a concave function of those quantities, as illustrated in Fig. 4.2.
To review the general Lagrange multiplier approach and derive the definition of the multipliers, consider the general constrained optimization problem containing n decision variables x j and m constraint equations i.
subject to constraints
where X is the vector of all x j . The Lagrange function L(X, λ) is formed by combining Eq. 4.42, each equaling zero, with the objective function of Eq. 4.41.
Solutions of the equations ∂L/∂x j = 0 for all decision variables x j and ∂L/∂λ i = 0 for all constraints g i are possible local optima .
There is no guarantee that a global optimum solution will be found using calculus-based methods such as this one. Boundary conditions need to be checked. Furthermore, since there is no difference in the Lagrange multipliers procedure for finding a minimum or a maximum solution, one needs to check whether in fact a maximum or minimum is being obtained. In this example, since each net benefit function is concave, a maximum will result.
The meaning of the values of the multipliers λ i at the optimum solution can be derived by manipulation of ∂L/∂λ i = 0. Taking the partial derivative of the Lagrange function, Eq. 4.43, with respect to an unknown variable x j and setting it to zero results in
Multiplying each term by ∂x j yields
Dividing each term by ∂b k associated with a particular constraint, say k, defines the meaning of λ k .
Equation 4.46 follows from the fact that \( \partial (g_{i} ({\mathbf{X}}))/\partial b_{k} \) equals 0 for constraints i ≠ k and equals 1 for the constraint i = k. The latter is true since b i = g i (X) and thus ∂(g i (X)) = ∂b i .
From Eq. 4.46, each multiplier λ i is the marginal change in the original objective function F(X) with respect to a change in the constant b i associated with the constraint i. For nonlinear problems, it is the slope of the objective function plotted against the value of b i .
Readers can work out a similar proof if a slack or surplus variable, S i , is included in inequality constraints to make them equations. For a less-than-or-equal constraint g i (X) ≤ b i a squared slack variable \( S_{i}^{2} \) can be added to the left-hand side to make it an equation \( g_{i} (X) + S_{i}^{2} = b_{i} \). For a greater-than-or-equal constraint g i (X) ≥ b i a squared surplus variable \( S_{i}^{2} \) can be subtracted from the left-hand side to make it an equation \( g_{i} (X) - S_{i}^{2} = b_{i} \). These slack or surplus variables are squared to ensure they are nonnegative, and also to make them appear in the differential equations .
Equation 4.47 shows that either the slack or surplus variable, S, or the multiplier, λ, will always be zero. If the value of the slack or surplus variable S is nonzero, the constraint is redundant. The optimal solution will not be affected by the constraint. Small changes in the values, b, of redundant constraints will not change the optimal value of the objective function F(X). Conversely, if the constraint is binding, the value of the slack or surplus variable S will be zero. The multiplier λ can be nonzero if the value of the function F(X) is sensitive to the constraint value b.
The solution of the set of partial differential Equations Eqs. 4.47 often involves a trial-and-error process, equating to zero a λ or a S for each inequality constraint and solving the remaining equations, if possible. This tedious procedure, along with the need to check boundary solutions when nonnegativity conditions are imposed, detracts from the utility of classical Lagrange multiplier methods for solving all but relatively simple water resources planning problems.
4.4 Dynamic Programming
The water-allocation problems in the previous section assumed a net-benefit function for each water-using firm. In those examples, these functions were continuous and differentiable, a convenient attribute if methods based on calculus (such as hill-climbing or Lagrange multipliers ) are to be used to find the best solution. In many practical situations, these functions may not be so continuous, or so conveniently concave for maximization or convex for minimization, making calculus-based methods for their solution difficult.
A possible solution method for constrained optimization problems containing continuous and/or discontinuous functions of any shape is called discrete dynamic programming. Each decision variable value can assume one of a set of discrete values. For continuous valued objective functions, the solution derived from discrete dynamic programming may therefore be only an approximation of the best one. For all practical purposes this is not a significant limitation, especially if the intervals between the discrete values of the decision variables are not too large and if simulation modeling is used to refine the solutions identified using dynamic programming.
Dynamic programming is an approach that divides the original optimization problem, with all of its variables, into a set of smaller optimization problems, each of which needs to be solved before the overall optimum solution to the original problem can be identified. The water supply allocation problem, for example, needs to be solved for a range of water supplies available to each firm. Once this is done the particular allocations that maximize the total net benefit can be determined.
4.4.1 Dynamic Programming Networks and Recursive Equations
A network of nodes and links can represent each discrete dynamic programming problem. Dynamic programming methods find the best way to get to, or go from, any node in that network. The nodes represent possible discrete states of the system that can exist and the links represent the decisions one could make to get from one state (node) to another. Figure 4.6 illustrates a portion of such a network for the three-firm allocation problem shown in Fig. 4.1. In this case the total amount of water available, Q − R, to all three firms is 10.

A network representing some of the possible integer allocations of water to three water-consuming firms j assuming 10 units of water are available. The circles or nodes represent the discrete quantities of water available to users not yet allocated any water, and the links represent feasible allocation decisions x j to the next firm j
Thus, dynamic programming models involve states, stages, and decisions. The relationships among states, stages, and decisions are represented by networks , such as that shown in Fig. 4.6. The states of the system are the nodes and the values of the states are the numbers in the nodes. Each node value in this example is the quantity of water available to allocate to all remaining firms, that is, to all connected links to the right of the node. These state variable values typically represent some existing condition either before making, or after having made, a decision. The stages of the system are the different components (e.g., firms) or time periods . Links between (or connecting) initial and final states represent decisions. The links in this example represent possible allocation decisions for each of the three different firms. Each stage is a separate firm. Each state is an amount of water that remains to be allocated in the remaining stages.
Each link connects two nodes, the left node value indicating the state of a system before a decision is made, and the right node value indicating the state of a system after a decision is made. In this case, the state of the system is the amount of water available to allocate to the remaining firms.
In the example shown in Fig. 4.6, the state and decision variables are represented by integer values—an admittedly fairly coarse discretization. The total amount of water available, in addition to the amount that must remain in the river, is 10. Note from the first row of Table 4.2 the exact allocation solution is x 1 = 1.2, x 2 = 3.7, and x 3 = 5.1. Normally, we would not know this solution before solving for it using dynamic programming, but since we do we can reduce the complexity (number of nodes and links) of the dynamic programming network so that the repetitive process of finding the best solution is clearer. Thus assume the range of x 1 is limited to integer values from 0 to 2, the range of x 2 is from 3 to 5, and the range of x 3 is from 4 to 6. These range limits are imposed here just to reduce the size of the network . In this case, these assumptions will not affect or constrain the optimal integer solution. If we did not make these assumptions the network would have, after the first column of one node, three columns of 11 nodes, one representing each integer value from 0 to 10. Finer (noninteger) discretizations would involve even more nodes and connecting links.
The links of Fig. 4.6 represent the water allocations . Note that the link allocations, the numbers on the links, cannot exceed the amount of water available, that is, the number in the left node of the link. The number in the right node is the quantity of water remaining after an allocation has been made. The value in the right node, state S j+1, at the beginning of stage j + 1, is equal to the value in the left node, S j , less the amount of water, x j , allocated to firm j as indicated on the link. Hence, beginning with a quantity of water S 1 that can be allocated to all three firms, after allocating x 1 to Firm 1 what remains is S 2:
Allocating x 2 to Firm 2, leaves S 3.
Finally, allocating x 3 to Firm 3 leaves S 4.
Figure 4.6 shows the different values of each of these states, S j , and decision variables x j beginning with a quantity S 1 = Q − R = 10. Our task is to find the best path through the network, beginning at the leftmost node having a state value of 10. To do this we need to know the net benefits we will get associated with all the links (representing the allocation decisions we could make) at each node (state) for each firm (stage).
Figure 4.7 shows the same network as in Fig. 4.6; however the numbers on the links represent the net benefits obtained from the associated water allocations. For the three firms j = 1, 2, and 3, the net benefits, NB j (x j ), associated with allocations x j are

Network as in Fig. 4.6 representing integer value allocations of water to three water-consuming firms. The circles or nodes represent the discrete quantities of water available, and the links represent feasible allocation decisions. The numbers on the links indicate the net benefits obtained from these particular integer allocation decisions
The discrete dynamic programming algorithm or procedure is a systematic way to find the best path through this network, or any other suitable network. What makes a network suitable for dynamic programming is the fact that all the nodes can be lined up in a sequence of vertical columns and each link connects a node in one column to another node in the next column of nodes. No link passes over or through any other column(s) of nodes. Links also do not connect nodes in the same column. In addition, the contribution to the overall objective value (in this case, the total net benefits) associated with each discrete decision (link) in any stage or for any firm is strictly a function of the allocation of water to the firm. It is not dependent on the allocation decisions associated with other stages (firms) in the network .
The main challenge in using discrete dynamic programming to solve an optimization problem is to structure the problem so that it fits this dynamic programming network format. Perhaps surprisingly, many water resources planning and management problems do. But it takes practice to become good at converting optimization problems to networks of states, stages, and decisions suitable for solution by discrete dynamic programming algorithms.
In this problem the overall objective is to
where NB j (x j ) is the net benefit associated with an allocation of x j to firm j. Equations 4.51–4.53 define these net benefit functions. As before, the index j represents the particular firm, and each firm is a stage for this problem. Note that the index or subscript used in the objective function often represents an object (like a water-using firm) at a place in space or a time period. These places or time periods are called the stages of a dynamic programming problem. Our task is to find the best path from one stage to the next: in other words, the best allocation decisions for all three firms.
Dynamic programming can be viewed as a multistage decision-making process. Instead of deciding all three allocations in one single optimization procedure, like Lagrange multipliers , the dynamic programming procedure divides the problem up into many optimization problems, one for each possible discrete state (e.g., for each node representing an amount of water available) in each stage (e.g., for each firm). Given a particular state S j and stage j—that is, a particular node in the network—what decision (link) x j will result in the maximum total net benefits , designated as F j (S j ), given this state S j for this and all remaining stages or firms j, j + 1, j + 2 … ? This question must be answered for each node in the network before one can find the overall best set of decisions for each stage: in other words, the best allocations to each firm (represented by the best path through the network ) in this example.
Dynamic programming networks can be solved in two ways—beginning at the most right column of nodes or states and moving from right to left, called the backward-moving (but forward-looking) algorithm, or beginning at the leftmost node and moving from left to right, called the forward-moving (but backward-looking) algorithm. Both methods will find the best path through the network. In some problems, however, only the backward-moving algorithm produces a useful solution. We will revisit this issue when we get to reservoir operation where the stages are time periods.
4.4.2 Backward-Moving Solution Procedure
Consider the network in Fig. 4.7. Again, the nodes represent the discrete states—water available to allocate to all remaining users. The links represent particular discrete allocation decisions. The numbers on the links are the net benefits obtained from those allocations. We want to proceed through the node-link network from the state of 10 at the beginning of the first stage to the end of the network in such a way as to maximize total net benefits. But without looking at all combinations of successive allocations we cannot do this beginning at a state of 10. However, we can find the best solution if we assume we have already made the first two allocations and are at any of the nodes or states at the beginning of the final, third, stage with only one allocation decision remaining. Clearly at each node representing the water available to allocate to the third firm, the best decision is to pick the allocation (link) having the largest net benefits.
Denoting F 3(S 3) as the maximum net benefits we can achieve from the remaining amount of water S3, then for each discrete value of S 3 we can find the x 3 that maximizes F 3(S 3). Those shown in Fig. 4.7 include:
These computations are shown on the network in Fig. 4.8. Note that there are no benefits to be obtained after the third allocation, so the decision to be made for each node or state prior to allocating water to Firm 3 is simply that which maximizes the net benefits derived from that last (third) allocation. In Fig. 4.8 the links representing the decisions or allocations that result in the largest net benefits are shown with arrows.

Using the backward-moving dynamic programming method for finding the maximum remaining net benefits , F j (S j ), and optimal allocations (denoted by the arrows on the links) for each state in Stage 3, then for each state in Stage 2 and finally for the initial state in Stage 1 to obtain the allocation policy that maximizes total net benefits, F 1(10). The minimum flow to remain in the river, R, is in addition to the ten units available for allocation and is not shown in this network
Having computed the maximum net benefits, F 3(S 3), associated with each initial state S 3 for Stage 3, we can now move backward (to the left) to the discrete states S 2 at the beginning of the second stage. Again, these states represent the quantity of water available to allocate to Firms 2 and 3. Denote F 2(S 2) as the maximum total net benefits obtained from the two remaining allocations x 2 and x 3 given the quantity S 2 water available. The best x 2 depends not only on the net benefits obtained from the allocation x 2 but also on the maximum net benefits obtainable after that, namely the just-calculated F 3(S 3) associated with the state S 3 that results from the initial state S 2 and a decision x 2. As defined in Eq. 4.49, this final state S 3 in Stage 2 obviously equals S 2 − x 2. Hence for those nodes at the beginning of Stage 2 shown in Fig. 4.8:
These maximum net benefit functions, F 2(S 2), could be calculated for the remaining discrete states from 7 to 0.
Having computed the maximum net benefits obtainable for each discrete state at the beginning of Stage 2, that is, all the F 2(S 2) values, we can move backward or left to the beginning of Stage 1. For this beginning stage there is only one state, the state of 10 we are actually in before making any allocations to any of the firms. In this case, the maximum net benefits, F 1(10), we can obtain from given 10 units of water available, is
The value of F 1(10) in Eq. 4.62 is the same as the value of Eq. 4.54. This value is the maximum net benefits obtainable from allocating the available 10 units of water. From Eq. 4.62 we know that we will get a maximum of 53.4 net benefits if we allocate 1 unit of water to Firm 1. This leaves 9 units of water to allocate to the two remaining firms. This is our optimal state at the beginning of Stage 2. Given a state of 9 at the beginning of Stage 2, we see from Eq. 4.60 that we should allocate 4 units of water to Firm 2. This leaves 5 units of water for Firm 3. Given a state of 5 at the beginning of Stage 3, Eq. 4.57 tells us we should allocate all 5 units to Firm 3. All this is illustrated in Fig. 4.8.
Compare this discrete solution with the continuous one defined by Lagrange multipliers as shown in Table 4.2. The exact solution, to the nearest tenth, is 1.2, 3.7, and 5.1 for x 1, x 2, and x 3, respectively. The solution just derived from discrete dynamic programming that assumed only integer allocation values is 1, 4, and 5, respectively.
To summarize, a dynamic programming model was developed for the following problem:
Subject to
The discrete dynamic programming version of this problem required discrete states S j representing the amount of water available to allocate to firms j, j + 1, …. It required discrete allocations x j . Next it required the calculation of the maximum net benefits , F j (S j ), that could be obtained from all firms j, beginning with Firm 3, and proceeding backward as indicated in Eqs. 4.71–4.73.
The values of each NB j (x j ) are obtained from Eqs. 4.51 to 4.53.
To solve for F 1(S 1) and each optimal allocation x j we must first solve for all values of F 3(S 3). Once these are known we can solve for all values of F 2(S 2). Given these F 2(S 2) values, we can solve for F 1(S 1). Equations 4.71 need to be solved before Eqs. 4.72 can be solved, and Eqs. 4.72 need to be solved before Eqs. 4.73 can be solved. They need not be solved simultaneously, and they cannot be solved in reverse order. These three equations are called recursive equations. They are defined for the backward-moving dynamic programming solution procedure.
There is a correspondence between the nonlinear optimization model defined by Eqs. 4.63–4.70 and the dynamic programming model defined by the recursive Eqs. 4.71–4.73. Note that F 3(S 3) in Eq. 4.71 is the same as
Subject to
where NB3(x 3) is defined in Eq. 4.53.
Similarly, F 2(S 2) in Eq. 4.72 is the same as
Subject to
where NB2(x 2) and NB3(x 3) are defined in Eqs. 4.52 and 4.53.
Finally, F 1(S 1) in Eq. 4.73 is the same as
Subject to
where NB1(x 1), NB2(x 2), and NB3(x 3) are defined in Eqs. 4.51–4.53.
Alternatively, F 3(S 3) in Eq. 4.71 is the same as
Subject to
Similarly, F 2(S 2) in Eq. 4.72 is the same as
Subject to
Finally, F 1(S 1) in Eq. 4.73 is the same as
Subject to
The transition function of dynamic programming defines the relationship between two successive states S j and S j+1 and the decision x j . In the above example, these transition functions are defined by Eqs. 4.48–4.50, or, in general terms for all firms j, by
4.4.3 Forward-Moving Solution Procedure
We have just described the backward-moving dynamic programming algorithm. In that approach at each node (state) in each stage we calculated the best value of the objective function that can be obtained from all further or remaining decisions. Alternatively one can proceed forward, that is, from left to right, through a dynamic programming network . For the forward-moving algorithm at each node we need to calculate the best value of the objective function that could be obtained from all past decisions leading to that node or state. In other words, we need to find how best to get to each state S j+1 at the end of each stage j.
Returning to the allocation example, define f j (S j+1) as the maximum net benefits from the allocation of water to firms 1, 2, …, j, given the remaining water, state S j+1. For this example, we begin the forward-moving, but backward-looking, process by selecting each of the ending states in the first stage j = 1 and finding the best way to have arrived at (or to have achieved) those ending states. Since in this example there is only one way to get to each of those states, as shown in Fig. 4.7 or Fig. 4.8 the allocation decisions, x 1, given a value for S 2 are obvious.
Hence, f 1(S 2) is simply NB1(10 − S 2). Once the values for all f 1(S 2) are known for all discrete S 2 between 0 and 10, move forward (to the right) to the end of Stage 2 and find the best allocations x 2 to have made given each final state S 3.
Once the values of all f 2(S 3) are known for all discrete states S 3 between 0 and 10, move forward to Stage 3 and find the best allocations x 3 to have made given each final state S 4.
Figure 4.9 illustrates a portion of the network represented by Eqs. 4.93–4.95, and the f j (S j+1) values.

Using the forward-moving dynamic programming method for finding the maximum accumulated net benefits, f j (S j + 1), and optimal allocations (denoted by the arrows on the links) that should have been made to reach each ending state, beginning with the ending states in Stage 1, then for each ending state in Stage 2 and finally for the ending states in Stage 3
From Fig. 4.9, note the highest total net benefits are obtained by ending with 0 remaining water at the end of Stage 3. The arrow tells us that if we are to get to that state optimally, we should allocate 5 units of water to Firm 3. Thus we must begin Stage 3, or end Stage 2, with 10 − 5 = 5 units of water. To get to this state at the end of Stage 2 we should allocate 4 units of water to Firm 2. The arrow also tells us we should have had 9 units of water available at the end of Stage 1. Given this state of 9 at the end of Stage 1, the arrow tells us we should allocate 1 unit of water to Firm 1. This is the same allocation policy as obtained using the backward-moving algorithm.
4.4.4 Numerical Solutions
The application of discrete dynamic programming to most practical problems will usually require writing some software. There are no general dynamic programming computer programs available that will solve all dynamic programming problems. Thus any user of dynamic programming will need to write a computer program to solve a particular problem unless they do it by hand. Most computer programs written for solving specific dynamic programming problems create and store the solutions of the recursive equations (e.g., Eqs. 4.93–4.95) in tables. Each stage is a separate table, as shown in Tables 4.3, 4.4, and 4.5 for this example water-allocation problem. These tables apply to only a part of the entire problem, namely that part of the network shown in Figs. 4.8 and 4.9. The backward solution procedure is used.
Table 4.3 contains the solutions of Eqs. 4.55–4.58 for the third stage. Table 4.4 contains the solutions of Eqs. 4.59–4.61 for the second stage. Table 4.5 contains the solution of Eq. 4.62 for the first stage.
From Table 4.5 we see that, given 10 units of water available, we will obtain 53.4 net benefits and to get this we should allocate 1 unit to Firm 1. This leaves 9 units of water for the remaining two allocations . From Table 4.4 we see that for a state of 9 units of water available we should allocate 4 units to Firm 2. This leaves 5 units. From Table 4.3 for a state of 5 units of water available we see we should allocate all 5 of them to Firm 3.
Performing these calculations for various discrete total amounts of water available, say from 0 to 38 in this example, will define an allocation policy (such as the one shown in Fig. 4.5 for a different allocation problem) for situations when the total amount of water is less than that desired by all the firms. This policy can then be simulated using alternative time series of available amounts of water, such as streamflows, to obtain estimates of the time series (or statistical measures of those time series) of net benefits obtained by each firm, assuming the allocation policy is followed over time.
4.4.5 Dimensionality
One of the limitations of dynamic programming is handling multiple state variables . In our water-allocation example, we had only one state variable: the total amount of water available. We could have enlarged this problem to include other types of resources the firms require to make their products. Each of these state variables would need to be discretized. If, for example, only m discrete values of each state variable are considered, for n different state variables (e.g., types of resources) there are m n different combinations of state variable values to consider at each stage. As the number of state variables increases, the number of discrete combinations of state variable values increases exponentially. This is called dynamic programming’s “curse of dimensionality ”. It has motivated many researchers to search for ways of reducing the number of possible discrete states required to find an optimal solution to large multistate-variable problems.
4.4.6 Principle of Optimality
The solution of dynamic programming models or networks is based on a principal of optimality (Bellman 1957). The backward-moving solution algorithm is based on the principal that no matter what the state and stage (i.e., the particular node you are at), an optimal policy is one that proceeds forward from that node or state and stage optimally. The forward-moving solution algorithm is based on the principal that no matter what the state and stage (i.e., the particular node you are at), an optimal policy is one that has arrived at that node or state and stage in an optimal manner.
This “principle of optimality” is a very simple concept but requires the formulation of a set of recursive equations at each stage. It also requires that either in the last stage (j = J) for a backward-moving algorithm, or in the first stage (j = 1) for a forward-moving algorithm, the future value functions, F j+1(S j+1), associated with the ending state variable values, or past value functions, f 0(S 1), associated with the beginning state variable values, respectively, all equal some known value. Usually that value is 0 but not always. This condition is needed in order to begin the process of solving each successive recursive equation.
4.4.7 Additional Applications
Among the common dynamic programming applications in water resources planning are water allocations to multiple uses, infrastructure capacity expansion , and reservoir operation . The previous three-user water-allocation problem (Fig. 4.1) illustrates the first type of application. The other two applications are presented below.
4.4.7.1 Capacity Expansion
How much infrastructure should be built, when and why? Consider a municipality that must plan for the future expansion of its water supply system or some component of that system, such as a reservoir, aqueduct, or treatment plant. The capacity needed at the end of each future period t has been estimated to be D t . The cost, C t (s t , x t ) of adding capacity x t in each period t is a function of that added capacity as well as of the existing capacity s t at the beginning of the period. The planning problem is to find that time sequence of capacity expansions that minimizes the present value of total future costs while meeting the predicted capacity demand requirements. This is the usual capacity expansion problem.
This problem can be written as an optimization model : The objective is to minimize the present value of the total cost of capacity expansion .
where C t (s t , x t ) is the present value of the cost of capacity expansion x t in period t given an initial capacity of s t .
The constraints of this model define the minimum required final capacity in each period t, or equivalently the next period’s initial capacity, s t+1, as a function of the known existing capacity s 1 and each expansion x t up through period t.
Alternatively these equations may be expressed by a series of continuity relationships:
In this problem, the constraints must also ensure that the actual capacity s t+1 at the end of each future period t is no less than the capacity required D t at the end of that period.
There may also be constraints on the possible expansions in each period defined by a set Ω t of feasible capacity additions in each period t:
Figure 4.10 illustrates this type of capacity expansion problem. The question is how much capacity to add and when. It is a significant problem for several reasons. One is that the cost functions C t (s t , x t ) typically exhibit fixed costs and economies of scale, as illustrated in Fig. 4.11. Each time any capacity is added there are fixed as well as variable costs incurred. Fixed and variable costs that show economies of scale (decreasing average costs associated with increasing capacity additions) motivate the addition of excess capacity, capacity not needed immediately but expected to be needed in the future to meet an increased demand for additional capacity.

A demand projection (solid blue line) and a possible capacity expansion schedule (red line) for meeting that projected demand over time

Typical cost function for additional capacity given an existing capacity. The cost function shows the fixed costs , C 0, required if additional capacity is to be added, and the economies of scale associated with the concave portion of the cost function
The problem is also important because any estimates made today of future demands, costs and interest rates are likely to be wrong. The future is uncertain. Its uncertainties increase the further the future. Capacity expansion planners need to consider the future if their plans are to be cost-effective and not myopic from assuming there is no future. Just how far into the future do they need to look? And what about the uncertainty in all future costs, demands, and interest rate estimates? These questions will be addressed after showing how the problem can be solved for any fixed-planning horizon and estimates of future demands, interest rates, and costs.
The constrained optimization model defined by Eqs. 4.96–4.100 can be restructured as a multistage decision-making process and solved using either a forward or backward-moving discrete dynamic programming solution procedure. The stages of the model will be the time periods t. The states will be either the capacity s t+1 at the end of a stage or period t if a forward-moving solution procedure is adopted, or the capacity s t , at the beginning of a stage or period t if a backward-moving solution procedure is used.
A network of possible discrete capacity states and decisions can be superimposed onto the demand projection of Fig. 4.9, as shown in Fig. 4.12. The solid blue circles in Fig. 4.12 represent possible discrete states, S t , of the system, the amounts of additional capacity existing at the end of each period t − 1 or equivalently at the beginning of period t.

Network of discrete capacity expansion decisions (links) that meet the projected demand
Consider first a forward-moving dynamic programming algorithm. To implement this, define f t (s t+1) as the minimum cost of achieving a capacity s t+1, at the end of period t. Since at the beginning of the first period t = 1, the accumulated least cost is 0, f 0(s 1) = 0.
Hence, for each final discrete state s 2 in stage t = 1 ranging from D 1 to the maximum demand D T , define
Moving to stage t = 2, for the final discrete states s 3 ranging from D 2 to D T,
Moving to stage t = 3, for the final discrete states s 4 ranging from D 3 to D T ,
In general for all stages t between the first and last:
For the last stage t = T and for the final discrete state s T+1 = D T ,
The value of f T (s T+1) is the minimum present value of the total cost of meeting the demand for T time periods . To identify the sequence of capacity expansion decisions that results in this minimum present value of the total cost requires backtracking to collect the set of best decisions x t for all stages t. A numerical example will illustrate this.
A numerical example
Consider the five-period capacity expansion problem shown in Fig. 4.12. Figure 4.13 is the same network with the present value of the expansion costs on each link. The values of the states, the existing capacities, represented by the nodes, are shown on the left vertical axis. The capacity expansion problem is solved on Fig. 4.14 using the forward-moving algorithm.

A discrete capacity expansion network showing the present value of the expansion costs associated with each feasible expansion decision. Finding the best path through the network can be done using forward or backward-moving discrete dynamic programming

A capacity-expansion example, showing the results of a forward-moving dynamic programming algorithm. The numbers next to the nodes are the minimum cost to have reached that particular state at the end of the particular time period t
From the forward-moving solution to the dynamic programming problem shown in Fig. 4.14, the present value of the cost of the optimal capacity expansion schedule is 23 units of money. Backtracking (moving left against the arrows) from the farthest right node, this schedule adds 10 units of capacity in period t = 1, and 15 units of capacity in period t = 3.
Next consider the backward-moving algorithm applied to this capacity expansion problem. The general recursive equation for a backward-moving solution is
where F T+1(D T ) = 0 and as before each cost function is the discounted cost.
Once again, as shown in Fig. 4.14, the minimum total present value cost is 23 if 10 units of additional capacity are added in period t = 1 and 15 in period t = 3.
Now consider the question of the uncertainty of future demands, D t , discounted costs, C t (s t , x t ), as well as to the fact that the planning horizon T is only 5 time periods . Of importance is just how these uncertainties and finite planning horizon affect our decisions. While the model gives us a time series of future capacity expansion decisions for the next 5 time periods, what is important to decision-makers is what additional capacity to add in the current period, i.e., now, not what capacity to add in future periods. Does the uncertainty of future demands and costs and the 5-period planning horizon affect this first decision, x 1? This is the question to ask. If the answer is no, then one can place some confidence in the value of x 1. If the answer is yes, then more study may be warranted to determine which demand and cost scenario to assume, or, if applicable, how far into the future to extend the planning horizon.
Future capacity expansion decisions in time periods 2, 3, and so on can be based on updated information and analyses carried out closer to the time those decisions are to be made. At those times, the forecast demands and economic cost estimates can be updated and the planning horizon extended, as necessary, to a period that again does not affect the immediate decision. Note that in the example problem shown in Figs. 4.14 and 4.15, the use of 4 periods instead of 5 would have resulted in the same first-period decision. There is no need to extend the analysis to 6 or more periods.

A capacity-expansion example, showing the results of a backward-moving dynamic programming algorithm. The numbers next to the nodes are the minimum remaining cost to have the particular capacity required at the end of the planning horizon given the existing capacity of the state
To summarize: What is important to decision-makers is what additional capacity to add now. While the current period’s capacity addition should be based on the best estimates of future costs , interest rates and demands, once a solution is obtained for the capacity expansion required for this and all future periods up to some distant time horizon, one can then ignore all but that first decision, x 1: that is, what to add now. Then just before the beginning of the second period, the forecasting and analysis can be redone with updated data to obtain an updated solution for what if any capacity to add in period 2, and so on into the future. Thus, these sequential decision making dynamic programming models can be designed to be used in a sequential decision-making process.
4.4.7.2 Reservoir Operation
Reservoir operators need to know how much water to release and when. Reservoirs designed to meet demands for water supplies, recreation , hydropower, the environment and/or flood control need to be operated in ways that meet those demands in a reliable and effective manner. Since future inflows or storage volumes are uncertain, the challenge, of course, is to determine the best reservoir release or discharge for a variety of possible inflows and storage conditions that could exist or happen in each time period t in the future.
Reservoir release policies are often defined in the form of what are called “rule curves .” Figure 4.17 illustrates a rule curve for a single reservoir on the Columbia River in the northwestern United States. It combines components of two basic types of release rules. In both of these, the year is divided into various discrete within-year time periods . There is a specified release for each value of storage in each within-year time period. Usually higher storage zones are associated with higher reservoir releases. If the actual storage is relatively low, then less water is usually released so as to hedge against a continuing water shortage or drought.
Release rules may also specify the desired storage level for the time of year. The operator is to release water as necessary to achieve these target storage levels. Maximum and minimum release constraints might also be specified that may affect how quickly the target storage levels can be met. Some rule curves define multiple target storage levels depending on hydrological (e.g., snow pack) conditions in the upstream watershed , or on the forecast climate conditions as affected by ENSO cycles, solar geomagnetic activity, ocean currents and the like.
Reservoir release rule curves for a year, such as that shown in Fig. 4.16, define a policy that does not vary from one year to the next. The actual releases will vary, however, depending on the inflows and storage volumes that actually occur. The releases are often specified independently of future inflow forecasts. They are typically based only on existing storage volumes and within-year periods —the two axes of Fig. 4.16.

An example reservoir rule curve specifying the storage targets and some of the release constraints , given the particular current storage volume and time of year. The release constraints also include the minimum and maximum release rates and the maximum downstream channel rate of flow and depth changes that can occur in each month
Release rules are typically derived from trial and error simulations. To begin these simulations it is useful to have at least an approximate idea of the expected impact of different alternative policies on various system performance measures or objectives. Policy objectives could be the maximization of expected annual net benefits from downstream releases, reservoir storage volumes, hydroelectric energy and flood control, or the minimization of deviations from particular release, storage volume, hydroelectric energy or flood flow targets or target ranges. Discrete dynamic programming can be used to obtain initial estimates of reservoir-operating policies that meet these and other objectives. The results of discrete dynamic programming can be expressed in the form shown in Fig. 4.17.

Network representation of the four-season reservoir release problem. Given any initial storage volume S t at the beginning of a season t, and an expected inflow of Q t during season t, the links indicate the possible release decisions corresponding to those in Table 4.7
A numerical example
As a simple example, consider a reservoir having an active storage capacity of 20 million cubic meters, or for that matter any specified volume units. The active storage volume in the reservoir can vary between 0 and 20. To use discrete dynamic programming, this range of possible storage volumes must be divided into a set of discrete values. These will be the discrete state variable values. In this example let the range of storage volumes be divided into intervals of 5 storage volume units. Hence, the initial storage volume, S t , can assume values of 0, 5, 10, 15, and 20 for all periods t.
For each period t, let Q t be the mean inflow, L t (S t , S t+1) the evaporation and seepage losses that depend on the initial and final storage volumes in the reservoir, and R t the release or discharge from the reservoir. Each variable is expressed as volume units for the period t.
Storage volume continuity requires that in each period t the initial active storage volume , S t , plus the inflow, Q t , less the losses, L t (S t , S t+1), and release, R t , equals the final storage, or equivalently the initial storage, S t+1, in the following period t + 1. Hence
To satisfy the requirement (imposed for convenience in this example) that each storage volume variable be a discrete value over the range from 0 to 20 in units of 5, the releases, R t , must be such that when Q t − R t − L t (S t , S t+1) is added to S t the resulting value of S t+1 is one of the five discrete numbers between 0 and 20.
Assume four within-year periods t in each year (kept small for this illustrative example). In these four seasons assume the mean inflows, Q t , are 24, 12, 6, and 18, respectively. Table 4.6 defines the evaporation and seepage losses based on different discrete combinations of initial and final storage volumes for each within-year period t.
Rounding these losses to the nearest integer value, Table 4.7 shows the net releases associated with initial and final storage volumes. They are computed using Eq. 4.107. The information in Table 4.7 allows us to draw a network representing each of the discrete storage volume states (the nodes), and each of the feasible releases (the links). This network for the four seasons t in the year is illustrated in Fig. 4.17.
This reservoir-operating problem is a multistage decision-making problem. As Fig. 4.17 illustrates, at the beginning of any season t, the storage volume can be in any of the five discrete states. Given the state, a release decision is to be made. This release will depend on the state: the initial storage volume and the mean inflow, as well as the losses that may be estimated based on the initial and final storage volumes, as defined in Table 4.6. The release will also depend on what is to be accomplished—that is, the objectives to be satisfied.
For this example, assume there are various targets that water users would like to achieve. Downstream water users want reservoir operators to meet their flow targets. Individuals who use the lake for recreation want the reservoir operators to meet storage volume or storage level targets. Finally, individuals living on the downstream floodplain want the reservoir operators to provide storage capacity for flood protection . Table 4.8 identifies these different targets that are to be met, if possible, for the duration of each season t.
Clearly, it will not be possible to meet all these storage volume and release targets in all four seasons, given inflows of 24, 12, 6, and 18, respectively. Hence, the objective in this example will be to do the best one can: to minimize a weighted sum of squared deviations from each of these targets. The weights reflect the relative importance of meeting each target in each season t. Target deviations are squared to reflect the fact that the marginal “losses” associated with deviations increase with increasing deviations. Small deviations are not as serious as larger deviations, and it is better to have numerous small deviations rather than a few larger ones.
During the recreation season (periods 2 and 3), deviations below or above the recreation storage lake volume targets are damaging. During the flood season (period 1), any storage volume in excess of the flood control storage targets of 15 reduces the flood storage capacity . Deviations below that flood control target are not penalized. Flood control and recreation storage targets during each season t apply throughout the season, thus they apply to the initial storage S t as well as to the final storage S t+1 in appropriate periods t.
The objective is to minimize the sum of total weighted squared deviations, TSD t , over all seasons t from now on into the future:
where
In the above equation, when t = 4, the last period of the year, the following period t + 1 = 1, the first period in the following year. Each ES t is the storage volume in excess of the flood storage target volume, TF. Each DR t is the difference between the actual release, R t , and the target release, TR t , when the release is less than the target.
The excess storage, ES t , above the flood target storage TF at the beginning of each season t can be defined by the constraint:
The deficit release, DR t , during period t can be defined by the constraint:
The first component of the right side of Eq. 4.109 defines the weighted squared deviations from a recreation storage target, TS, at the beginning and end of season t. In this example the recreation season is during periods 2 and 3. The weights, ws t , associated with the recreation component of the objective are 1 in periods 2 and 3. In periods 1 and 4 the weights, ws t , are 0.
The second component of Eq. 4.109 is for flood control. It defines the weighted squared deviations associated with storage volumes in excess of the flood control target volume, TF, at the beginning and end of the flood season, period t = 1. In this example, the weights, wf t , are 1 for period 1 and 0 for periods 2, 3, and 4. Note the conflict between flood control and recreation at the end of period 1 or equivalently at the beginning of period 2.
Finally, the last component of Eq. 4.109 defines the weighted squared deficit deviations from a release target, TR t , In this example all release weights, wr t, equal 1.
Associated with each link in Fig. 4.17 is the release, R t , as defined in Table 4.7. Also associated with each link is the sum of weighted squared deviations, TSD t , that result from the particular initial and final storage volumes and the storage volume and release targets identified in Table 4.8. They are computed using Eq. 4.109, with the releases defined in Table 4.7 and targets defined in Table 4.8, for each feasible combination of initial and final storage volumes, S t and S t+1, for each of the four seasons or periods in a year. These computed weighted squared deviations for each link are shown in Table 4.9.
The goal in this example problem is to find the path through a multiyear network—each year of which is as shown in Fig. 4.17—that minimizes the sum of the squared deviations associated with each of the path’s links. Again, each link’s weighted squared deviations are given in Table 4.9. Of interest is the best path into the future from any of the nodes or states (discrete storage volumes) that the system could be in at the beginning of any season t.
These paths can be found using the backward-moving solution procedure of discrete dynamic programming. This procedure begins at any arbitrarily selected time period or season when the reservoir presumably produces no further benefits to anyone (and it does not matter when that time is—just pick any time) and proceeds backward, from right to left one stage (i.e., one time period) at a time, toward the present. At each node (representing a discrete storage volume S t and inflow Q t ), we can calculate the release or final storage volume in that period that minimizes the remaining sum of weighted squared deviations for all remaining seasons. Denote this minimum sum of weighted squared deviations for all n remaining seasons t as \( F_{t}^{n} \left( {S_{t} ,Q_{t} } \right) \). This value is dependent on the state (S t , Q t ), and stage, t, and the number n of remaining seasons. It is not a function of the decision R t or S t+1.
This minimum sum of weighted squared deviations for all n remaining seasons t is equal to
where
and
The policy we want to derive is called a steady-state policy. Such a policy assumes the reservoir will be operating for a relatively long time with the same objectives and a repeatable hydrologic time series of seasonal inputs. We can find this steady-state policy by first assuming that at some time all future benefits, losses or penalties, \( F_{t}^{^\circ } (S_{t} ,Q_{t} ) \), will be 0.
We can begin in that last season t of reservoir operation and work backwards toward the present, moving left through the network one season t at a time. We can continue for multiple years until the annual policy begins repeating itself each year. In other words, when the optimal R t associated with a particular state (S t , Q t ) is the same in two or more successive years, and this applies for all states (S t , Q t ) in each season t, a steady-state policy has probably been obtained. (A more definitive test of whether or not a steady-state policy has been reached will be discussed later.) A steady-state policy will occur if the inflows, Q t , and objectives, TSD t (S t , R t , S t+1), remain the same for specific within-year periods from year to year. This steady-state policy is independent of the assumption that the operation will end at some point.
To find the steady-state operating policy for this example problem, assume the operation ends in some distant year at the end of season 4 (the right-hand side nodes in Fig. 4.17). At the end of this season the number of remaining seasons, n, equals 0. The values of the remaining minimum sums of weighted squared deviations, \( F_{t}^{^\circ } (S_{t} ,Q_{t} ) \) associated with each state (S t , Q t ), i.e., each node, equal 0. Since for this problem there is no future. Now we can begin the process of finding the best releases R t in each successive season t, moving backward to the beginning of stage t = 4, then stage t = 3, then to t = 2, and then to t = 1, and then to t = 4 of the preceding year, and so on, each move to the left increasing the number of remaining seasons n by one.
At each stage, or season t, for each discrete state (S t , Q t ) we can compute the release R t or equivalently the final storage volume S t+1, that minimizes
The decision variable can be either the release, R t , or the final storage volume, S t+1. If the decision variable is the release, then the constraints on that release R t are
and
If the decision variable is the final storage volume, S t+1, the constraints on that final storage volume are
and
Note that if the decision variable is S t+1 in season t, this decision becomes the state variable in season t + 1. In both cases, the storage volumes in each season are limited to discrete values 0, 5, 10, 15, and 20.
Tables 4.10, 4.11, 4.12, 4.13, 4.14, 4.15, 4.16, 4.17, 4.18 and 4.19 show the values obtained from solving the recursive equations for 10 successive seasons or stages (2.5 years). Each table represents a stage or season t, beginning with Table 4.10 at t = 4 and the number of remaining seasons n = 1. The data in each table are obtained from Tables 4.7 and 4.9. The last two columns of each table represent the best release and final storage volume decision(s) associated with the state (initial storage volume and inflow).
Note that the policy defining the release or final storage for each discrete initial storage volume in season t = 3 in Table 4.12 is the same as in Table 4.16, and similarly for season t = 4 in Tables 4.13 and 4.17, and for season t = 1 in Tables 4.14 and 4.18, and finally for season t = 2 in Tables 4.15 and 4.19. The policy differs over each state, and over each different season, but not from year to year for any specified state and season. This indicates we have reached a steady-state policy. If we kept on computing the release and final storage policies for preceding seasons, we would get the same policy as that found for the same season in the following year. The policy is dependent on the state—the initial storage volume in this case—and on the season t, but not on the year. This policy as defined in Tables 4.16, 4.17, 4.18 and 4.19 is summarized in Table 4.20.
This policy can be defined as a rule curve, as shown in Fig. 4.18. It provides a first approximation of a reservoir release rule curve that one can improve upon using simulation.

Reservoir rule curve based on policy defined in Table 4.20. Each season is divided into storage volume zones. The releases associated with each storage volume zone are specified. Also shown are the storage volumes that would result if in each year the actual inflows equaled the inflows used to derive this rule curve
Table 4.20 and Fig. 4.18 define a policy that can be implemented for any initial storage volume condition at the beginning of any season t. This can be simulated under different flow patterns to determine just how well it satisfies the overall objective of minimizing the weighted sum of squared deviations from desired, but conflicting, storage and release targets. There are other performance criteria that may also be evaluated using simulation, such as measures of reliability , resilience , and vulnerability (Chap. 9).
Assuming the inflows that were used to derive this policy actually occurred each year, we can simulate the derived sequential steady-state policy to find the storage volumes and releases that would occur in each period, year after year, once a repetitive steady-state condition were reached. This is done in Table 4.21 for an arbitrary initial storage volume of 20 in season t = 1. You can try other initial conditions to verify that it requires only 2 years at most to reach a repetitive steady-state policy.
As shown in Table 4.21, if the inflows were repetitive and the optimal policy was followed, the initial storage volumes and releases would begin to repeat themselves once a steady-state condition has been reached. Once reached, the storage volumes and releases will be the same each year (since the inflows are the same). These storage volumes are denoted as a blue line on the rule curve shown in Fig. 4.18. The annual total squared deviations will also be the same each year. As seen in Table 4.21, this annual minimum weighted sum of squared deviations for this example equals 186. This is what would be observed if the inflows assumed for this analysis repeated themselves.
Note from Tables 4.12, 4.13, 4.14, 4.15 and 4.16, 4.17, 4.18, 4.19 that once the steady-state sequential policy has been reached for any specified storage volume, S t , and season t, the annual difference of the accumulated minimum sum of squared deviations equals a constant, namely the annual value of the objective function. In this case that constant is 186.
This condition indicates a steady-state policy has been achieved.
This policy in Table 4.21 applies only for the assumed inflows in each season. It does not define what to do if the initial storage volumes or inflows differ from those for which the policy is defined. Initial storage volumes and inflows can and will vary from those specified in the solution of any deterministic model . One fact is certain: no matter what inflows are assumed in any model, the actual inflows will always differ. Hence, a policy as defined in Table 4.20 and Fig. 4.18 is much more useful than that in Table 4.21. In Chap. 8 we will modify this reservoir operation model to define releases or final storage volumes as functions of not only discrete storage volumes S t but also of discrete possible inflows Q t . However, the policy defined by any relatively simple optimization model policy should be simulated, evaluated, and further refined in an effort to identify the policy that best meets the operating policy objectives.
4.4.8 General Comments on Dynamic Programming
Before ending this discussion of using dynamic programming methods for analyzing water resources planning, management and operating policy problems, we should examine a major assumption that has been made in each of the applications presented. The first is that the net benefits or costs or other objective values resulting at each stage of the problem are dependent only on the state and decision variable values in each stage. They are independent of decisions made at other stages. If the returns at any stage are dependent on the decisions made at other stages, then dynamic programming, with some exceptions, becomes more difficult to apply. Dynamic programming models can be applied to design problems, such as the capacity expansion problem or to operating problems, such as the water-allocation and reservoir operation problems, but rarely to problems having both unknown design and operating policy decision variables at the same time. While there are some tricks that may allow dynamic programming to be used to find the best solutions to both design and operating problems encountered in water resources planning, management and operating policy studies, other optimization methods, perhaps combined with dynamic programming where appropriate, are often more useful.
4.5 Linear Programming
If the objective function and constraints of an optimization model are all linear, many readily available computer programs exist for finding its optimal solution. Surprisingly many water resource systems problems meet these conditions of linearity. These linear optimization programs are very powerful, and unlike many other optimization methods, they can be applied successfully to very large optimization problems containing many variables and constraints. Many water resources problems are too large to be easily solved using nonlinear or dynamic programming methods. The number of variables and constraints simply defining mass balances and capacity limitations in numerous time periods can become so big as to preclude the practical use of most other optimization methods. Linear programming procedures or algorithms for solving linear optimization models are often the most efficient ways to find solutions to such problems. Hence there is an incentive to convert large optimization models to a linear form. Some ways of doing this are discussed later in this chapter.
Because of the availability of computer programs that can solve linear programming problems, linear programming is arguably the most popular and commonly applied optimization algorithm in practical use today. It is used to identify and evaluate alternative plans, designs and management policies in agriculture , business, commerce, education, engineering, finance, the civil and military branches of government, and many other fields.
In spite of its power and popularity, for most real-world water resources planning and management problems, linear programming, like the other optimization methods already discussed in this chapter, is best viewed as a preliminary screening tool. Its value is more for reducing the number of alternatives for further more detailed simulations than for finding the best decision. This is not just because approximation methods may have been used to convert nonlinear functions to linear ones, but more likely because it is difficult to incorporate all the complexity of the system and all the objectives considered important to all stakeholders into a linear model . Nevertheless, linear programming, like other optimization methods, can provide initial designs and operating policy information that simulation models require before they can simulate those designs and operating policies.
Equations 4.41 and 4.42 define the general structure of any constrained optimization problem. If the objective function F(X) of the vector X of decision variables x j is linear and if all the constraints g i (X) in Eq. 4.42 are linear, then the model becomes a linear programming model. The general structure of a linear programming model is
Subject to
If any model fits this general form, where the constraints can be any combination of equalities (=) and inequalities (≥ or ≤), then a large variety of linear programming computer programs can be used to find the “optimal” values of all the unknown decision variables x j . Variable nonnegativity is enforced within the solution algorithms of most commercial linear programming programs, eliminating the need to have to specify these conditions in any particular application.
Potential users of linear programming algorithms need to know how to construct linear models and how to use the computer programs that are available for solving them. They do not have to understand all the mathematical details of the solution procedure incorporated in the linear programming codes. But users of linear programming computer programs should understand what the solution procedure does and what the computer program output means . To begin this discussion of these topics, consider some simple examples of linear programming models.
4.5.1 Reservoir Storage Capacity-Yield Models
Linear programming can be used to define storage capacity-yield functions for a single or multiple reservoirs. A storage capacity-yield function defines the maximum constant “dependable” reservoir release or yield that will be available, at a given level of reliability , during each period of operation, as a function of the active storage volume capacity. The yield from any reservoir or group of reservoirs will depend on the active storage capacity of each reservoir and the water that flows into each reservoir, i.e., their inflows. Figure 4.19 illustrates two typical storage-yield functions for a single reservoir.

Two storage-yield functions for a single reservoir defining the maximum minimum dependable release. These functions can be defined for varying levels of yield reliability
To describe what a yield is and how it can be increased, consider a sequence of 5 annual flows, say 2, 4, 1, 5, and 3, at a site in an unregulated stream. Based on this admittedly very limited record of flows, the minimum (historically) “dependable” annual flow yield of the stream at that site is 1, the minimum observed flow. Assuming the flow record is representative of what future flows might be, a discharge of 1 can be “guaranteed” in each period of record. (In reality, that or any nonzero yield will have a reliability less than 1, as will be considered in Chaps. 6 and 10.)
If a reservoir having an active storage capacity of 1 is built, it could store 1 volume unit of flow when the flow is greater than 2. It could then release it along with the natural flow when the natural flow is 1, increasing the minimum dependable flow to 2 units in each year. Storing 2 units when the flow is 5, releasing 1 and the natural flow when that natural flow is 2, and storing 1 when the flow is 4, and then releasing the stored 2 units along with the natural flow when the natural flow is 1, will permit a yield of 3 in each time period with 2 units of active capacity. This is the maximum annual yield that is possible at this site, again based on these five annual inflows and their sequence. The maximum annual yield cannot exceed the mean annual flow, which in this example is 3. Hence, the storage capacity-yield function equals 1 when the active capacity is 0, 2 when the active capacity is 1, and 3 when the active capacity is 2. The annual yield remains at 3 for any active storage capacity in excess of 2.
This storage-yield function is dependent not only on the natural unregulated annual flows but also on their sequence. For example if the sequence of the same 5 annual flows were 5, 2, 1, 3, 4, the needed active storage capacity is 3 instead of 2 volume units as before to obtain a dependable flow or yield of 3 volume units. In spite of these limitations of storage capacity-yield functions, historical records are still typically used to derive them. (Ways of augmenting the historical flow record are discussed in Chap. 6.)
There are many methods available for deriving storage-yield functions . One very versatile method, especially for multiple reservoir systems, uses linear programming. Others are discussed in Chap. 10.
To illustrate a storage capacity-yield model, consider a single reservoir that must provide at least a minimum release or yield Y in each period t. Assume a record of known (historical or synthetic) streamflows at the reservoir site is available. The problem is to find the maximum constant yield Y obtainable from a given active storage capacity. The objective is to
This maximum yield is constrained by the water available in each period, and by the reservoir capacity . Two sets of constraints are needed to define the relationships among the inflows, the reservoir storage volumes, the yields, any excess release, and the reservoir capacity. The first set of continuity equations equate the unknown final reservoir storage volume S t+1 in period t to the unknown initial reservoir storage volume S t plus the known inflow Q t , minus the unknown yield Y and excess release, R t , if any, in period t. (Losses are being ignored in this example.)
If, as indicated in Eq. 4.127, one assumes that period 1 follows the last period T, it is not necessary to specify the value of the initial storage volume S 1 and/or final storage volume S T+1. They are set equal to each other and that variable value remains unknown. The resulting “steady-state” solution is based on the inflow sequence that is assumed to repeat itself as well as the available storage capacity, K.
The second set of required constraints ensures that the reservoir storage volumes S t at the beginning of each period t are no greater than the active reservoir capacity K.
To derive a storage-yield function, the model defined by Eqs. 4.126–4.128 must be solved for various assumed values of capacity K. Only the inflow values Q t and reservoir active storage capacity K are assumed known. All other storage, release and yield variables are unknown. Linear programming will be able to find their optimal values. Clearly, the upper bound on the yield regardless of reservoir capacity will equal the mean inflow (less any losses if they were included).
Alternatively, one can solve a number of linear programming models that minimize an unknown storage capacity K needed to achieve various specified yields Y. The resulting storage-yield functions will be same. The minimum capacity needed to achieve a specified yield will be the same as the maximum yield obtainable from the corresponding specified capacity K. However, the specified yield Y cannot exceed the mean inflow. If an assumed value of the yield exceeds the mean inflow, there will be no feasible solution to the linear programming model.
Box 4.1 illustrates an example storage-yield model and its solutions to find the storage-yield function. For this problem, and others in this chapter, the program LINGO (freely obtained from www.lindo.com) is used.
Box 4.1. Example storage capacity-yield model and its solution from LINGO

Before moving to another application of linear programming, consider how this storage-yield problem, Eqs. 4.126–4.128, can be formulated as a discrete dynamic programming model. The use of discrete dynamic programming is clearly not the most efficient way to define a storage-yield function but the problem of finding a storage-yield function provides a good exercise in dynamic programming. The dynamic programming network has the same form as shown in Fig. 4.19, where each node is a discrete storage and inflow state, and the links represent releases. Let \( F_{t}^{n} \left( {S_{t} } \right) \) be the maximum yield obtained given a storage volume of S t at the beginning of period t of a year with n periods remaining of reservoir operation . For initial conditions, assume all values of \( F_{t}^{0} \left( {{\text{S}}_{t} } \right) \) for some final period t with no more periods n remaining equal a large number that exceeds the mean annual inflow. Then for the set of feasible discrete total releases R t :
This applies for all discrete storage volumes S t and for all within-year periods t and remaining periods n. The constraints on the decision variables R t are
These recursive Eqs. 4.129 together with constraint Eqs. 4.130 can be solved, beginning with n = 1 and then for successive values of seasons t and remaining periods n, until a steady-state solution is obtained, that is, until
The steady-state yields F t (S t ) will depend on the storage volumes S t . High initial storage volumes will result in higher yields than will lower ones. The highest yield will be that associated with the highest storage volumes and it will equal the same value obtained from either of the two linear programming models.
4.5.2 A Water Quality Management Problem
Some linear programming modeling and solution techniques can be demonstrated using the simple water quality management example shown in Fig. 4.21. In addition, this example can serve to illustrate how models can help identify just what data are needed and how accurate they must be for the decisions that are being considered.
The stream shown in Fig. 4.20 receives wastewater effluent from two point sources located at sites 1 and 2. Without some wastewater treatment at these sites, the concentration of some pollutant, P j mg/l, at sites j = 2 and 3, will continue to exceed the maximum desired concentration \( P_{j}^{\hbox{max} } \). The problem is to find the level of wastewater treatment (waste removed) at sites i = 1 and 2 that will achieve the desired concentrations just upstream of site 2 and at site 3 at a minimum total cost.

A stream pollution problem that requires finding the waste removal efficiencies (x 1, x 2) of wastewater treatment at sites 1 and 2 that meet the stream quality standards at sites 2 and 3 at minimum total cost. W 1 and W 2 are the amounts of pollutant prior to treatment at sites 1 and 2
This is the classic water quality management problem that is frequently found in the literature, although least-cost solutions have rarely if ever been applied in practice. There are valid reasons for this that we will review later. Nevertheless, this particular problem can serve to illustrate the development of some linear models for determining data needs as well as for finding, in this case, cost-effective treatment efficiencies. This problem can also serve to illustrate graphically the general mathematical procedures used for solving linear programming problems.
The first step is to develop a model that predicts the pollutant concentrations in the stream as a function of the pollutants discharged into it. To do this we need some notation. Define W j as the mass of pollutant generated at site j (j = 1, 2) each day. Without any treatment and assuming no upstream pollution concentration, the discharge of W 1 (in units of mass per unit time, (M/T) at site j = 1 results in pollutant concentration of P 1 in the stream at that site. This concentration, (M/L3) equals the discharge W 1 (M/T) divided by the streamflow Q 1 (L3/T) at that site. For example, assuming the concentration is expressed in units of mg/l and the flow is in terms of m3/s, and mass of pollutant discharged is expressed as kg/day, and the flow component of the wastewater discharge is negligible compared to the streamflow, the resulting streamflow concentration P 1 at site j = 1 is W 1/86.4 Q 1:
Each unit of a degradable pollutant mass in the stream at site 1 in this example will decrease as it travels downstream to site 2. Similarly each unit of the pollutant mass in the stream at site 2 will decrease as it travels downstream to site 3. The fraction α ij of the mass at site i that reaches site j is often assumed to be
where k is a rate constant (1/time unit) that depends on the pollutant and the temperature , and t ij is the time (number of time units) it takes a particle of pollutant to flow from site i to site j. The actual concentration at the downstream end of a reach will depend on the streamflow at that site as well as on the initial pollutant mass, the time of travel and decay rate constant k.
In this example problem, the fraction of pollutant mass at site 1 that reaches site 3 is the product of the transfer coefficients α 12 and α 23:
In general, for any site k between sites i and j:
Knowing the α ij values for any pollutant and the time of flow t ij permits the determination of the rate constant k for that pollutant and reach, or contiguous series of reaches, from sites i to j, using Eq. 4.133. If the value of k is 0, the pollutant is called a conservative pollutant; salt is an example of this. Only increased dilution by less saline water will reduce its concentration.
For the purposes of determining wastewater treatment efficiencies or other capital investments in infrastructure designed to control the pollutant concentrations in the stream, some “design” streamflow conditions have to be established. Usually the design streamflow conditions are set at low-flow values (e.g., the lowest monthly average flow expected once in twenty years, or the minimum 7-day average flow expected once in ten years). Low design flows are based on the assumption that pollutant concentrations will be higher in low-flow conditions than in higher flow conditions because of less dilution. While low-flow conditions may not provide as much dilution, they result in longer travel times, and hence greater reductions in pollutant masses between water quality monitoring sites. Hence the pollutant concentrations may well be greater at some downstream site when the flow conditions are higher than those of the design low-flow value.
In any event, given particular design streamflow and temperature conditions, our first job is to determine the values of these dimensionless transfer coefficients α ij . They will be independent of the amount of waste discharged into the stream as long as the stream stays aerobic. To determine both α 12 and α 23 in this example problem (Fig. 4.20) requires a number of pollutant concentration measurements at sites 1, 2 and 3 during design streamflow conditions. These measurements of pollutant concentrations must be made just downstream of the wastewater effluent discharge at site 1, just upstream and downstream of the wastewater effluent discharge at site 2, and at site 3.
Assuming no change in streamflow and no extra pollutant entering the reach that begins at site 1 and ends just upstream of site 2, the mass (kg/day) of pollutants just upstream of site 2 will equal the mass at site 1, W 1, times the transfer coefficient α 12:
From this equation and 4.132 one can calculate the concentration of pollutants just upstream of site 2.
The mass of additional pollutant discharged into site 2 is W 2. Hence the total mass just downstream of site 2 is W 1 α 12 + W 2. At site 3 the pollutant mass will equal the mass just downstream of site 2, times the transfer coefficient a23. Given a streamflow of Q 3 m3/s and pollutant masses W 1 and W 2 kg/day, the pollutant concentration P 3 expressed in mg/l will equal
4.5.2.1 Model Calibration
Sample measurements are needed to estimate the values of each reach’s pollutant transport coefficients a ij . Assume five pairs of sample pollutant concentration measurements have been taken in the two stream reaches (extending from site 1 to site 2, and from site 2 to site 3) during design flow conditions. For this example, also assume that the design streamflow just downstream of site 1 and just upstream of site 2 are the same and equal to 12 m3/s. The concentration samples taken just downstream from site 1 and just upstream of site 2 during this design flow condition can be used to solve for the transfer coefficients α 12 and α 23 after adding error terms. More than one sample is needed to allow for measurement errors and other random effects such as those from varying temperature , wind, incomplete mixing or varying wasteload discharges within a day.
Denote the concentrations of each pair of sample measurements s in the first reach (just downstream of site 1 and just upstream of site 2) as P 1s and P 2s and their combined error as E s. Thus
The problem is to find the best estimates of the unknown α 12. One way to do this is to define “best” as those values of α 12 and all E s that minimize the sum of the absolute values of all the error terms E s. This objective could be written
The set of Eqs. 4.138 and 4.139 is an optimization model . The absolute value signs in Eq. 4.139 can be removed by writing each error term as the difference between two nonnegative variables, PEs − NEs. Thus for each sample pair s:
If any E s is negative, PEs will be 0 and −NEs will equal E s. The actual value of NE s is nonnegative. If E s is positive, it will equal PE s, and NE s will be 0. The objective function, Eq. 4.139, that minimizes the sum of absolute value of error terms, can now be written as one that minimizes the sum of the positive and negative components of E s:
Equations 4.139 and 4.140, together with objective function 4.141 and a set of measurements, P 1s and P 2s, upstream and downstream of the reach between sites 1 and 2 define a linear programming model that can be solved to find the transfer coefficient α 12. An example illustrating the solution of this model for the stream reach between site 1 and just upstream of site 2 is presented in Box 4.2. (In this model the measured concentrations are denoted as SP js rather than P js. Again, the program LINGO (www.lindo.com) is used to solve the model).
Box 4.3 contains the model and solution for the reach beginning just downstream of site 2 to site 3. In this reach the design streamflow is 12.5 m3/s due to the addition of wastewater flow at site 2.
As shown in Boxes 4.2 and 4.3, the values of the transfer coefficients are α 12 = 0.25 and α 23 = 0.60. Thus from Eq. 4.134, α 12 α 23 = α 13 = 0.15.
4.5.2.2 Management Model
Now that these parameter values α ij are known, a water quality management model can be developed. The water quality management problem, illustrated in Fig. 4.20, involves finding the fractions x i of waste removal at sites i = 1 and 2 that meet the stream quality standards at the end of the two reaches at a minimum total cost.
The pollutant concentration, P 2, just upstream of site 2 that results from the pollutant concentration at site 1 equals the total mass of pollutant at site 1 times the fraction α 12 that remains at site 2, divided by the streamflow Q 2 at site 2. The total mass of pollutant at site 1 at the wastewater discharge point is the sum of the mass just upstream of the discharge site, P 1 Q 1, plus the mass discharged into the stream, W 1(1 − x 1), at site 1. The parameter W 1 is the total mass of pollutant entering the treatment plant at site 1. Similarly for site 2. The fraction of waste removal, x 1, at site 1 is to be determined. Hence the concentration of pollutant just upstream of site 2 is
The terms P 1 and Q 1 are the pollutant concentration (M/L3) and streamflow (L3/T) just upstream of the wastewater discharge outfall at site 1. Their product is the mass of pollutant at that site per unit time period (M/T).
The pollutant concentration, P 3, at site 3 that results from the pollutant concentration at site 2 equals the total mass of pollutant at site 2 times the fraction a 23. The total mass of pollutant at site 2 at the wastewater discharge point is the sum of what is just upstream of the discharge site, P 2 Q 2, plus what is discharged into the stream, W 2(1 − x 2). Hence the concentration of pollutant at site 3 is
Box 4.2. Calibration of water quality model transfer coefficient parameter a 12

Equations 4.142 and 4.143 will become the predictive portion of the water quality management model . The remaining parts of the model include the restrictions on the pollutant concentrations just upstream of site 2 and at site 3, and limits on the range of values that each waste removal efficiency, x i, can assume.
Finally, the objective is to minimize the total cost of meeting the stream quality standards \( P_{2}^{\hbox{max} } \) and \( P_{3}^{\hbox{max} } \) specified in Eqs. 4.144. Letting C i (x i ) represent the cost function of wastewater treatment at sites i = 1 and 2, the objective can be written:
The complete optimization model consists of Eqs. 4.142–4.146. There are four unknown decision variables, x 1; x 2, P 2, and P 3.
Some of the constraints of this optimization model can be combined to remove the two unknown concentration values, P 2 and P 3. Combining Eqs. 4.142 and 4.144, the concentration just upstream of site 2 must be no greater than \( P_{2}^{\hbox{max} } \):
Combining Eqs. 4.143 and 4.144, and using the fraction α 13 (see Eq. 4.134) to predict the contribution of the pollutant concentration at site 1 on the pollutant concentration at Site 3:
Box 4.3. Calibration of water quality model transfer coefficient parameter a 23

Equation 4.148 assumes that each pollutant discharged into the stream can be tracked downstream, independent of the other pollutants in the stream. Alternatively, Eq. 4.148 computes the sum of all the pollutants found at site 2 and then uses that total mass to compute the concentration at site 3. Both modeling approaches give the same results if the parameter values and cost functions are the same.
To illustrate the solution of either of these models, assume the values of the parameters are as listed in Table 4.22. Rewriting the water quality management model defined by Eqs. 4.145–4.148 and substituting the parameter values in place of the parameters, and recalling that kg/day = 86.4 (mg/l)(m3/s):
The water quality constraint at site 2, Eq. 4.147, becomes
that when simplified is
The water quality constraint at site 3, Eq. 4.148, becomes
that when simplified is
Restrictions on fractions of waste removal, Eq. 4.145, must also be added to this model.
The feasible combinations of x 1 and x 2 can be shown on a graph, as in Fig. 4.21. This graph is a plot of each constraint, showing the boundaries of the region of combinations of x 1 and x 2 that satisfy all the constraints. This red shaded region is called the feasible region.

Plot of the constraints of water quality management model identifying those values of the unknown (decision) variables x 1 and x 2 that satisfy all the constraints . These feasible values are contained in and on the boundaries of the red region
To find the least-cost solution we need the cost functions C 1(x 1) and C 2(x 2) in Eqs. 4.146. Suppose these functions are not known. Can we determine the least-cost solution without knowing these costs? Models like the one just developed can be used to determine just how accurate these cost functions (or the values of any of the model parameters) need to be for the decisions being considered.
While the actual cost functions are not known in this example, their general form can be assumed, as shown in Fig. 4.22. Since the wasteloads produced at site 1 are substantially greater than those produced at site 2, and given similar site, labor, and material cost conditions, it seems reasonable to assume that the cost of providing a specified level of treatment at site 1 would exceed (or certainly be no less than) the cost of providing the same specified level of treatment at Site 2. It would also seem the marginal costs at site 1 would be greater than, or at least no less than, the marginal costs at site 2 for any given treatment efficiency. The relative positions of the cost functions shown in Fig. 4.23 are based on these assumptions.

General form of total cost functions for wastewater treatment efficiencies at sites 1 and 2 in Fig. 4.20. The dashed straight-line slopes c 1 and c 2 are the average cost per unit (%) removal for 80% treatment. The actual average costs clearly depend on the values of the waste removal efficiencies x 1 and x 2, respectively

Plots of various objective functions (dashed lines) together with the constraints of the water quality management model
Rewriting the cost function, Eq. 4.146, as a linear function converts the model defined by Eqs. 4.145–4.148 into a linear programming model. For this example problem, the linear programming model can be written as:
Equation 4.151 is minimized subject to constraints 4.145, 4.149 and 4.150. The values of c 1 and c 2 depend on the values of x 1 and x 2 and both pairs are unknown. Even if we knew the values of x 1 and x 2 before solving the problem, in this example the cost functions themselves (Fig. 4.22) are unknown. Hence, we cannot determine the values of the marginal costs c 1 and c 2. However, we might be able to judge which marginal cost will likely be greater than the other for any particular values of the decision variables x 1 and x 2. In this example that is all we need to know.
First, assume c 1 equals c 2. Let c 1 x 1 + c 2 x 2 equal c and assume c/c 1 = 1. Thus the cost function is x 1 + x 2 = 1.0. This line can be plotted onto the graph in Fig. 4.21, as shown by line “a” in Fig. 4.23.
Line “a” in Fig. 4.23 represents equal values for c 1 and c 2, and the total cost, c 1 x 1 + c 2 x 2, equal to 1. Keeping the slope of this line constant and moving it upward, representing increasing total costs, to line “b”, where it covers the nearest point in the feasible region, will identify the least-cost combination of x 1 and x 2, again assuming the marginal costs are equal. In this case the solution is approximately 80% treatment at both sites.
Note this particular least-cost solution also applies for any value of c 1 greater than c 2 (for example line “c” in Fig. 4.23). If the marginal cost of 80% treatment at site 1 is no less than the marginal cost of 80% treatment at site 2, then c 1 ≥ c 2 and indeed the 80% treatment efficiencies will meet the stream standards for the design streamflow and wasteload conditions at a total minimum cost. In fact, from Fig. 4.23 and Eq. 4.150, it is clear that c 2 has to exceed c 1 by a multiple of 1.28 before the least-cost solution changes to another solution. For any other assumption regarding c 1 and c 2, 80% treatment at both sites will result in a least-cost solution to meeting the water quality standards for those design wasteload and streamflow conditions.
If c 2 exceeds 1.28c 1, as illustrated by line “d”, then the least-cost solution would be x 1 = 100% and x 2 = 62%. Clearly, in this example the marginal cost, c 1, of providing 100% wasteload removal at site 1 will exceed the marginal cost, c 2, of 60% removal at site 2, and hence, that combination of efficiencies would not be a least-cost one. Thus we can be confident that the least-cost solution is to remove 80% of the waste produced at both waste-generating sites.
Note the least-cost wasteload removal efficiencies have been determined without knowing the cost functions. Why spend money defining these functions more precisely? The answer: costs need to be known for financial planning, if not for economic analyses. No doubt the actual costs of installing the least-cost treatment efficiencies of 80% will have to be determined for issuing bonds or making other arrangements for paying the costs. However, knowing the least-cost removal efficiencies means we do not have to spend money defining the entire cost functions C i (x i ). Estimating the construction and operating costs of achieving just one wastewater removal efficiency at each site, namely 80%, should be less expensive than defining the total costs for a range of practical treatment plant efficiencies that would be required to define the total cost functions, such as shown in Fig. 4.22.
Admittedly this example is relatively simple. It will not always be possible to determine the “optimal ” solutions to linear programming problems, or other optimization problems, without knowing more about the objective function than was assumed for this example. However, this exercise illustrates the use of modeling for purposes other than finding good or “optimal” solutions. Models can help define the necessary precision of the data needed to find those solutions.
Modeling and data collection and analysis should take place simultaneously. All too often planning exercises are divided into two stages: data collection and then analysis. Until one knows what data one will need, and how accurate those data must be, one need not spend money and time collecting them. Conversely, model development in the absence of any knowledge of the availability and cost of obtaining data can lead to data requirements that are costly, or even impossible, to obtain, at least in the time available for decision-making . Data collection and model development are activities that should be performed simultaneously.
Because software is widely available to solve linear programming programs, because these software programs can solve very large problems containing thousands of variables and constraints, and finally because there is less chance of obtaining a local “nonoptimal” solution when the problem is linear (at least in theory), there is an incentive to use linear programming to solve large optimization problems. Especially for large optimization problems, linear programming is often the only practical alternative for finding at least an approximate optimal solution. Yet models representing particular water resources systems may not be linear. This motivates the use of methods that can approximate nonlinear functions with linear ones, or the use of other search algorithms such as those discussed in Chap. 5).
The following simple groundwater supply problem illustrates the application of some linearization methods commonly applied to nonlinear separable functions—functions of only one unknown variable.
These approximation methods typically increase the number of variables and constraints in a model. Some of these methods require integer variables, or variables that can have values of only 0 or 1. There is a practical limit on the number of integer variables any linear programming software program can handle. Hence, for large models there may be a need to perform some preliminary screening designed to reduce the number of alternatives that should be considered in more detail. This example can be used to illustrate an approach to preliminary screening .
4.5.3 A Groundwater Supply Example
Consider a water-using industry that plans to obtain water from a groundwater aquifer . Two wellfield sites have been identified. The first question is how much will the water cost, and the second, given any specified amount of water delivered to the user, is how much should come from each wellfield. This situation is illustrated in Fig. 4.24.

Schematic of a potential groundwater supply system that can serve a water-using industry. The unknown variables are the flows, Q A and Q B, from each wellfield
Wells and pumps must be installed and operated to obtain water from these two wellfields. The annual cost of wellfield development will depend on the pumping capacity of the wellfield. Assume that the annual costs associated with various capacities Q A and Q B for Wellfields A and B, respectively, are as shown in Fig. 4.25. These are nonlinear functions that contain both fixed and variable costs and hence are discontinuous. The fixed costs result from the fact that some of the components required for wellfield development come in discrete sizes. As indicated in the figure, the maximum flow capacity of Wellfields A and B are 17 and 13, respectively.

Annual cost functions associated with the Wellfields A and B as shown in Fig. 4.24. The actual functions are shown on the left, and two sets of piecewise linear approximations are shown on the right
In Fig. 4.25, the nonlinear functions on the left have been approximated by piecewise linear functions on the right. This is a first step in linearizing nonlinear separable functions. Increasing the number of linear segments can reduce the difference between the piecewise linear approximation of the actual nonlinear function and the function itself. At the same time it will increase the number of variables and possibly constraints.
When approximating a nonlinear function by a series of straight lines, model developers should consider two factors. The first is just how accurate need be the approximation of the actual function for the decisions that will be made, and second is just how accurate is the actual (in this case nonlinear) function in the first place. There is little value in trying to eliminate relatively small errors caused by the linearization of a function when the function itself is highly uncertain. Most cost and benefit functions, especially those associated with future activities, are indeed uncertain.
4.5.3.1 A Simplified Model
Two sets of approximations are shown in Fig. 4.26. Consider first the approximations represented by the light blue dot-dash lines. These single straight lines are very crude approximations of each function. In this example these straight-line cost functions are lower bounds of the actual nonlinear costs. Hence, the actual costs may be somewhat higher than those identified in the solution of a model.

Using the blue dot-dash linear approximations in Fig. 4.26, the linear programming model can be written as follows:
Subject to
The expressions within the square brackets, [ ], in Eqs. 4.154 and 4.155 above represent the slopes of the dot-dash linear approximations of the cost functions. The integer 0, 1 variables are required to include the fixed costs in the model.
Solving this linear model for various values of the water demand Q provides some interesting results. Again, they are based on the dot-dash linear cost functions in Fig. 4.25. As Q increases from 0 to just under 6.8, all the water will come from the less expensive Wellfield A. For any Q from 6.8 to 13, Wellfield B becomes less expensive and all the water will come from it. For any Q greater than the capacity of Wellfield B of 13 but no greater than the capacity of Wellfield A, 17, all of it will come from Wellfield A. Because of the fixed costs, it is cheaper to use one rather than both wellfields. Beyond Q = 17, the maximum capacity of A, water needs to come from both wellfields. Wellfield B will pump at its capacity, 13, and the additional water will come from Wellfield A.
Figure 4.26 illustrates these solutions. One can understand why in situations of increasing demands for Q over time, capacity expansion modeling might be useful. One would not close down a wellfield once developed, just to achieve what would have been a least-cost solution if the existing wellfield had not been developed.
4.5.3.2 A More Detailed Model
A more accurate representation of these cost functions may change these solutions for various values of Q, although not significantly. However consider the more accurate cost minimization model that includes the red solid-line piecewise linearizations shown in Fig. 4.26.
Subject to
linear approximation of cost functions:
Q A and Q B defined.
Constraint (4.170) limits the solution to at most only the first segment or to the second and third segments of the cost function for wellfield B. Note that a 0, 1 integer variable for the fixed cost of the third segment of this function is not needed since its slope exceeds that of the second segment. However the flow, Q B3, in that segment must be bounded using the integer 0, 1 variable, I B2, associated with the second segment, as shown in the third of Eqs. 4.169.
The solution to this model, shown in Fig. 4.27, differs from the solution of the simpler model, but only in the details. Wellfield A supplies all the water for Q ≤ 4.3. For values of Q in excess of 4.3 up to 13 all the water comes from Wellfield B. For values of Q in excess of 13 up to 14.8, the capacity of Wellfield B remains at its maximum capacity of 13 and Wellfield A provides the additional amount of needed capacity over 13. As Q increases from 14.9 to 17, the capacity of Wellfield B drops to 0 and the capacity of Wellfield A increases from 14.9 to 17. For values of Q between 17 and 18 Wellfield B provides 13, its maximum capacity, and the capacity of A increases from 4 to 5. For values of Q from 18.1 to 20, Wellfield B decreases to a constant 10, and Wellfield A increases from 8.1 to 10. For values of Q from 20 to 23, Wellfield A remains at 10 and Wellfield B increases from 10 to 13. For values of Q from 23 to 27, Wellfield B again drops to a constant 10 and Wellfield A increases from 13 to 17. For values of Q in excess of 27, Wellfield A remains at its maximum capacity of 17, and Wellfield B increases from 10 to 13.

As in the previous example, this shows the effect on the least-cost solution when one cost function has relatively lower fixed and higher variable costs compared with another cost function having relatively higher fixed and lower variable costs.
4.5.3.3 An Extended Model
In this example, the simpler model (Eqs. 4.152–4.160) and the more accurate model (Eqs. 4.161–4.173) provided essentially the same allocations of wellfield capacities associated with a specified total capacity Q. If the problem contained a larger number of wellfields, the simpler (and smaller) model might have been able to eliminate some of these wellfields from further consideration. This would reduce the size of any new model that approximates the cost functions of the remaining wellfields more accurately.
The model just described, like the capacity expansion model and water quality management model , is another example of a cost-effective model. The objective was to find the least-cost way of providing a specified amount of water to a water user. It does not address the problem of planning for an increasing demand for Q over time. Clearly it makes no sense to implement the particular cost-effective solution for any value of Q, as shown in Fig. 4.27, as the demand for Q increases, as in this example, from 0 to 30. This is the capacity expansion problem, the solution of which will benefit from models that take time into account and that are not static as illustrated previously in this chapter.
Next, consider a cost–benefit analysis in which the question is just how much water should users use. To address this question we assume the user has identified the annual benefits associated with various amounts of water. The annual benefit function, B(Q), and its piecewise linear approximations, are shown in Fig. 4.28.

Benefit function of the amount of water provided to the water user. Piecewise linear approximations of that function of flow are shown on the right
The straight, blue, dot-dash linear approximation of the benefit function shown in Fig. 4.28 is an upper bound of the benefits . Incorporating it into a model that uses the dot-dash linear lower bound approximations of each cost function, as shown in Fig. 4.25 will produce an optimistic solution. It is unlikely that the value of Q that is based on more accurate and thus less optimistic benefit and cost functions will be any greater than the one identified by this simple optimistic model. Furthermore, if any wellfield is not in the solution of this optimistic model, with some care we might be able to eliminate that wellfield from further consideration when developing a more accurate model.
Any component of a water resources system that does not appear in the solution of a model that includes optimistic approximations of performance measures that are to be maximized, such as benefits, or that are to be minimized, such as costs, are candidates for omission in any more detailed model. This is an example of the process of preliminary screening.
The model defined by Eqs. 4.152–4.160 can now be modified. Equation 4.160 is eliminated and the cost minimization objective Eq. 4.152 is replaced with:
where
The solution of this model, Eqs. 4.153–4.159, 4.174, and 4.175 (plus the condition that the fixed benefit of 10 only applies if Q > 0, added because it is clear the benefits would be 0 with a Q of 0) indicates that only Wellfield B needs to be developed, and at a capacity of 10. This would suggest that Wellfield A can be omitted in any more detailed modeling exercise. To see if this assumption, in this example, is valid, consider the more detailed model that incorporates the red, solid-line linear approximations of the cost and benefit functions shown in Figs. 4.25 and 4.28.
Note that the approximation of the generally concave benefit function in Fig. 4.29 will result in negative values of the benefits for small values of Q. For example, when the flow Q, is 0 the approximated benefits are −10. Yet the actual benefits are 0 as shown in the left part of Fig. 4.28. Modeling these initial fixed benefits the same way as the fixed costs have been modeled, using another 0, 1 integer variable, would allow a more accurate representation of the actual benefits for small values of Q.
Alternatively, to save having to add another integer variable and constraint to the model, one can allow the benefits to be negative. If the model solution shows negative benefits for some small value of Q, then obviously the more preferred value of Q, and benefits, would be 0. This more approximate trial-and-error approach is often preferred in practice, especially when a model contains a large number of variables and constraints. This is the approach taken here.
4.5.3.4 Piecewise Linear Model
There are a number of ways of modeling the piecewise linear concave benefit function shown on the right side of Fig. 4.28. Several are defined in the next several sets of equations. Each method will result in the same model solution.
One approach to modeling the concave benefit function is to define a new unrestricted (possibly negative valued) variable. Let this variable be Benefits. When being maximized this variable cannot exceed any of the linear functions that bound the concave benefit function:
Since most linear programming algorithms assume the unknown variables are nonnegative (unless otherwise specified), unrestricted variables, such as Benefits, can be replaced by the difference between two nonnegative variables, such as Pben − Nben. Pben will equal Benefits if its value is greater than 0. Otherwise −Nben will equal Benefits. Thus in place of Benefits in Eqs. 4.176–4.178, and those below, one can substitute Pben − Nben.
Another modeling approach is to divide the variable Q into parts, q i , one for each segment i of the function. These parts sum to Q. Each q i , ranges from 0 to the width of the user-defined segment i. Thus for the piecewise linear benefit function shown on the right of Fig. 4.28:
and
The linearized benefit function can now be written as the sum over all three segments of each segment slope times the variable q i :
Since the function being maximized is concave (decreasing slopes as Q increases), we are assured that each q i + 1 will be greater than 0 only if q i is at its upper limit, as defined by constraint Eqs. 4.179–4.181.
A third method is to define unknown weights w i associated with the breakpoints of the linearized function. The value of Q can be expressed as the sum of a weighted combination of segment endpoint values. Similarly, the benefits associated with Q can be expressed as a weighted combination of the benefits evaluated at the segment endpoint values. The unknown weights must also sum to 1. Hence, for this example:
For this method to provide the closest approximation of the original nonlinear function, the solution must include no more than two nonzero weights and those nonzero weights must be adjacent to each other. For concave functions that are to be maximized, this condition will be met, since any other situation would yield less benefits.
The solution to the more detailed model defined by Eqs. 4.174, 4.162–4.172, and either 4.176–4.178, 4.179–4.183, or 4.184–4.186, indicates a value of 10 for Q will result in the maximum net benefits . This flow is to come from Wellfield B. This more precise solution is identical to the solution of the simpler model. Clearly the simpler model could have successfully served to eliminate Wellfield A from further consideration.
4.5.4 A Review of Linearization Methods
This section reviews the piecewise linearization methods just described and some other approaches for incorporating nonlinear conditions into linear programming models. All of these methods maintain linearity.
If-then-else conditions
There exist a number of ways “if-then-else” and “and” and “or” conditions (that is, decision trees) can be included in linear programming models. To illustrate some of them, assume X is an unknown decision variable in a model whose value may depend on the value of another unknown decision variable Y. Assume the maximum value of Y would not exceed Y max and the maximum value of X would not exceed X max. These upper bounds and all the linear constraints representing “if-then-else” conditions must not restrict the values of the original decision variable Y. Four “if-then-else” (with “and/or”) conditions are presented below using additional integer 0.1 variables, denoted by Z. All the X, Y, and Z variables in the constraints below are assumed to be unknown. These constraints would be included in the any linear programming model where the particular “if-then-else” conditions apply.
These illustrations are not unique. At the boundaries of the “if” constraints in the examples below, either of the “then” or “else” conditions can apply. All variables (X, Y) are assumed nonnegative. All variables Z are assumed to be a binary (0, 1) variables. Note the constraints are all linear.
-
(a)
\( {\text{If}}\;Y \le 50\;{\text{then}}\;X \le 10,\;{\text{else}}\;X \ge 15 . \)
Define constraints:
$$ \begin{aligned} Y & \le 50\,Z + Y_{\max} \left( { 1- Z} \right) \\ Y & \ge 50\left( { 1- Z} \right) \\ X & \le 10Z + X_{\max} \left( { 1- Z} \right) \\ X & \ge 1 5\left( { 1- Z} \right) \\ \end{aligned} $$ -
(b)
\( {\text{If}}\;Y \le 50\;{\text{then}}\;X \le Y,\;{\text{else}}\;X \ge Y. \)
Define constraints :
$$ \begin{aligned} & Y \ge 50Z \\ & Y \le 50\left( {1 - Z} \right) + Y_{\hbox{max} } Z \\ & X \le Y + X_{\hbox{max} } Z \\ & X \ge Y - Y_{\hbox{max} } \left( {1 - Z} \right) \\ \end{aligned} $$ -
(c)
\( {\text{If}}\;Y \le 20\;{\text{or}}\;Y \ge 80\;{\text{then}}\;X = 5,\;{\text{else}}\;X \ge 10. \)
Define constraints:
$$ \begin{aligned} & Y \le 20Z_{ 1} + 80Z_{ 2} + Y_{\max} \left( { 1- Z_{ 1} - Z_{ 2} } \right) \\ & Y \ge 20Z_{ 2} + 80\left( { 1- Z_{ 1} - Z_{ 2} } \right) \\ & Z_{ 1} + Z_{ 2} \le 1\\ & {X} \le 5\left( {Z_{ 1} + \left( { 1- Z_{ 1} - Z_{ 2} } \right)} \right) + X_{\max} Z_{ 2} \\ & X \ge 5 { }(Z_{ 1} + ( 1- Z_{ 1} - Z_{ 2} )) \\ & X \ge 10Z_{ 2} \\ \end{aligned} $$ -
(d)
If 20 ≤ Y ≤ 50 or 60 ≤ Y ≤ 80, then X ≤ 5, else X ≥ 10.
Define constraints:
$$ \begin{aligned} & Y \le 20Z_{ 1} + 50Z_{ 2} + 60Z_{ 3} + 80Z_{ 4} \\ & \qquad + Y_{\max}\left( { 1- Z_{ 1} - Z_{ 2} - Z_{ 3} - Z_{ 4} } \right). \\ & Y \ge 20Z_{ 2} + 50Z_{ 3} + 60Z_{ 4} \\ & \qquad + 80\left( { 1- Z_{ 1} - Z_{ 2} - Z_{ 3} - Z_{ 4} } \right) \\ & {\text{Z}}_{ 1} + {\text{Z}}_{ 2} + {\text{Z}}_{ 3} + {\text{Z}}_{ 4} \le 1\\ & X \le 5\left( {Z_{ 2} + Z_{ 4} } \right) + X_{\max}\left( { 1- Z_{ 2} - Z_{ 4} } \right) \\ & X \ge 10\left( {\left( {Z_{ 1} + Z_{ 3} } \right) + \left( { 1- Z_{ 1} - Z_{ 2} - Z_{ 3} - Z_{ 4} } \right)} \right) \\ \end{aligned} $$
Minimizing the absolute value of the difference between two unknown nonnegative variables:
Minimize |X − Y| is equivalent to
subject to
or
subject to
Minimizing the maximum or maximizing the minimum
Let the set of variables be {X 1, X 2, X 3, …, X n }, Minimizing the maximum of {X 1, X 2, X 3, …, X n } is equivalent to
subject to
Maximizing the minimum of {X 1, X 2, X 3, …, X n } is equivalent to
subject to
Linearization of convex functions for maximization or concave function for minimization involves 0, 1 binary variables.
Fixed costs in cost functions

Consider functions that have fixed components if the argument of the function is greater than 0.
To include these fixed costs in a LP model, define
Subject to
where M is the maximum value of X, and I is an unknown 0, 1 binary variable.
Minimizing convex functions or maximizing concave functions .

Subject to

Subject to

Subject to
Minimizing concave functions or maximizing convex functions

Subject to
Minimizing or maximizing combined concave–convex functions

Subject to
Subject to

Subject to
Subject to

Maximize or Minimize F(X)
Subject to
4.6 A Brief Review
Before proceeding to other optimization and simulation methods in the following chapters, it may be useful to review the topics covered so far. The focus has been on model development as well as model solution. Several types of water resources planning and management problems have been used to illustrate model development and solution processes. Like their real-world counterparts, the example problems all had multiple unknown decision variables and multiple constraints. Also like their real-world counterparts, there are multiple feasible solutions to each of these problems. Hence, the task is to find the best solution, or a number of near-best solutions. Each solution must satisfy all the constraints .
Constraints can reflect physical conditions, environmental regulations and/or social or economic targets . Especially with respect to environmental or social conditions and goals, it is often a matter of judgment to decide what is considered an objective that is to be minimized or maximized and what is considered a constraint that has to be met. For example, do we minimize the costs of meeting specified maximum levels of pollutant concentrations or minimize pollutant concentrations without exceeding specified costs?
Except for relatively simple problems, the use of these optimization models and methods is primarily for reducing the number of alternatives that need to be further analyzed and evaluated using simulation methods . Optimization is generally used for preliminary screening —eliminating inferior alternatives before more detailed analyses are carried out. Presented were some approaches to preliminary screening involving hill-climbing, calculus-based Lagrange multiplier , numerical nonlinear programming, discrete dynamic programming, and linear programming methods. Each method has its strengths and limitations. Both linear and nonlinear programming models are typically solved using software packages. Many of these software programs are free and readily available. But before any model can be solved, it has to be built. Building models is an art and that is what this chapter has attempted to introduce.
The example problems used to illustrate these modeling and model solution methods have been relatively simple. However, simple applications such as these can form the foundation of models of more complex problems, as will be shown in following chapters.
Reference
Bellman, R. E. (1957). Dynamic programming. Princeton, NJ: Princeton University Press.
Additional References (Further Reading)
Bassson, M. S., Allen, R. B., Pegram, G. G. S., & Van Rooyen, J. A. (1994). Probabilistic management of water resource and hydropower systems. Highlands Ranch, CO: Water Resources Publications.
Beroggi, G. E. G. (1999). Decision modeling in policy management: An introduction to analytic concepts. Boston, MA: Kluwer Academic.
Blanchard, B. S., & Fabrycky, W. J. (1998). Systems engineering and analysis (3rd ed.). Prentice Hall: Upper Saddle River, NJ.
Buras, N. (1966). Dynamic programming and water resources development, advances in hydroscience (Vol. 3). New York: Academic Press.
Dorfman, R., Jacoby, H. D., & Thomas, H. A., Jr. (1972). Models for managing regional water quality. Cambridge, MA: Harvard University Press.
Esogbue, A. O. (Ed.). (1989). Dynamic programming for optimal water resources systems analysis. Prentice Hall: Englewood Cliffs, NJ.
Hall, W. A., & Dracup, J. A. (1970). Water resources systems engineering. New York: McGraw-Hill.
Hillier, F. S., & Lieberman, G. J. (1990a). Introduction to operations research (5th ed.). New York: McGraw-Hill.
Hillier, F. S., & Lieberman, G. J. (1990b). Introduction to stochastic models in operations research. New York: McGraw-Hill.
Hufschmidt, M. M., & Fiering, M. B. (1966). Simulation techniques for design of water-resource systems. Cambridge, MA: Harvard University Press.
Kapamoyz, M., Szidarovszky, F., & Zahpaie, B. (2003). Water resources systems analysis. Boca Raton, FL: Lewis.
Loucks, D. P., & da Costa, J. R. (Eds.). (1990). Decision support systems: water resources planning. Berlin: Springer.
Loucks, D. P., Stedinger, J. S., & Haith, D. A. (1981). Water resource systems planning and analysis. Prentice Hall: Englewood Cliffs, NJ.
Maass, A., Hufschmidt, M. M., Dorfman, R., Thomas, H. A., Jr., Marglin, S. A., & Fair, G. M. (1962). Design of water-resource systems. Cambridge, MA: Harvard University Press.
Major, D. C., & Lenton, R. L. (1979). Applied water resources systems planning. Prentice Hall: Englewood Cliffs, NJ.
Mays, L. W., & Tung, Y.-K. (1992). Hydrosystems engineering and management. New York: McGraw-Hill.
Newnan, D. G., Lavelle, J. P., & Eschenbach, T. G. (2002). Essentials of engineering economic analysis (2nd ed.). New York: Oxford University Press.
Rardin, R. L. (1998). Optimization in operations research. Prentice Hall: Upper Saddle River, NJ.
Revelle, C. (1999). Optimizing reservoir resources. New York: Wiley.
Somlyody, L. (1997). Use of optimization models in river basin water quality planning: WATERMATEX’97. In M. B. Beck & P. Lessard (Eds.), Systems analysis and computing in water quality management: Towards a new agenda. London: IWA.
Taylor, B. W., III. (1999). Introduction to management science (6th ed.). Prentice Hall: Upper Saddle River, NJ.
Willis, R., & Yeh, W. W.-G. (1987). Groundwater systems planning and management. Prentice Hall: Englewood Cliffs, NJ.
Winston, W. L. (1994). Operations research: Applications and algorithms (3rd edn.). Boston, MA: Duxbury.
Winston, W. L., & Albright, S. C. (2001). Practical management science (2nd edn.). Pacific Grove, CA: Duxbury.
Wright, J. R., & Houck, M. H. (1995). Water resources planning and managementm, Chap. 37. In W. F. Chen (Ed.), Civil engineering handbook. Boca Raton: CRC.
Wurbs, R. A. (1996). Modeling and analysis of reservoir system operations. Prentice Hall: Upper Saddle River, NJ.
Author information
Authors and Affiliations
Corresponding authors
Exercises
Exercises
Engineering economics:
-
4.1
Consider two alternative water resource projects, A and B. Project A will cost $2,533,000 and will return $1,000,000 at the end of 5 years and $4,000,000 at the end of 10 years. Project B will cost $4,000,000 and will return $2,000,000 at the end of 5 and 15 years, and another $3,000,000 at the end of 10 years. Project A has a life of 10 years, and B has a life of 15 years. Assuming an interest rate of 0.1 (10%) per year:
-
(a)
What is the present value of each project?
-
(b)
What is each project’s annual net benefit?
-
(c)
Would the preferred project differ if the interest rates were 0.05?
-
(d)
Assuming that each of these projects would be replaced with a similar project having the same time stream of costs and returns, show that by extending each series of projects to a common terminal year (e.g., 30 years), the annual net benefits of each series of projects will be same as found in part (b).
-
(a)
-
4.2
Show that A \( \sum\nolimits_{t = 1}^{T} {(1 + r)^{ - t} }= \frac{{(1 + r)^{T} - 1}}{{r(1 + r)^{T} }} \) A , the present value of a series of equal payments, A, at the end of each year for T years. What is the impact of an increasing interest rate over time on the present value?
-
4.3
-
(a)
Show that if compounding occurs at the end of m equal length periods within a year in which the nominal interest rate is r, then the effective annual interest rate, r′, is equal to
$$ r^{\prime } = \left( {1 + \frac{r}{m}} \right)^{m} - 1 $$ -
(b)
Show that when compounding is continuous (i.e., when the number of periods m → ∞), the compound interest factor required to convert a present value to a future value in year T is e rT. [Hint: Use the fact that \( \mathop {\lim }\limits_{k \to \infty } (1 + 1/k)^{k} = e \), the base of natural logarithms.]
-
(a)
-
4.4
The term “capitalized cost” refers to the present value PV of an infinite series of end-of-year equal payments, A. Assuming an interest rate of r, show that as the terminal period T → ∞, PV = A/r.
-
4.5
The internal rate of return of any project or plan is the interest rate that equals the present value of all receipts or income with the present value of all costs. Show that the internal rate of return of projects A and B in Exercise 4.1 are approximately 8 and 6%, respectively. These are the interest rates r, for each project, that essentially satisfy the equation
$$ \sum\limits_{t = 0}^{T} {\left( {R_{t} - C_{t} } \right)} (1 + r)^{ - t} = 0 $$ -
4.6
In Exercise 4.1, the maximum annual benefits were used as an economic criterion for plan selection. The maximum benefit–cost ratio, or annual benefits divided by annual costs , is another criterion. Benefit–cost ratios should be no less than one if the annual benefits are to exceed the annual costs. Consider two projects, I and II:
Project
I
II
Annual benefits
20
2
Annual costs
18
1.5
Annual net benefits
2
0.5
Benefit–cost ratio
1.11
1.3
What additional information is needed before one can determine which project is the most economical project?
-
4.7
Bonds are often sold to raise money for water resources project investments . Each bond is a promise to pay a specified amount of interest, usually semiannually, and to pay the face value of the bond at some specified future date. The selling price of a bond may differ from its face value. Since the interest payments are specified in advance, the current market interest rates dictate the purchase price of the bond.
Consider a bond having a face value of $10,000, paying $500 annually for 10 years. The bond or “coupon” interest rate based on its face value is 500/10,000, or 5%. If the bond is purchased for $10,000, the actual interest rate paid to the owner will equal the bond or “coupon” rate . But suppose that one can invest money in similar quality (equal risk) bonds or notes and receive 10% interest. As long as this is possible, the $10,000, 5% bond will not sell in a competitive market. In order to sell it, its purchase price has to be such that the actual interest rate paid to the owner will be 10%. In this case, show that the purchase price will be $6927.
The interest paid by the some bonds, especially municipal bonds, may be exempt from state and federal income taxes. If an investor is in the 30% income tax bracket, for example, a 5% municipal tax-exempt bond is equivalent to about a 7% taxable bond. This tax exemption helps reduce local taxes needed to pay the interest on municipal bonds, as well as providing attractive investment opportunities to individuals in high tax brackets.
Lagrange Multipliers
-
4.8
What is the meaning of the Lagrange multiplier associated with the following model?
$$ \begin{array}{*{20}l} {\text{Maximize}} & {{Benefit}\left( X \right) - {\text{Cost}}\left( X \right)} \\ {\text{Subject to}}{:} & {X \le 2 3} \\ \end{array} $$ -
4.9
Assume water can be allocated to three users. The allocation, x j , to each use j provides the following returns: R(x 1) = (12x 1 − x 21 ), R(x 2) = (8x 2 − x 22 ) and R(x 3) = (18x 3 − 3x 23 ). Assume that the objective is to maximize the total return, F(X), from all three allocations and that the sum of all allocations cannot exceed 10. (a) How much would each use like to have? (b) Show that at the maximum total return solution the marginal values, ∂(R(x j ))/∂x j , are each equal to the shadow price or Lagrange multiplier (dual variable) λ associated with the constraint on the amount of water available. (c) Finally, without resolving a Lagrange multiplier problem, what would the solution be if 15 units of water were available to allocate to the three users and what would be the value of the Lagrange multiplier?
-
4.10
In Exercise 4.9, how would the Lagrange multiplier procedure differ if the objective function, F(X), were to be minimized?
-
4.11
Assume that the objective was to minimize the sum of squared deviations of the actual allocations x j from some desired or known target allocations T j . Given a supply of water Q less than the sum of all target allocations T j , structure a planning model and its corresponding Lagrangian. Will a global minimum be obtained from solving the partial differential equations derived from the Lagrangian? Why?
-
4.12
Using Lagrange multipliers , prove that the least-cost design of a cylindrical storage tank of any volume V > 0 has one-third of its cost in its base and top and two-thirds of its cost in its side, regardless of the cost per unit area of its base or side. (It is these types of rules that end up in handbooks in engineering design .)
-
4.13
An industrial firm makes two products, A and B. These products require water and other resources. Water is the scarce resource—they have plenty of other needed resources. The products they make are unique, and hence they can set the unit price of each product at any value they want to. However experience tells them that the higher the unit price for a product, the less amount of that product they will sell. The relationship between unit price and quantity that can be sold is given by the following two demand functions . Assume for simplicity that the unit price for product A is (8 − A) and for product B is (6 − 1.5B).
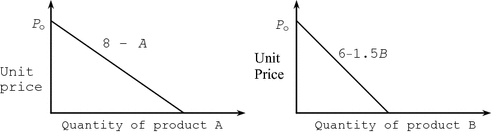
-
(a)
What are the amounts of A and B, and their unit prices, that maximize the total revenue obtained?
-
(b)
Suppose the total amount of A and B could not exceed some amount T max. What are the amounts of A and B, and their unit prices, that maximize total revenue, if
-
(i)
T max = 10
-
(ii)
T max = 5
Water is needed to make each unit of A and B. The production functions relating the amount of water X A needed to make A, and the amount of water X B needed to make B, are A = 0.5X A , and B = 0.25X B , respectively.
-
(i)
-
(c)
Find the amounts of A and B and their unit prices that maximize total revenue assuming the total amount of water available is 10 units.
-
(d)
What is the value of the dual variable, or shadow price, associated with the 10 units of available water?
Dynamic programming
-
(a)
-
4.14
Solve for the optimal integer allocations x 1, x 2, and x 3 for the problem defined by Exercise 4.9 assuming the total available water is 3 and 4. Also solve for the optimal allocation policy if the total water available is 7 and each x j must not exceed 4.
-
4.15
Consider a three-season reservoir operation problem. The inflows are 10, 50 and 20 in seasons 1, 2, and 3, respectively. Find the operating policy that minimizes the sum of total squared deviations from a constant storage target of 20 and a constant release target of 25 in each of the three seasons. Develop a discrete dynamic programming model that considers only 4 discrete storage values: 0, 10, 20 and 30. Assume the releases cannot be less than 10 or greater than 40. Show how the model’s recursive equations change depending on whether the decisions are the releases or the final storage volumes. Verify the optimal operating policy is the same regardless of whether the decision variables are the releases or the final storage volumes in each period. Which model do you think is easier to solve? How would each model change if more importance were given to the desired releases than to the desired storage volumes?
-
4.16
Show that the constraint limiting a reservoir release, r t , to be no greater than the initial storage volume, s t , plus inflow, i t , is redundant to the continuity equation s t + i t − r t = s t+1.
-
4.17
Develop a general recursive equation for a forward-moving dynamic programming solution procedure for a single reservoir-operating problem. Define all variables and functions used. Why is this not a very useful approach to finding a reservoir-operating policy?
-
4.18
The following table provides estimates for the recent values of the costs of additional wastewater treatment plant capacity needed at the end of each 5-year period for the next 20 years. Find the capacity expansion schedule that minimizes the present values of the total future costs. If there is more than one least-cost solution, indicate which one you think is better, and why?
Discounted cost of additional capacity
Total required capacity at end of period
Units of additional capacity
Period years
2
4
6
8
10
1
1–5
12
15
18
23
26
2
2
6–10
8
11
13
15
6
3
11–15
6
8
8
4
16–20
4
10
The cost in each period t must be paid at the beginning of the period. What was the discount factor used to convert the costs at the beginning of each period t to present value costs shown above? In other words how would a cost at the beginning of period t be discounted to the beginning of period 1, given an annual interest rate of r? (Only the algebraic expression of the discount factor is asked, not the numerical value of r.)
-
4.19
Consider a wastewater treatment plant in which it is possible to include five different treatment processes in series. These treatment processes must together remove at least 90% of the 100 units of influent waste. Assuming the R i is the amount of waste removed by process i, the following conditions must hold:
$$ \begin{aligned} & 20 \le {R}_{ 1} \le 30 \\ & 0 \le {R}_{ 2} \le 30 \\ & 0 \le {R}_{ 3} \le 10 \\ & 0 \le {R}_{ 4} \le 20 \\ & 0 \le {R}_{ 5} \le 30 \\ \end{aligned} $$-
(a)
Write the constrained optimization-planning model for finding the least-cost combination of the removals R i that together will remove 90% of the influent waste. The cost of the various discrete sizes of each unit process i depend upon the waste entering the process i as well as the amount of waste removed, as indicated in the table below.
Process i
1
2
3
4
5
Influent, I i
Removal, R i
Annual cost = C i (I i , R i )
100
20
5
100
30
10
80
10
3
3
1
80
20
9
2
80
30
13
70
10
4
5
2
70
20
10
3
70
30
15
60
10
6
2
3
60
20
4
6
60
30
9
50
10
7
3
4
50
20
5
8
50
30
10
40
10
8
5
5
40
20
7
12
40
30
18
30
10
8
8
30
20
10
12
20
10
8
-
(b)
Draw the dynamic programming network and solve this problem by dynamic programming. Indicate on the network the calculations required to find the least-cost path from state 100 at stage 1 to state 10 at stage 6 using both forward- and backward-moving dynamic programming solution procedures.
-
(c)
Could the following conditions be included in the original dynamic programming model and still be solved without requiring R 4 to be 0 in the first case and R 3 to be 0 in the second case?
-
(i)
R 4 = 0 if R 3 = 0, or
-
(ii)
R 3 = 0 if R 2 ≤ 20.
-
(i)
-
(a)
-
4.20
The city of Eutro Falls is under a court order to reduce the amount of phosphorus that which it discharges in its sewage to Lake Algae. The city presently has three wastewater treatment plants. Each plant i currently discharges P i kg/day of phosphorus into the lake. Some or all plants must reduce their discharges so that the total for the three plants does not exceed P kg/day.
Let X i be the fraction or percent of the phosphorus removed by additional treatment at plant i, and the C i (X i ) the cost of such treatment ($/year) at each plant i.
-
(a)
Structure a planning model to determine the least-cost (i.e., a cost effective ) treatment plant for the city.
-
(b)
Restructure the model for the solution by dynamic programming. Define the stages, states, decision variables, and the recursive equation for each stage.
-
(c)
Now assume P 1 = 20; P 2 = 15; P 3 = 25; and P = 20. Make up some cost data and check the model if it works.
-
(a)
-
4.21
Find (draw) a rule curve for operating a single reservoir that maximizes the sum of the benefits for flood control, recreation, water supply and hydropower. Assume the average inflows in four seasons of a year are 40, 80 60, 20, and the active reservoir capacity is 100. For an average storage S and for a release of R in a season, the hydropower benefits are 2 times the square root of the product of S and R, 2(SR)0.5, and the water supply benefits are 3R 0.7 in each season. The recreation benefits are 40 − (70 − S)2 in the third season. The flood control benefits are 20 − (40 − S)2 in the second season. Specify the dynamic programming recursion equations you are using to solve the problem.
-
4.22
How would the model defined in Exercise 4.21 change if there were a water user upstream of this reservoir and you were to find the best water-allocation policy for that user, assuming known benefits associated with these allocations that are to be included in the overall maximum benefits objective function?
-
4.23
Suppose there are four water users along a river who benefit from receiving water from the river. Each has a water target , i.e., each expects and plans for a specified amount. These known water targets are W(1), W(2), W(3), and W(4) for the four users, respectively. Show how dynamic programming can be used to find two allocation policies. One is to be based on minimizing the maximum deficit deviation from any target allocation. The other is to be based on minimizing the maximum percentage deficit from any target allocation.
Gradient “Hill-climbing” methods
-
4.24
Solve Exercise 4.13(b) using hill-climbing techniques and assuming discrete integer values and T max = 5. For example, which product would you produce if you could make only 1 unit of either A or B? If you could make another unit of A or B, which would you make? Continue this process up to 5 units of products A and/or B.
-
4.25
Under what conditions will hill-climbing methods for maximization or minimization not work?
Linear and nonlinear programming
-
4.26
Consider the industrial firm that makes two products A and B as described in Exercise 4.13(b). Using Lingo (or any other program you wish):
-
(a)
Find the amounts of A and B and their unit prices that maximize total revenue assuming the total amount of water available is 10 units.
-
(b)
What is the value of the dual variable, or shadow price, associated with the 10 units of available water?
-
(c)
Suppose the demand functions are not really certain. How sensitive are the allocations of water to changes in the parameter values of those functions? How sensitive are the allocations to the parameter values in the production functions?
-
(a)
-
4.27
Assume that there are m industries or municipalities that discharge their wastes into a river. Denote the discharge sites by the subscript i and let W i be the kg of waste discharged into the river each day at those sites i. To improve the river water quality downstream, wastewater treatment plants may be required at each site i. Let x i be the fraction of waste removed by treatment at each site i. Develop a model for estimating how much waste removal is required at each site to maintain acceptable water quality in the river at a minimum total cost. Use the following additional notation:
- a ij :
-
decrease in quality at site j per unit of waste discharged at site i
- q j :
-
quality at site j that would result if all controlled upstream discharges were eliminated (i.e., W 1 = W 2 = 0)
- Q j :
-
minimum acceptable quality at site j
- C i :
-
cost per unit (fraction) of waste removed at site i.
-
4.28
Assume that there are two sites along a stream, i = 1, 2, at which waste (BOD) is discharged. Currently, without any wastewater treatment , the quality (DO), q 2 and q 3, at each of sites 2 and 3 is less than the minimum desired, Q 2 and Q 3, respectively. For each unit of waste removed at site i upstream of site j, the quality improves by A ij . How much treatment is required at sites 1 and 2 that meets the standards at a minimum total cost?
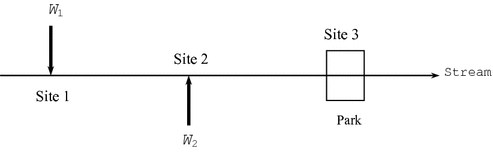
Following are the necessary data:
- C i :
-
cost per unit fraction of waste treatment at site i (both C 1 and C 2 are unknown but for the same amount of treatment, whatever that amount, C 1 > C 2)
- R i :
-
decision variables, unknown waste removal fractions at sites i = 1, 2
$$ \begin{array}{*{20}l} {{A}_{ 1 2} = { 1}/ 20} \hfill & {{W}_{ 1} = 100} \hfill & {{Q}_{ 2} = { 6}} \hfill \\ {{A}_{ 1 3} = { 1}/ 40} \hfill & {{W}_{ 2} = { 75}} \hfill & {{Q}_{ 3} = { 4}} \hfill \\ {{A}_{ 2 3} = { 1}/ 30} \hfill & {{q}_{ 2} = { 3}} \hfill & {{q}_{ 3} = { 1}} \hfill \\ \end{array} $$
-
4.29
Define a linear programming model for finding the tradeoff between active storage capacity and the maximum percentage deviation from a known target storage volume and a known target release in each period. How could the solution of the model be used to define a reservoir policy?
-
4.30
Consider the possibility of building a reservoir upstream of three demand sites along a river.

The net benefits derived from each use depend on the reliable amounts of water allocated to each use. Letting x it be the allocation to use i in period t, the net benefits for each period t equal
-
1.
6x 1t − x 21t
-
2.
7x 2t − 1.5x 22t
-
3.
8x 3t − 0.5x 23t
Assume the average inflows to the reservoir in each of four seasons of the year equal 10, 2, 8, 12.
-
(a)
Find the tradeoff between the yield (the expected release that can be guaranteed in each season) and the reservoir capacity .
-
(b)
Find the tradeoff between the yield and the maximum total net benefits that can be obtained from allocating that yield among the three users.
-
(c)
Find the tradeoff between the reservoir capacity and the total net benefits one can obtain from allocating the total releases, not just the reliable yield, to the downstream users.
-
(d)
Assuming a reservoir capacity of 7, and dividing the release into integer increments of 2 (i.e., 2, 4, 6 and 8), using linear programming, find the optimal operating policy . Assume the maximum release cannot exceed 8, and the minimum release cannot be less than 2. How does this solution differ from that obtained using dynamic programming?
-
(e)
If you were maximizing the total net benefit obtained from the three users and if the water available to allocate to the three users were 15 in a particular time period, what would be the value of the Lagrange multiplier or dual variable associated with the constraint that you cannot allocate more than 15 to the three uses?
-
(f)
There is the possibility of obtaining recreational benefits in seasons 2 and 3 from reservoir storage. No recreational benefits can occur in seasons 1 and 4. To obtain these benefits facilities must be built, and the question is at what elevation (storage volume) should they be built. This is called the recreational storage volume target. Recreational benefits in each recreation season equal 8 per unit of storage target if the actual storage equals the storage target. If the actual storage is less than the target the losses are 12 per unit deficit—the difference between the target and actual storage volumes. If the actual storage volume is greater than the target volume the losses are 4 per unit excess. What is the reservoir capacity and recreation storage target that maximizes the annual total net benefits obtained from downstream allocations and recreation in the reservoir less the annual cost of the reservoir, 3K 1.5, where K is the reservoir capacity?
-
(g)
In (f) above, suppose the allocation benefits and net recreation benefits were given weights indicating their relative importance. What happens to the relationship between capacity K and recreation target as the total allocation benefits are given a greater weight in comparison to recreation net benefits?
-
1.
-
4.31
Using the network representation of the wastewater treatment plant design problem defined in Exercise 4.19, write a linear programming model for defining the least-cost sequence of unit treatment process (i.e., the least-cost path through the network). [Hint: Let each decision variable x ij indicate whether or not the link between nodes (or states) i and j connecting two successive stages is on the least-cost or optimal path. The constraints for each node must ensure that what enters the node must also leave the node.]
-
4.32
Two types of crops can be grown in particular irrigation area each year. Each unit quantity of crop A can be sold for a price P A and requires W A units of water, L A units of land , F A units of fertilizer, and H A units of labor. Similarly, crop B can be sold at a unit price of P B and requires W B , L B , F B and H B units of water, land, fertilizer, and labor, respectively, per unit of crop. Assume that the available quantities of water, land, fertilizer, and labor are known, and equal W, L, F, and H, respectively.
-
(a)
Structure a linear programming model for estimating the quantities of each of the two crops that should be produced in order to maximize total income.
-
(b)
Solve the problem graphically, using the following data:
Requirements per unit of
Resource
Crop A
Crop B
Maximum available resources
Water
2
3
60
Land
5
2
80
Fertilizer
3
2
60
Labor
1
2
40
Unit price
30
25
-
(c)
Define the meaning of the dual variables, and their values, associated with each constraint.
-
(d)
Write the dual model of this problem and interpret its objective and constraints.
-
(e)
Solve the primal and dual models using an existing computer program, and indicate the meaning of all output data.
-
(f)
Assume that one could purchase additional water, land, fertilizer, and labor with capital that could be borrowed from a bank at an annual interest rate r. How would this opportunity alter the linear programming model? The objective continues to be a maximization of net income. Assume there is a maximum limit on the amount of money that can be borrowed from the bank.
-
(g)
Assume that the unit price P j of crop j is a decreasing linear function (\( P_{j}^{o} {-}b_{j} x_{j} \)) of the quantity, x j , produced. How could the linear model be restructured also as to identify not only how much of each crop to produce, but also the unit price at which each crop should be sold in order to maximize total income?
-
(a)
-
4.33
Using linear programming model, derive an annual storage-yield function for a reservoir at a site having the following record of annual flows:
Year y
Flow Q y
Year y
Flow Q y
1
5
9
3
2
7
10
6
3
8
11
8
4
4
12
9
5
3
13
3
6
3
14
4
7
2
15
9
8
1
-
(a)
Find the values of the storage capacity required for yields of 2, 3, 3.5, 4, 4.5, and 5.
-
(b)
Develop a flow chart defining a procedure for finding the yields for various increasing values of K.
-
(a)
-
4.34
Water resources planning usually involves a set of separate tasks. Let the index i denote each task, and H i the set of tasks that immediately precede task i. The duration of each task i is estimated to be d i .
-
(a)
Develop a linear programming model to identify the starting times of tasks that minimizes the time, T, required to complete the total planning project.
-
(b)
Apply the general model to the following planning project:
- Task A::
-
Determine planning objectives and stakeholder interests . Duration: 4 months.
- Task B::
-
Determine structural and nonstructural alternatives that will influence objectives. Duration: 1 month.
- Task C::
-
Develop an optimization model for preliminary screening of alternatives and for estimating tradeoffs among objectives. Duration: 1 month.
- Task D::
-
Identify data requirements and collect data. Duration: 2 months.
- Task E::
-
Develop a data management system for the project. Duration: 3 months.
- Task F::
-
Develop an interactive shared vision simulation model with the stakeholdes . Duration: 2 Months.
- Task G::
-
Work with stakeholders in an effort to come to a consensus (a shared vision) of the best plan. Duration: 4 months.
- Task H::
-
Prepare, present and submit a report. Duration: 2 months.
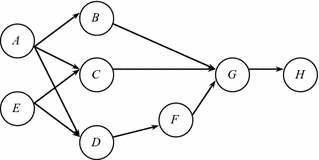
-
(a)
-
4.35
In Exercise 4.34 suppose the project is penalized if its completion time exceeds a target T. The difference between 14 months and T months is Δ, and the penalty is P(Δ). You could reduce the time it takes to complete task E by one month at a cost of $200, and by two months at a cost of $500. Similarly, suppose the cost of task A could be reduced by a month at a cost of $600 and two months at a cost of $1400. Construct a model to find the most economical project completion time. Next modify the linear programming model to find the minimum total added cost if the total project time is to be reduced by 1 or 2 months. What is that added cost and for which tasks?
-
4.36
Solve the reservoir operation problem described in Exercise 4.15 using linear programming. If the reservoir capacity is unknown, show how a cost function (that includes fixed costs and economies of scale ) for the reservoir capacity could be included in the linear programming model.
-
4.37
An upstream reservoir could be built to serve two downstream users. Each user has a constant water demand target . The first user’s target is 30; the second user’s target is 50. These targets apply to each of 6 within-year seasons. Find the tradeoff between the required reservoir capacity and maximum deficit to any user at any time, for an average year. The average flows into the reservoir in each of the six successive seasons are: 40, 80, 100, 130, 70, 50.
-
4.38
Two groundwater well fields can be used to meet the water demands of a single user. The maximum capacity of the A well field is 15 units of water per period, and the maximum capacity of the B well field is 10 units of water per period. The annual cost of building and operating each well field, each period, is a function of the amount of water pumped and transported from that well field. Three sets of cost functions are shown below: Construct a LP model and use it to define and then plot the total least-cost function and the associated individual well field capacities required to meet demands from 0 to 25, assuming cost functions 1 and 2 apply to well fields A and B, respectively. Next define another least-cost function and associated capacities assuming cost functions 3 and 4 apply to A and B, respectively. Finally define a least-cost function and associated capacities assuming well field cost functions 5 and 6 apply. You can check your model results just using common sense—the least-cost functions should be obvious, even without using optimization.
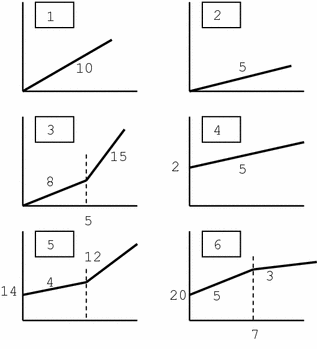
-
4.39
Referring to Exercise 4.38 above, assume cost functions 5 and 6 represent the cost of adding additional capacity to well fields A and B, respectively, in any of the next five 5-year construction periods, i.e., in the next 25 years. Identify and plot the least-cost capacity expansion schedule (one that minimizes the total present value of current and future expansions), assuming demands of 5, 10, 15, 20 and 25 are to be met at the end of years 5, 10, 15, 20 and 25, respectively. Costs , including fixed costs , of capacity expansion in each construction period have to be paid at the beginning of the construction period. Determine the sensitivity of your solution to the interest rate used to compute present value .
-
4.40
Consider a crop production problem involving three types of crops . How many hectares of each crop should be planted to maximize total income?
Resources
Max limits
Resource requirements
Crops:
Corn
Wheat
Oats
Water
1000/week
3.0
1.0
1.5
units/week/ha
Labor
300/week
0.8
0.2
0.3
person h/week/ha
Land
625 ha
Yield $/ha
400
200
250


Show a graph that identifies the tradeoffs among crops that can be made without reducing the total income.
-
4.41
Releases from a reservoir are used for water supply or for hydropower. The benefit per unit of water allocated to hydropower is BH and the benefit per unit of water allocated to water supply is BW. For any given release the difference between the allocations to the two uses cannot exceed 50% of the total amount of water available. Show graphically how to determine the most profitable allocation of the water for some assumed values of BH and BW. From the graph identify which constraints are binding and what their “dual prices” mean (in words).
-
4.42
Suppose there are four water users along a river who benefit from receiving water. Each has a known water target , i.e., each expects and plans for a specified amount. These known water targets are W 1, W 2, W 3, and W 4 for the four users, respectively. Find two allocation policies. One is to be based on minimizing the maximum deficit deviation from any target allocation. The other is to be based on minimizing the maximum percentage deficit from any target allocation.
Deficit allocations are allocations that are less than the target allocation. For example if a target allocation is 30 and the actual allocation is 20, the deficit is 10. Water in excess of the targets can remain in the river. The policies are to indicate what the allocations should be for any particular river flow Q. The policies can be expressed on a graph showing the amount of Q on the horizontal axis, and each user’s allocation on the vertical axis.
Create the two optimization models that can be used to find the two policies and indicate how they would be used to define the policies. What are the unknown variables and what are the known variables? Specify the model in words as well as mathematically.
-
4.43
In Indonesia there exists a wet season followed by a dry season each year. In one area of Indonesia all farmers within an irrigation district plant and grow rice during the wet season. This crop brings the farmer the largest income per hectare; thus they would all prefer to continue growing rice during the dry season. However, there is insufficient water during the dry season to irrigate all 5000 ha of available irrigable land for rice production. Assume an available irrigation water supply of 32 × 106 m3 at the beginning of each dry season, and a minimum requirement of 7000 m3/ha for rice and 1800 m3/ha for the second crop.
-
(a)
What proportion of the 5000 ha should the irrigation district manager allocate for rice during the dry season each year, provided that all available hectares must be given sufficient water for rice or the second crop ?
-
(b)
Suppose that crop production functions are available for the two crops, indicating the increase in yield per hectare per m3 of additional water, up to 10, 000 m3/ha for the second crop. Develop a model in which the water allocation per hectare, as well as the hectares allocated to each crop, is to be determined, assuming a specified price or return per unit of yield of each crop. Under what conditions would the solution of this model be the same as in part (a)?
-
(a)
-
4.44
Along the Nile River in Egypt, irrigation farming is practiced for the production of cotton, maize, rice, sorghum, full and short berseem for animal production, wheat, barley, horsebeans, and winter and summer tomatoes. Cattle and buffalo are also produced, and together with the crops that require labor, water. Fertilizer, and land area (feddans). Farm types or management practices are fairly uniform, and hence in any analysis of irrigation policies in this region this distinction need not be made. Given the accompanying data develop a model for determining the tons of crops and numbers of animals to be grown that will maximize (a) net economic benefits based on Egyptian prices, and (b) net economic benefits based on international prices. Identify all variables used in the model.
Known parameters:
- \( C_{i} \) :
-
miscellaneous cost of land preparation per feddan
- \( P_{i}^{\text{E}} \) :
-
Egyptian price per 1000 tons of crop i
- \( P_{i}^{\text{I}} \) :
-
international price per 1000 tons of crop i
- \( v \) :
-
value of meat and dairy production per animal
- \( g \) :
-
annual labor cost per worker
- \( f^{P} \) :
-
cost of P fertilizer per ton
- \( f^{N} \) :
-
cost of N fertilizer per ton
- \( Y_{i} \) :
-
yield of crop i, tons/feddan
- \( \alpha \) :
-
feddans serviced per animal
- \( \beta \) :
-
tons straw equivalent per ton of berseem carryover from winter to summer
- \( r^{\text{w}} \) :
-
berseem requirements per animal in winter
- \( s^{\text{wh}} \) :
-
straw yield from wheat, tons per feddan
- \( s^{\text{ba}} \) :
-
straw yield from barley, tons per feddan
- \( r^{\text{s}} \) :
-
straw requirements per animal in summer
- \( \mu_{i}^{N} \) :
-
N fertilizer required per feddan of crop i
- \( \mu_{i}^{P} \) :
-
P fertilizer required per feddan of crop i
- \( l_{\text{im}} \) :
-
labor requirements per feddan in month m, man-days
- \( w_{\text{im}} \) :
-
water requirements per feddan in month m, 1000 m3
- \( h_{\text{im}} \) :
-
land requirements per month, fraction (1 = full month)
Required Constraints (assume known resource limitations for labor, water, and land):
-
(a)
Summer and winter fodder (berseem) requirements for the animals.
-
(b)
Monthly labor limitations.
-
(c)
Monthly water limitations.
-
(d)
Land availability each month.
-
(e)
Minimum number of animals required for cultivation.
-
(f)
Upper bounds on summer and winter tomatoes (assume these are known).
-
(g)
Lower bounds on cotton areas (assume this is known).
Other possible constraints:
-
(a)
Crop balances.
-
(b)
Fertilizer balances.
-
(c)
Labor balance.
-
(d)
Land balance.
-
4.45
In Algeria there are two distinct cropping intensities, depending upon the availability of water. Consider a single crop that can be grown under intensive rotation or extensive rotation on a total of A hectares. Assume that the annual water requirements for the intensive rotation policy are 16,000 m3 per ha, and for the extensive rotation policy they 4000 m3 per ha. The annual net production returns are 4000 and 2000 dinars, respectively. If the total water available is 320,000 m3, show that as the available land area A increases, the rotation policy that maximizes total net income changes from one that is totally intensive to one that is increasingly extensive.
Would the same conclusion hold if instead of fixed net incomes of 4000 and 2000 dinars per hectares of intensive and extensive rotation, the net income depended on the quantity of crop produced? Assuming that intensive rotation produces twice as much produced by extensive rotation, and that the net income per unit of crop Y is defined by the simple linear function 5 − 0.05 Y, develop and solve a linear programming model to determine the optimal rotation policies if A equals 20, 50, and 80. Need this net income or price function be linear to be included in a linear programming model?
-
4.46
Current stream quality is below desired minimum levels throughout the stream in spite of treatment at each of the treatment plant and discharge sites shown below. Currently effluent standards are not being met, and minimum desired streamflow concentrations can be met by meeting effluent standards. All current wastewater discharges must undergo additional treatment. The issue is where additional treatment is to occur and how much.
Develop a model to identify cost-effective options for meeting effluent standards where ever wastewater is discharged into the stream. The decisions variables include the amount of wastewater to treat at each site and then release to the river. Any wastewater at any site that is not undergoing additional treatment can be piped to other sites. Identify other issues that could affect the eventual decision.

-
Assume known current wastewater flows at site i = q i .
-
Additional treatment to meet effluent standards cost = \( a_{i} + b_{i} (D_{i} )^{{c_{i} }} \) where D i is the total wastewater flow undergoing additional treatment at site i and c i < 1.
-
Pipeline and pumping for each pipeline segment costs approximately α ij + β(q ij )γ.
-
where q ij is pipeline flow between adjacent sites i and j and γ < 1.
Rights and permissions
Open Access This chapter is distributed under the terms of the Creative Commons Attribution-NonCommercial 4.0 International License (http://creativecommons.org/licenses/by-nc/4.0/), which permits any noncommercial use, duplication, adaptation, distribution and reproduction in any medium or format, as long as you give appropriate credit to the original author(s) and the source, provide a link to the Creative Commons license and indicate if changes were made.
The images or other third party material in this chapter are included in the work's Creative Commons license, unless indicated otherwise in the credit line; if such material is not included in the work’s Creative Commons license and the respective action is not permitted by statutory regulation, users will need to obtain permission from the license holder to duplicate, adapt or reproduce the material.
Copyright information
© 2017 The Author(s)
About this chapter
Cite this chapter
Loucks, D.P., van Beek, E. (2017). An Introduction to Optimization Models and Methods. In: Water Resource Systems Planning and Management. Springer, Cham. https://doi.org/10.1007/978-3-319-44234-1_4
Download citation
DOI: https://doi.org/10.1007/978-3-319-44234-1_4
Published:
Publisher Name: Springer, Cham
Print ISBN: 978-3-319-44232-7
Online ISBN: 978-3-319-44234-1
eBook Packages: EngineeringEngineering (R0)