
Abstract
Recent years have seen a significant growth in Internet of Things (IoT) technology consisting of a large number of devices embedded with sensors and deployed to perform monitoring and actuation tasks. The IoT devices collect large volumes of data that is usually uploaded to cloud to perform analytics and predictions. One of the main challenges in IoT is the transportation of large-scale data collected over a period of time at a remote site. Cellular networks are already facing explosive growth of mobile data traffic due to the proliferation of smart devices and traffic-intensive applications. An alternate solution is to perform the data offloading, where a portion of data can be offloaded from primary links and transferred using opportunistic terminal-to-terminal (T2T) network that relies on direct communication between mobile users, without any need for an infrastructure backbone. However, such approach may lead to data loss and delay if dynamics of time-varying topology and mobility of nodes is not taken care of. To address this challenge, we propose three prediction-based offloading schemes that exploit the mobility patterns and temporal contacts of nodes to predict future data transfer opportunities. We have utilized the High-level Petri Nets to model and formally analyzed the communication processes of the proposed schemes. The new symbolic model verifier (NuSMV) has been employed for the verification of the three schemes against the identified constraints. The verification results affirm the correctness and scalability of the models. The protocols are evaluated with performance metrics, such as the delivery ratio, latency, and overhead. Our results indicate significant improvement in performance compared to existing approaches.
1 Introduction
The recent emergence of Internet of Things (IoT) allows hundreds of low-cost wireless sensor devices to physically connect, share, and produce data [1, 2]. It has been estimated that by the year 2020, the number of IoT devices will increase from 10 billion to 34 billion, and nearly $6 trillion will be spent on IoT solutions in the next 5 years [1, 2]. The IoT devices are usually embedded with sensors that continuously monitor surrounding and generate large volumes of data. It is reported that by the year 2019, 40% of IoT-generated data will be stored, processed, analyzed, and acted upon close to, or at the edge of the network [2]. One of the major challenges faced by the IoT is to transport the large volumes data over the network. Cellular networks are already facing explosive growth of mobile data traffic due to the proliferation of smart devices and traffic-intensive applications. As the terrestrial IoT grows in number and geographic distribution, more infrastructure is required to maintain all of the communication links, resulting in additional costs and maintenance. This calls for an increasing demand for data offloading solutions, where a portion of data can be offloaded from primary links and transferred using alternate communication mechanisms [3]. One such method is to deploy a terminal-to-terminal (T2T) network that relies on direct communication between mobile users, without any need for an infrastructure backbone.
Many IoT applications generate content that is intrinsically delay-tolerant. For instance, IoT equipment deployed at a remote experimental site collecting time-insensitive data that can be stored for some period before being transferred to a distant laboratory for analysis and processing. Mobile data offloading enables an alternate transportation method for time-insensitive content during peak times, e.g., when the cellular network is overloaded or during outage, or from the places where it is infeasible to deploy cellular network infrastructure [4]. In such cases, a cellular provider may decide to send delay-tolerant IoT data only to a small subset of mobile nodes, and let these nodes spread the information through peer to peer (P2P) communications during opportunistic contacts [5]. The mobility of nodes is a real enabler for mobile data offloading schemes. A mobile node may reach an access point (AP) or a neighbor that carries the content of interest, thereby increasing the offload capacity. Numerous studies have been conducted on human mobility and it has been established that the number of places visited by each person is regulated by some properties that are statistically similar among individuals [6,7,8]. Shahzad et al. verified through their experiments that real user mobility is characterized by correlation in locations and trajectories of users, often resulting in the formation of clusters [9]. Such predictable behavior of human mobility leads to an interesting area of research in mobile data offloading, termed as prediction-based offloading [3]. Prediction-based offloading performs the offloading of delay-tolerant content to those mobile nodes that have higher prediction of transferring data toward destinations during opportunistic P2P contacts [10]. The same idea has also been conceived by the Third Generation Partnership Project (3GPP) that is focusing on utilizing device-to-device communications for providing proximity-based services to complement traditional cellular-based communication [11].
In this paper, we propose three prediction-based offloading schemes: (a) a hybrid scheme for message replication, (b) forecast and relay, and (c) utility-based scheme. The proposed schemes capitalize upon predictive behavior of human mobility to perform offloading of delay-tolerant data from a remote IoT site. Our research is motivated by the analysis of two separate large-scale data sets consisting of GPS traces of busses within a city, spanning over a period of 20 days [12]. The first data set is collected from DieselNet testbed in Amherst, Massachusetts, which is comprised of transit busses averaging 21 on the road. The second data set is collected from testbed, UMass DieselNet, consisting of an average of 20 transit busses in use on the road for 18 h/day daily in an area of about 360 km2. The network connections among nodes were distributed on the basis of bus-to-bus and bus-to-APs connectivity. Tables 1 and 2 present the characteristics of busses connectivity [12]. The APs were deployed at various locations at road side. The statistical analysis of both data sets revealed that the busses interacted more frequently with a subset of other busses and APs on regular basis on specific routes. Using this knowledge, our proposed schemes exploit the mobility patterns and the temporal contacts of the nodes to predict the future contact opportunities. The decisions to offload the messages to mobile nodes and further relaying of messages are based on the aforesaid predictions. The proposed schemes base their models on the time-series data of busses’ connectivity collected over a period of time to forecast the future contact opportunities. We present the formal modeling and verification of the proposed schemes in the High-level Petri Nets (HLPNs) and the Z specification language [13, 14]. The HLPN furnish the (a) detailed mathematical analyses of the communication processes undergoing in the proposed schemes and (b) comprehensive overview of the components and information flow encompassing data offloading. To ensure the model correctness, we utilized new symbolic model verifier (NuSMV), which is an automated model verification tool. To the best of our knowledge, no prior work has been devoted to the formal modeling, analyses, and optimized verification of opportunistic prediction-based offloading schemes for the types of network we targeted. We performed the simulations of our proposed schemes in our customized simulator and results indicate the improvement of performance of the proposed schemes compared to the related schemes.
The remainder of the paper is summarized as follows. In Section 2, we discuss the literature review. Section 3 presents our system model, assumptions, and message transfer schemes. Section 4 presents the modeling, analyses, and verification of the schemes. Section 5 examines and describes the results of the simulation and verification of the content dissemination schemes considered in this work. Section 6 presents the conclusion, and finally, Appendix is presented in Section 7.
2 Literature review
Mobile data offloading has been an active area of research for the past few years. With the advent of data-intensive mobile applications, such as video and multi-media content delivery services, the volumes of requested data from cellular networks has increased significantly. According to a Cisco’s report, the global mobile traffic is estimated to significantly increase to about 50 Exabyte per month by 2021, which is a five-times growth over 2017 [4, 15]. Over 78% of this mobile traffic will be video by 2021. With the emergence of more and more data-intensive applications, such as high-density video files download, and IoT, which is collecting thousands of tuples of data per second, the cellular networks are under pressure trying to cope with this unprecedented data overload [3, 4, 10, 16]. Therefore, to address these challenges, several mobile data offloading schemes have been proposed in the literature to reduce the burden on backhaul links, and are generally categorized into (a) infrastructure-based (e.g., [17,18,19,20,21]), and (b) opportunistic-based offloading schemes (e.g., [22,23,24,25,26,27,28,29]).
One of the pioneer works in opportunistic mobile data offloading is proposed by Han et al. [27]. The authors addressed the target set selection problem and proposed three algorithms Greedy, Heuristic, and Random to select a set of k mobile nodes on which the data is to be offloaded to minimize the mobile data traffic. The comparisons of the proposed technique with Random showed better results. The work also implemented a prototype Opp-Off that utilized short range Bluetooth interface for relaying messages to mobile nodes. In [22], the authors propose a scheme to offload data from mobile devices to infrastructure through direct communication or by the use of intermediate nodes. The authors investigate the relation between data size and unsuccessful delivery probability for a given path and time constraint. The authors model the problem with a complex optimization procedure using various approximations that may affect the scalability and accuracy of the proposed technique. The scheme is compared with self-proposed techniques and comparisons with the existing works are missing.
Bao et al. proposed an incentive-based mechanism to reward the users that offer offloading space for the data offloading requesters [23]. The authors design a game theoretic approach based on Stackelberg game model in which multi-followers, as offloading requesters, correspond to a number of multi-leaders, as offloading handlers, for receiving data through opportunistic contacts through traffic offloading. The incentive amount is proportional to the data offloaded by each handler. The utility of a given flow is defined as a generic concave function. The authors assumed that the caching space of an offloading helper is unlimited. Moreover, no comparisons with the related schemes are provided. In [24], the authors proposed a Wi-Fi based offloading strategy and formulated the problem as an offline policy based on integer linear programming. Each mobile user in the proposed system needs to obtain a certain data from the Wi-Fi access point before deadline. The access point makes a decision of which mobile node to serve, when multiple mobile nodes connect to it simultaneously. The mobility of nodes causes intermittent connectivity. A mobile node obtains the data from the cellular networks only when the deadline is missed. The proposed approach requires an advance knowledge of the mobility patterns of nodes. Moreover, the technique is compared only with round robin and random.
Valerio et al. analyzed a real-world cellular traffic dataset of video requests collected in a large metropolitan area over a period of 1 month to devise possible offloading strategy [25]. The authors proposed a solution that consisted of two parts: (a) data caching and (b) opportunistic data offloading. For caching, the system requires the infrastructure in the form cache servers deployed by the operator in the cellular network. For the offloading, the proposed system utilizes the flooding-based scheme, and a central dissemination controller is required to initiate and monitor the offloading process. There are no comparisons of proposed technique with the related schemes. In another work [26], Valerio et al. proposed an operator-assisted offloading system in which a central controller decides dynamically over time to which nodes the content must be sent through the cellular network, based on the current status of dissemination. The acknowledgments are sent by the nodes over the network to indicate the content is received. To some nodes, the content is directly injected by the cellular network. The authors utilized reinforcement learning to train the centralized controller for dissemination decisions. The proposed work is dependent on the centralized control and not purely of opportunistic nature.
The existing data-oriented schemes for the networks, such as [30,31,32,33,34], are primarily based on the opportunistic transfer of bulk data. The researchers have exploited the opportunistic offloading to address the issues, such as the (a) multicast routing in the mobile social networks (MSNs) [35] and (b) unicast routing in the delay-tolerant networks (DTNs) [36]. In general, with the increasing growth of IoT and Big Data, and with the arrival of 5G technology, the offloading of content in cellular environments is still an open research issue. The research fraternity tries to strike a balance between the flooding-based schemes [32,33,34,35,36,37,38], and the selective replication strategy [28, 29]. The flooding-based schemes improve the message delivery and latency at the cost of the resource consumption, whereas the selective replication strategies lower the resource consumption at the cost of decreased message delivery and increase in latency [29]. The modeling and analyses of routing in the opportunistic environments has remained restricted to the models of disparate aspects of the communication processes. Few of the instances are the (a) Markov chain models of the message dissemination process [39], (b) stochastic models of the delivery delay and the task completion time [32], (c) Poisson model of the network and encounter process [40], (d) coalitional game model of the decision making process among nodes [40], (e) graph model of the mobility and mathematical forecasting model [36], and (f) Colored Petri Net (CPN) model of the anycast communication process [41]. Moreover, the authors in [42] made use of the Queueing Petri Nets to model the communication-based aspects of the data transfer in delay tolerant environments. However, the work was based on the existing routing schemes (similar to [32, 39]) and presented a theoretical analysis. Wireless network protocols such as the Bluetooth device discovery, and those encompassing the wireless sensor and local area networks, have been verified extensively in the literature [43]. However, the verification of opportunistic routing of offloaded data received less attention comparatively. In [41], the proposed CPN model for the opportunistic anycast communication process was abstractly verified without the use of a suitable model checking tool.
Most of the above-mentioned schemes are either too complex that they need to apply certain simplifying assumptions or approximations that will have a negative effect when the same deployed in realistic scenarios, or they are of small scale covering a small area and subset of nodes. Moreover, these schemes do not compare their performance with the related schemes which makes it difficult to judge the offloading quality. Furthermore, to the best of our knowledge, none of the existing works were conceived for the design, formal analyses, and verification of novel content dissemination schemes for the mobile data offloading.
3 System model, assumptions, and message transfer schemes
We consider a road network on which various transportation services, e.g., busses, cabs, trams, etc. operate on their specific routes. The IoT equipment is deployed at a remote site as shown in Fig. 1.

Data offloading and opportunistic peer to peer data transfer toward destination
The large volumes of data collected through sensors are transferred to cellular base station installed closer to the IoT site. From the base station, the prediction-based offloading of data is performed to the en route busses fitted with specialized communication equipment. Once the data is offloaded to busses, the further relaying of data toward destination is performed through bus-to-bus or bus-to-AP data transfer opportunities. To generalize the scenario, we use term nodes in lieu of busses, comprising of a set of mobile nodes, such as the PDAs, smartphones, handheld devices, and the fixed access points (APs). The nodes rely on opportunistic P2P contacts for the exchange of the network state information through in-band control signaling and message transfer.
We assume that all the nodes in the network have a unique network identifier, denoted as N_ID. The attributes of a message include a unique sequence number M_ID, source, destination, life-time or time-to-live (TTL), and size. The three lists that a node maintains relative to messages are the (a) message list (ML), containing the physical messages generated or to be relayed by the node, in the message buffers; (b) received list (RL), comprising of the M_IDs of the messages that were received by the node; and (c) acknowledgment list (AL), consisting of the M_IDs of the messages that the node has successfully delivered to the corresponding destinations. It is important to mention here that the size of ML will not grow too big, as those messages that are already delivered to the destination, or whose TTL is expired are regularly being deleted from ML. Moreover, the remaining two lists RL and AL will also be of considerably smaller sizes because they are supposed to contain only the IDs of the messages, not the message content/payload.
The transfer of the messages between any two nodes in the network requires the two nodes to be in each other’s transmission range. When two nodes come in the communication range of each other, the node that initiates the connection (connection initiator or CI) incepts the communication with the connected node (CN). The nodes exchange the information about the contents of their MLs, RLs, and also, to figure out the messages that can be exchanged. Firstly, the CI transfers the messages that are destined for the CN. The messages destined for the CI are then transferred by the CN. Subsequently, based on the prediction-based computations, the CI transfers the messages that can be relayed by the CN to the destinations of the messages. The CN then transfers the messages that can be relayed by the CI. More precisely, a message can be transferred directly to the destination on making an opportunistic contact with the source. In the absence of an end-to-end path from the source to the destination, the replicas of the content can be opportunistically relayed toward the destination by using replication through the intermediate nodes known as the relay nodes. To cooperate in the message transfer, the resourceful nodes allocate a limited portion of their buffers for opportunistic data. The nodes keep log of all the previous contacts and use this data to forecast the future contacts. The decision to relay or not is based on the underlying content dissemination scheme we proposed in the paper. The scheme also decides whether or not to retain a message after a node relays the replica to a relay. In the following text, we describe the three content dissemination schemes considered in this work.
3.1 Forecast and relay scheme
The forecast and relay (FAR) protocol considers only the contact duration (CD) between any two nodes as an indicator of the meeting quality for performing the prediction-based computation. When two nodes (i and j) make an opportunistic contact at a time instant t, the nodes record the meeting quality, denoted by Cij(t), which is quantified by the CD between the nodes. Each of the nodes in cellular network stores the meeting qualities for other nodes in the network in the form of time-series entries. The higher the value of meeting quality between two nodes, the greater is the probability of a successful message transfer. When a source node s generates a message m for a destination d, and cannot establish a direct contact with d, the node decides whether or not to replicate m on an intermediate relay node r, i.e., using a conditional replication, based on the following:
In the above equation, the parameter 0 ≤ ϕ ≤ 1 denotes the smoothing constant, the parameter Csd(t) represents the meeting quality of s with d until the time t, the parameter Fsd(t) is the current forecast of the meeting quality between s and d. In (1), s will replicate m on r, if and only if r has a better forecasted meeting quality with d. The condition may also be expressed as: Frd(t) > Fsd(t). A limit is set to the maximum number of time-series entries stored by a node (denoted as ω) using a sliding time window [1, ω]. When a new entry is added, the oldest entry is automatically deleted. Information freshness and accuracy are ensured by assigning progressively decreasing weights to the older entries and by prioritizing the recent ones. Moreover, in (1), if we substitute the value of Fsd(t − 1) = [ϕ · Csd(t − 2) + (1 − ϕ) · Fsd(t − 2)], we get:
By resubstituting the value of Fsd(t − 2) in (2), we obtain (3) and solving recursively, we finally obtain (4).
In the above equation, each of the entries for the meeting quality Csd(t) has been assigned a certain weight such that as an entry becomes older, it contributes lesser to the overall forecasted value. The base case value of the recursion Fsd(0) is given as follows:
The above equation indicates the average of the meeting qualities of s and d within the interval [1, ω].
3.2 Hybrid scheme for message replication
The hybrid scheme for message replication (HSM) presents an incremental version of the FAR that aims at improving the message delivery of messages, however, at the cost of latency. Suppose a node i, carrying a message, makes a contact with a node j. If the node j is not the final destination of the message, then the node i decides whether or not to replicate the message on j for opportunistic forwarding. The HSM tackles the decision-making process in the network through conditional replication, by computing the utility values of i and j for the message to be replicated. The utilities are (a) the probability that the message will be delivered to the destination before life-time expiry and (b) the probability that the contact duration between a node (i or j) and the destination will be greater than the time required to transfer the message. If both of the probabilities of j are greater than that of i, the message will be relayed to j and deleted from the buffer of i. The process is known as conditional deletion. In the case of j exhibiting just only higher value for the case (b) but not for case (a), the message will be replicated on j and retained in the buffer of i. The HSM performs the aforementioned prediction-based computations to conditionally replicate the message between two nodes. The parameters considered in the HSM for the conditional replication are the (a) contact duration (CD) and (b) inter-contact time (ICT).
The CD and ICT values between any two nodes i and j are denoted by \( {C}_i^j \) and \( {I}_i^j \), respectively. Each of the nodes in the network maintains a 2-tuple, bounded time-series data (of size ω) that are the CD and ICT values for every encounter, represented as: \( <{C}_i^j\left[\tau \right],{I}_i^j\left[\tau \right]> \), at time instant τ. The parameter ω denotes the index of the last entry in the time-series. Let \( {T}_w^k \) denote the time since the creation of a message mk destined for d, and \( {T}_L^k \) be the TTL of the message mk where k represents the kth message. We compute the utility value of a message k for a node i using the following equation based on [44].
In the above equation, \( {Z}_i^d\left(\tau \right) \) is the mean ICT of node i with d. Therefore, the utility \( {U}_{i,d}^k \) is the probability that ICT of node i with d is less than life time or TTL (\( {T}_L^k \)) of message k minus the time already spent by message waiting in buffers (\( {T}_w^k \)). In other words, the utility value will be greater, if the node i with message mk is expected to meet with the destination d earlier than the remaining life time of the message mk. Few of the nodes in the network follow a partially scheduled mobility pattern. Such patterns allow to forecast the value of \( {Z}_i^d\left(\tau \right) \), using the following formula:
In the above equation, the parameter 0 ≤ α ≤ 1 denotes the time-series smoothing constant, the parameter \( {I}_i^d\left[\tau \right] \) represents the ICT of the node i with the node d at time instant τ, the parameter \( {Z}_i^d\left[0\right] \) is the base value of the recursion, and \( {Z}_i^d\left(\tau \right) \) denotes the forecasted ICT of the node i with the node d. The nodes in the network allocate a limited memory for the opportunistic data and cannot store the information about all of the past meetings. The sliding time window [1, ω] limits the maximum number of entries that a node may store. To ensure freshness in the information, the entries in the range [1, ω] are assigned progressively decreasing weights that allows the recent entries to contribute more to the overall forecasting. The base case value of the recursion \( {Z}_i^d\left[0\right] \) is given as follows:
The above equation represents the average of ω entries of the ICT between i and d. If \( {T}_t^k \) denotes the time required to transfer a message mk during an opportunistic contact, then the message will be successfully transferred, if and only if the CD between the two nodes is greater than \( {T}_t^k \). The utility value denoted as \( {V}_{i,d}^k=P\left[{T}_t^k<{C}_i^d\left(\tau \right)\right] \) represents the probability that the message will be successfully transferred between the nodes i and d within the mean CD time. The utility of a node i for message mk will be greater if the mean CD of node i and d is lesser than transfer time of mk between the node i and d. To compute the \( {V}_{i,d}^k \), the estimated value of CD between i and d can be found by replacing \( {I}_i^d \) with \( {C}_i^d \), and \( {Z}_i^d \) with \( {V}_i^d \) in (7) and (8).
3.3 Utility-based scheme
The utility-based scheme (UBS) is developed to improve the design of FAR and HSM. Precisely, in the FAR and HSM, a node may accept the same message that it has previously relayed in the network. Such relaying increases message replicas that cause considerable resource and energy consumptions during the replication process. To address such issue, the UBS implements an additional list named as the passed message list (PML), maintained by the nodes in the network. When a node replicates a message for the first time, the corresponding M_ID is recorded in the PML. During an opportunistic contact, the M_IDs of the incoming messages are checked against the contents of the PML, and the M_IDs that already exist are ignored, even if they were deleted from the actual ML. Such an approach improves the overall message delivery and overhead. In the UBS scheme, nodes keep the log of CD- and ICT-based information, with the recent entries being prioritized, while the sliding time window sets a limit to the maximum number of entries. If a node i is carrying a message destined for d and cannot establish a direct contact with d, then the node i decides whether or not to replicate the message on an encountered relay, based on the mean CD and ICT values \( {C}_i^d\left(\tau \right) \) and \( {Z}_i^d\left(\tau \right) \), respectively. We modify and denote the aforementioned mean CD and ICT values here as \( {C}_{i,d}^k\left(\tau \right) \) and \( {Z}_{i,d}^k\left(\tau \right) \), respectively. The parameter k represents the kth message mk and τ denotes the current time instant. With the knowledge of the CD and ICT values, we now compute the aggregate utility \( {W}_{i,d}^k\left(\tau \right) \) for mk, given as follows:
The utility \( {W}_{i,d}^k\left(\tau \right) \) in the above equation is a measure of how good a node i is in terms of successfully delivering mk to d before the life-time expiry. The higher the \( {C}_{i,d}^k\left(\tau \right) \) value and the lower the \( {Z}_{i,d}^k\left(\tau \right) \) value between nodes i and d, the better are the chances of mk being delivered to d by i. During an opportunistic contact between i and a relay r, the UBS computes the difference of \( {W}_{i,d}^k\left(\tau \right) \) and \( {W}_{r,d}^k\left(\tau \right) \) for a message mk and subsequently, for all of the messages in the ML of i. If M is the set of messages in the ML of i, the notation \( \left({W}_{i,d}^k\left(\tau \right)-{W}_{r,d}^k\left(\tau \right)\right) \), ∀mk ∈ M depicts the aforesaid difference. With the obtained differences of the aggregate utilities of i and r for each of the messages, the ML of i is reordered in an ascending order, such that the message for which the difference value is the least is moved to the top of the list. This implies that the messages are reordered according to progressively decreasing probabilities of being delivered by r. Subsequently, all messages that are not in the ML of r are relayed. Evidently, the UBS performs flooding by prioritizing the messages and does not implement the conditional replication or deletion, as performed by the HSM and FAR. The number of prediction-based computations performed on a node remains the same, as we still use the CD- and ICT-based data. We verified through experiments (in results section) that using such designed approach, the performance of UBS has improved. In the next section, we present the formal modeling and verification of the proposed schemes.
4 Formal modeling and verification
In this section, we present a discussion on the verification of the three schemes HSM, FAR, and UBS. The verification involves the modeling of the highly unpredictable and dynamic communication processes in a comprehensive, yet optimized way, and is an exceedingly time-consuming process. The verification process includes (a) translation of the HLPN models of the three schemes into the NuSMV models, written in the NuSMV language, and (b) automated formal verification of the three models for identified constraints through exhaustive model checking. The constraints are defined as specification in the computational tree logic (CTL), (c) testing of the models in the presence of up to 100 nodes and 100 messages to verify the scalability and correctness, and (d) use of the optimization techniques offered by the NuSMV to verify the specifications in finite time. We affirm that the HLPNs can be used effectively to model the dynamic prediction-based offloading schemes. Moreover, the work will corroborate the fact that the formal verification of similar complex schemes may not be merely limited to the verification of the correctness of the models. In addition, verification can also be capitalized upon to pave the way for newer routing models, verify their scalability, and to enhance the general performance.
4.1 High-level Petri Nets
The Petri Nets are modeling tools used for the graphical and mathematical modeling of various systems that can be characteristically concurrent, asynchronous, distributed, parallel, non-deterministic, or stochastic [13]. In this work, a variant of the classical Petri Nets, namely the High-level Petri Nets (HLPNs) [13], have been used to model the proposed schemes. Relevant details on the Petri Nets have been presented in [14].
Definition 1 (HLPN) [13]. A HLPN can be defined as a 7-tuple, N = (P, T, F, φ, R, L, M0), where the variable:
-
1.
P represents a finite set comprising of the places. The places represent overall state of the system.
-
2.
T is a finite transition set, such that P ∩ T = ∅.
-
3.
F represents a flow relation (set of arcs), such that F ⊆ (P × T) ∪ (T × P).
-
4.
φ denotes a mapping function, used to map P to the data types, such that φ : P → Type.
-
5.
R represents the rules for mapping T to the predicate logic formulae, such that R : T → Formula.
-
6.
L represents the labels, and is used to map F to the labels, such that L : F → Label.
-
7.
M0 is the initial marking, such that M : P → Tokens.
The variables P, T, and F furnish the information about the structure of the HLPN and the variables φ, R, and L contribute to the static semantics, signifying that the information present in the system is unvarying.
In a HLPN, the places may house tokens of one or more different data types. An example of a HLPN is shown in Fig. 2. The places shown in the figure can be considered to be mapped with various data types, such as: φ(PA) = ℙ(Int), φ(PBE) = ℝ(Float), φ(PC) = ℝ(Double), and φ(PD) = Char. To enable or fire a transition, the pre-condition of that transition must hold. The firing of a transition depends on the variables from the incoming arcs, and the number of tokens in the places associated with those arcs. As an example, in Fig. 2, the variables a and b from the places PA and PBE, respectively, will be responsible for the firing of the transition t2. The post-condition is the result of a fired transition and utilizes the outgoing variables, such as c (for t2). Assuming that the values of a = 1, b = 2.5, and c = 3.15, example of a rule for the transition t2 would be: R(t2) ≔ (a = 1) ˄ (b = 2.5) ˄ (c = 3.15), where (a = 1) ˄ (b = 2.5) is called the pre-condition, and (c = 3.15) is called the post condition. Simply put, firing an initial transition (t1) enables the system to fire the transition t2. The transitions utilize the data flowing through the incoming arcs to perform computations and the outgoing arcs are used to carry the results to corresponding places.

A High-level Petri Net
4.2 NuSMV
NuSMV is a software tool for the formal verification of finite state systems [45]. It is the re-implementation version of SMV symbolic model checker with enhancements. The basic objective of NuSMV is to check a given finite state system against the specifications defined in the temporal logic CTL (computational tree logic) [46]. The input language of NuSMV allows the descriptions of the finite state system to be defined in the NuSMV environment using data types offered by the language. The NuSMV language utilizes the expressions in propositional calculus to describe the transition relations of a finite Kripke structure [47]. Therefore, in our paper, the properties of the proposed schemes are translated into NuSMV language and verified using NuSMV’s automated model checking (Table 3).
4.3 Modeling and analysis of HSM
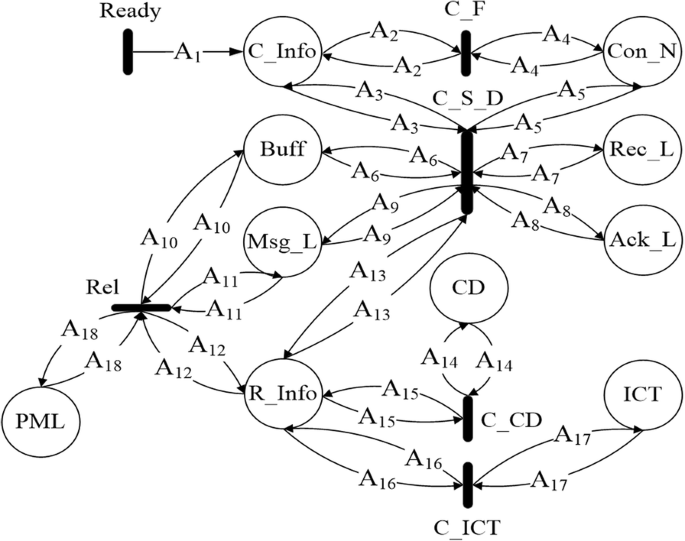
We first present the modeling of HSM, as this scheme is the incremental improvement of FAR, so this saves us from re-writing all the equations again for FAR that are already contained in the model of HSM. The HLPN model of the HSM is illustrated in Fig. 3. The nine places depicted in Fig. 3 constitute the set of places P. The names of the places and the corresponding mappings (φ) to the tokens or data of various data types, are shown in Appendix Table 4. The data types are described in Table 5. In Fig. 3, the set of transitions are denoted as: T = {Ready, C _ F, C _ S _ D, C _ CD, C _ ICT, Rel}. The set of arcs F (flow relation) and the corresponding labels (L) are also shown in Fig. 3. The initial marking (M0) is simply the tokens of different data types placed at P, as shown in Appendix Table 4.

HLPN model of the HSM
Here, we briefly discuss the communication processes indicated in Fig. 3. For a detailed description of transitions involved, the reader is advised to refer to (14), (15), (16), and (17) in Appendix. The Ready transition indicates that the node is ready to initiate a connection with any other node in the network that enters into the transmission range of current node. A node can initiate simultaneous connections with multiple nodes. We name the node that first sends the connection request, the connection initiator CI, and the node to which the connection request is sent is called connecting node CN. The information about CI and CN is maintained by the system in the places C _ Info and Con _ N, respectively. If there is no CN in the range of CI, the connection failure transition C _ F is fired, which is defined with the following formula:
However, if there is one or more nodes present in the range of CI, then the connection successful transition C _ S _ D is fired. The information about the attributes of messages (e.g., size, destination, M_ID, and TTL) contained in the message list ML of CI is defined in the place C _ Info of the petri net. The detailed process of firing of transition C _ S _ D, the pre-conditions, and the post-conditions is defined in (14) of Appendix. To summarize, first of all, both nodes CI and CN exchange their message IDs contained in buffer (represented by the place Msg_L), the received message IDs (represented by place Rec_L), and acknowledged message IDs (represented by the place Ack_L). Both nodes delete those messages from Msg_L that are already marked as delivered to destination (through relay nodes), i.e., they have entry in the places Ack_L or Rec_L. The buffer space of the node (represented by the place Buff) is updated accordingly. In the next step, those messages are exchanged between nodes for which the nodes are the messages’ destinations. The Ack_L and Rec_L are updated accordingly, and the transferred messages are deleted from Msg_L of both nodes, updating the Buff.
Finally, those messages are left with CI whose destination is not CN, and that needs to be opportunistically replicated. Using the network information available about nodes and messages in R _ Info, the system computes the CD- and ICT-based utilities (see Section 3.2) of the messages using the transitions C _ CD and C _ ICT, respectively, and store the utilities in the places CD and ICT. The details of the transitions C _ CD and C _ ICT are mentioned in (15) and (16) of Appendix. The node CI begins replicating messages to CN with the conditional firing of transition Rel that makes use of aforementioned computed utilities and the information stored in R _ Info to perform conditional replication. The inner details of the involved pre-conditions and post-conditions are mentioned in (17) in Appendix. Once the node CI finishes message replication to CN, the same procedure is repeated by the node CN. The CI will repeat the process with the other connected nodes one by one. The model does not check if an incoming message to a node had been previously replicated by the node.
4.4 Modeling and analysis of FAR
The HLPN model of the FAR is depicted in Fig. 4. Evidently, the model resembles the model of the HSM. The only notable difference is that the ICT-based place (ICT) and transition (C _ ICT) are not considered in the model of the FAR. The reason is that the replications in the FAR are solely based on the CD. The places and the corresponding mappings to the data types are shown in Tables 6 and 7, respectively in the Appendix. Tables 6 and 7 entail only the mappings and data types that have been modified from the contents of Tables 4 and 5. The modification is simply the exclusion of ICT-based data and the inclusion of the CD-based meeting quality values (against the CD-based utility), as compared to the model of the HSM. The contents and mappings for the rest of the places, alongside the flow and labels, remain the same as that of the HSM. The set of transitions T = {Ready, C _ F, C _ S _ D, C _ CD, Rel}.

HLPN model of the FAR
Apart from Rel, the functionality of the pre- and post-conditions (formulae) for the rest of the transitions remain the same, and have not been shown (please refer to Appendix for details). The functions used in the model remain the same as the ones used for the HSM. The only difference is that the transition C _ CD employs the function FMQ _ CD to compute the forecasts of the meeting qualities of the communicating nodes. The function Comp _ CD had been used for the HSM to compute the CD-based utility. Therefore, apart from the replication process, the behavior of the model is exactly the same as that of the HSM that allows us to move on to the replication process Rel shown in (18) of Appendix. Again, the model does not check if an incoming message to a node had been previously replicated by the node.
4.5 Modeling and analysis of UBS
The HLPN model of the UBS is exhibited in Fig. 5. The inclusions of the place passed message list (PML) containing the PMLs of the communicating nodes and a sorted list of aggregate utilities of the communicating nodes are the modifications made to the model of the HSM. We use the mean CD and ICT values computed in Section 3, instead of the CD- and ICT-based utilities of the HSM. The modifications improve the design limitation and facilitate the flooding-based routing. The places and their data type mappings that are modified from or added to the contents of Tables 6 and 7 are shown in Tables 8 and 9, respectively in the Appendix. The aggregate utility (AU) has been added to the list of acronyms. The contents and mappings for the rest of the places, alongside the flow and labels, remain the same as that of the HSM. The set of transitions is given as T = {Ready, C _ F, C _ S _ D, C _ CD, C _ ICT, Rel}. Being an extension of the HSM, the basic communication processes and the transitions in the UBS remain the same. The detailed description of transition Rel be seen in (19) of Appendix.
HLPN model of the UBS
Apart from Rel, the functionality of the formulae to the rest of the transitions are the same as that of the HSM. The only difference from the HSM lies in the flooding-based replication and the incorporation of the PML. The functions used in the model remain the same as the ones used for the HSM. The functions Comp _ CD and Comp _ ICT are modified to compute the mean CD and ICT values, instead of the utilities. The information on the communicating nodes, messages, and the mean CDs and ICTs are made available at R _ Info and Rel is fired to initiate the replications, as indicated in (19). In (19), the only differences as compared to the replication process of the HSM in (17) are as follows: (a) messages are processed from the reordered ML of the CI and only the messages that are not in the ML and PML of the CN are considered for replication; (b) after relaying a message successfully, the CI adds the corresponding M_ID to its PML, if it was not already included; and (c) all of the messages referred to in (a) are replicated, and there is no conditional replication or deletion. The rest of the process is the same as (17).
4.6 Verification of HSM, FAR, and UBS
Formal verification is a methodical procedure that incorporates mathematical reasoning for the development, specification, and verification of the correctness of systems [43]. Model checking is a verification technique, used to verify the properties of a system. The process encompasses an exhaustive search of all of the possible states that the system may enter during the execution [43]. The process comprises of the (a) specification of the system properties, (b) system modeling, and (c) verification of the specifications, using tools, such as NuSMV.
Definition 2 (model checking) [13]. Formally, given a Kripke structure M = (S, I, R, L), and a temporal logic formula φ, the model checking problem is to find the set of states satisfying φ, given as: {s ∈ S | M, s ⊨ φ}, where S is a finite set of states, I is the set specifying the initial states, R ⊆ S × S is a transition relation, used to specify the possible state-to-state transitions, and L is a labeling function for labeling the states with atomic propositions.
Definition 3 (NuSMV model) [47]. A NuSMV model is a Kripke structure is given as M = (S, I, R), where each of the states of S can be labeled by a predicate \( {\bigwedge}_{i=1}^k\left({v}_i={d}_i\right) \), the finite set var(M) = {v1, … , vk} represents the set of state variables, with {d1, … , dk} representing their interpreted values over the domain {D1, … , Dk}, and R is the transition relation that updates the state variable interpretation.
The NuSMV language flexibly describes the transition relation of a finite Kripke structure [47] using the propositional calculus [45]. State variables with certain domains are used to depict the behavior of a NuSMV model. Each of the states in the model corresponds to an assignment of values to the state variables [47]. The NuSMV transforms the FSM of the system under verification to a BDD. A Boolean formula and its BDD are a compact depiction of the set of states that satisfy the formula. The transition relation for the Kripke structure may be represented by a Boolean formula and consequently the BDD, comprising of the current and next state variables [47]. A temporal logic, such as the CTL that has been used in this work for property specifications, is used to express the behavior of Kripke structures. Relevant details on the Kripke structures and CTL temporal operators may be found in [13].
For each of the HLPN models (M) presented in this work, we specify a property φ in CTL. The NuSMV verifies φ by finding all of the states that satisfy φ, represented as: {s ∈ S | M, s ⊨ φ}, according to Definition 2. The NuSMV performs the verification and furnishes the result as a true or a false. The property that we have verified for the HLPN models of the HSM and FAR reflects their design limitation. The property is stated as: a node accepts the same message that it has previously relayed in the network and eventually deleted from the ML after one or more replications. The property that we have verified for the HLPN model of the UBS encompasses the addressing of the aforementioned design limitation. The property is stated as: once a message is replicated by a node, the same message can never be accepted back by the node, even after being deleted from the ML. In the three schemes, a message may be deleted by a node, if the node finds the message to be in the RL or AL of a CN. While the deletion of a message in the schemes can also occur due to the lack of buffer space, HSM also supports conditional deletion. The model checking of the communication processes in an opportunistic network necessitates a very high computation time. The optimizations used in this work to achieve the results in finite time are [46] (a) dynamic variable reordering, (b) forcing the construction of a partial model comprising of only the variables that affect the specification by using the cone of influence, and (c) disabling the computation of reachable states.
5 Results and discussion
5.1 Simulation scenario
We designed a customized simulation framework based on extending the opportunistic network environment (ONE) simulator [48], which is a platform independent Java-based simulator. The ONE simulator provides various base classes for mobility models and scenarios that can be extended to develop a customized simulation environment. The simulator allows importing of real-world street maps into the simulation environment. Moreover, the simulator allows defining some target locations on the map, which can either be randomly chosen, or predefined. Such locations on the map are known as points of interest (POI), and the mobile nodes can be programmed to follow the shortest routes towards POIs with some probabilities. The POI may represent frequently visited real-world destinations, such as offices, homes, shopping malls, or restaurants. The worldwide street map of various cities is available online at www.openstreetmap.org. For our simulations, we imported a portion of the map of city of Fargo, USA, and utilized the GIS tool OpenJUMP [49] to post-process the map with various POIs. Nodes are divided in different groups and assigned different locations and mobility models. The data producing IoT sites are distributed randomly on the map at far distances. The busses are assigned to various routes on the road network with a few passing near to the IoT sites. The cars and other transportation services travel randomly on various highways. Figure 6 shows a portion of the selected map in OpenJUMP where the post-processing is performed, whereas Fig. 7 shows the same portion of map opened in the ONE simulator. The simulations with real trace data are also performed to see the performance of the proposed schemes in realistic scenarios.

A portion of map opened in OpenJUMP. The dots on the map indicate the specific points of interest (POI). The different colors are used just to represent different types of POIs such as shopping malls, restaurants, or schools

A portion of map shown in ONE simulator. The circle surrounding nodes represent communication radius
Table 3 represents the summary of simulation settings used.
5.2 Performance metrics
The protocols are evaluated for three performance metrics: (a) delivery ratio, (b) latency, and (c) overhead. The following subsections illustrate these metrics.
5.2.1 Delivery ratio
Delivery ratio is the percentage of messages delivered successfully. The unit of delivery ratio is “% of successful message deliveries”. The increased message delivery ratio is the major goal opportunistic data offloading scheme.
Message delivery ratio is calculated as follows:
where M is total messages created and Rk = 1 if message mk is delivered, otherwise Rk = 0.
5.2.2 Latency
Latency is the total time spent between message creation and delivery to the destination. The average latencies of messages contribute to the overall latency measure of protocol. A protocol must minimize latency but without compromising message delivery ratio. The latency average (in seconds) is given by:
where N is the total number of messages received, the parameters receive timek and creation timek represents the receiving time and creation time of message k.
5.2.3 Overhead
The overhead is calculated as the relative estimate of number of message transmissions:
In the above equation, total relayed represents the total number of message relaying in the network and total delivered indicates the total number of messages delivered to the destination, where total delivered ≤ total relayed. The overhead ratio indicates extra transmissions for each delivered message. The overhead just represents a ratio with same metric (number of messages) as numerator and denominator; hence, it does not have any units. For instance, if total relayed is 5 and total delivered is also 5, then overhead = (5–5)/5 = 0, which means, the messages were directly delivered to the destinations by the source nodes. On the other hand, if suppose total relayed = 20 and total delivered = 5, then overhead = (20–5)/5 = 3. This implies that each of the delivered message (out of five) had on the average three extra transmissions before reaching the final destination node.
5.3 Simulation results
In this subsection, we present the simulation results of the proposed schemes with comparisons to the existing baselines. We have run simulations to show results for the above mentioned performance metrics: (a) delivery ratio, (b) latency average, (c) overhead ratio, and (d) buffer time average, by varying: (a) number of nodes, (b) buffer size, (c) transmission range, and (d) TTL. It is important to mention that usually, it is very difficult for a scheme to give best performance for all the performance metrics. The attempt to improve one metric may degrade the performance of other metric. This is primarily due to the numerous stochastic factors involved in opportunistic communication processes. Therefore, our main objective in the proposed schemes is to increase the number of messages successfully delivered, i.e., we aim for higher value of message delivery ratio.
5.3.1 Varying the number of nodes
Figure 8 shows the performance of the proposed schemes FAR, HSM, and UBS, compared to the existing schemes, namely PRoPHET [28], Epidemic, Random, and Wave [29]. The selected schemes are found to show better performance in the environments analogous to the one we modeled in the simulations [29]. The HSM achieved better performance for delivery ratio and overhead. This is because of the efficient prediction mechanism of HSM giving priority to the most recent contacts among time-series data. On the contrary, the PRoPHET computes the future contact predictions based on just the number of contacts with the existing nodes without considering the time varying pattern of contact duration and inter-contact times. The Epidemic scheme performs replication of message to every node in flooding manner. However, the increased flooding may overburden the limited resources of mobile devices which results in increased message drop rate to create space for new messages. The Random scheme forwards single message copy to any randomly selected neighbor, whereas the Wave scheme performs replica flooding in a controlled manner. Despite that both the aforementioned schemes are resource conservative, they exhibit low performance than HSM. This is because these schemes do not utilize the past meeting patterns to perform a node’s utility estimations.

The performance of schemes by varying number of nodes.
The delivery ratio of FAR is less than HSM and UBS because of less efficient prediction computation; however, there is a decrease in latency due to the removal of additional checks that are imposed in HSM. The improvement in latency of FAR comes at the cost of increased overhead because the number of message relaying is higher in FAR compared to HSM. This is because, message replication decision of FAR does not take into account the node’s inter-contact times’ utility. Due to this, a message has to traverse through multiple relays before reaching the final destination, thus increasing the overhead ratio. Therefore, this limitation is addressed in the HSM protocol that improves the delivery estimation of message, thus reducing the extra replications and overhead ratio.
Compared to the baseline schemes, the FAR still achieves better performance in terms of delivery ratio, latency, and overhead because of the efficient computation of future contact predictions from the time-series data of nodes’ mobility and contacts. The performance of UBS supersedes the performance of HSM and FAR in terms of delivery ratio, latency, and overhead. The upgraded performance of UBS can be attributed to it being a hybrid of HSM and FAR, with an additional feature of flooding based but controlled message transfer. Sorting the aggregate utilities in the UBS ensures that each of the messages with a node contributes to the improvement in message delivery and latency. As all of the messages are transferred, the messages spend less time waiting in the buffers; thereby, lowering the latency. The UBS increases the message copies and does not perform conditional deletion; thereby, enhancing the delivery ratio. Disallowing the transfer of an already-replicated message in the UBS prevents message loops, lowers the message drop rate, and improves delivery ratio and overhead.
Figure 9 shows the average time spent by the messages into nodes’ buffers. Compared to the other two schemes, UBS exhibits highest average buffer time. This is a tradeoff with an increased delivery ratio of UBS. As the message drop rate is lesser in UBS, the messages tend to stay longer in buffers till their lifetime expiry, or final delivery to the destination. Just like UBS, the messages are also not deleted from FAR and tend to stay in buffers until expiry of lifetime or delivery. However, the HSM performs conditional deletion of messages, so there are less number of messages that stayed longer buffers, thus decreasing the buffer time average. The buffer time average of remaining protocols is less, as due to the increased message drop ratio in these schemes, the messages do not stay in buffers for longer durations.

The buffer time average by varying number of nodes.
5.3.2 Varying the buffer size
Figure 10 shows the performance of the schemes with increasing the buffer size. It is interesting to note that after a certain increase in size, the performance of the protocols becomes constant. This also proves that buffer size has a partial impact in a protocol’s performance, as there are numerous other stochastic factors, such as nodes mobility, network disconnectedness, and transmission range, that simultaneously have an effect on a protocol’s performance. There is an initial increase in delivery ratio performance with an increase in the buffer size. The obvious reason is that more buffer space becomes available for the messages, and there is decreased message drop rate due to buffer overflows. Increasing buffer space has an interesting impact on overhead ratio. This behavior is in accordance with the (13). When the buffer size is small, then fewer messages are delivered as more messages are dropped due to buffer overflows. Therefore, (13) will produce a higher overhead value. With increase in buffer capacity, the number of messages delivered also increases, which leads to a decrease in overhead.

The performance of schemes by varying buffer size.
5.3.3 Varying the range radius
Figure 11 shows the results by increasing the transmission radius. The performance of our schemes supersedes the baselines in terms of delivery ratio. The reason is that as the nodes remain connected, they get more network information to share, thereby improving the utility computation. However, similar to the case of increasing buffer size, the latency performances become constant after increasing the range to a certain threshold, due to the impact of other stochastic factors involved. The proposed schemes also exhibit better performance in the case of latency average and overhead ratio. The latency of HSM is higher initially. This is due to the fact that HSM performs conditional deletion of messages, so if there are few copies of a message in the network, it also decreases the probability of quick delivery of message. However, the aforementioned setback is compensated as the transmission range is increased as nodes now have greater opportunities to make contact and share messages.

The performance of schemes by varying range.
5.3.4 Varying the message life time
Figure 12 shows the comparisons by increasing the message life time (TTL). With shorter lifetime, the message drop ratio is higher, thus decreased delivery ratio. The delivery ratio increases with the increase in lifetime of messages. However, when the message life time reaches a certain threshold, we see the gradual drop in delivery ratio. This is again due to the increase in message drop ratio, as the older messages are residing in the buffers for longer durations, they are deleted frequently to make room for new messages. The increasing life time has an obvious effect on latency, which increases as now messages can stay in buffers for longer durations. The proposed schemes exhibit minimum overhead compared to the baselines with the increase in TTL, as the number of delivered messages is greater, (13) produces lower overhead value.

The performance of schemes by varying message life time.
5.3.5 Performance comparison on real connectivity trace data
In Fig. 13, the simulations are performed with real-world connectivity traces. The trace datasets were collected under Haggle project during Infocom 2006 conference and are available at an online repository [50]. The parameters used for simulation are bandwidth: 250 kbps (2 Mbps), message size: 500 KB–1 MB, packet-lifetime: 500 min, number of nodes: 98, and buffer size: 10 MB. The data set is sparse, and frequently the nodes abort connections as they go out of range. As shown in Fig. 13, the performance of our proposed schemes outperforms the other schemes in delivery ratio due to better message utility predictions. However, this comes at a tradeoff slight performance loss in latency average and overhead ratio. It can be observed that the performance of the proposed schemes with real connectivity traces is consistent with the synthetic mobility models, which proves the validity and applicability of the proposed schemes in realist scenarios of opportunistic mobile data offloading.

The performance evaluation on real connectivity trace data
5.4 Verification results
The verification has been done by translating the HLPN models of the HSM, FAR, and UBS, to the respective NuSMV models written in the NuSMV language. The properties discussed in Section 3 are specified in the CTL. To verify the communication processes and the scalability, we have chosen a communication path in each of the models. The lengths of the paths have been scaled up progressively by increasing the number of nodes and messages. The paths have been verified in the presence of up to 100 nodes and 100 messages. Being a highly time-consuming procedure, the computation time is an important metric to consider for the verification of the schemes. Figure 14 demonstrates the computation time (in seconds) required to verify the property of the HSM, FAR, and UBS, by varying the number of (a) nodes with 20 messages (Fig. 14a), (b) messages with 30 nodes in (Fig. 14b), and (c) nodes and messages in Fig. 14c. The three schemes exhibit similar trends of increasing computation times in the results, in all of the cases. The reason behind the aforementioned phenomenon fact is that the lengths of the communication paths are simultaneously scaled up as well. Moreover, the number of combinations encompassing the variables and parameters considered in the models proliferate with the scaling.

Computation time of the proposed schemes by varying the number of a nodes, b messages, and c nodes and messages
The computation of the ICT in the HSM mandates higher computation time than the FAR. However, as the number of nodes and messages are increased simultaneously, the FAR exhibits a greater computation time than the HSM. This is due to the fact that the deletion of a message from a node’s buffer in the HSM can be comparatively quicker, due to the inherent conditional deletion. The UBS records the highest computation time. The reasons are as follows: (a) while the models of the HSM and FAR require a single execution path to corroborate the design limitation, the UBS requires each of the execution paths to be free of the limitation and (b) the implementation of the PML, aggregate utilities, and their sorting further adds to the processing time.
6 Conclusions and future work
In this work, we proposed three novel schemes for prediction-based data offloading in opportunistic environments. The communication processes in the presented schemes have been formally analyzed in detail, aided by the HLPNs. The presented schemes exploit the mobility patterns and the temporal contacts of the nodes to predict the future contact opportunities. The results assert that the schemes are ideal for the content dissemination in the dynamic and delay-tolerant data environments. The schemes are shown to outperform the existing schemes. The UBS, conceived to obliterate a design limitation common to the HSM and FAR, distinctly outperforms the existing schemes. The HSM and FAR have been formally verified against the design limitation using complete model checking, while the UBS is shown to eliminate the limitation. To verify the specifications in finite time, model checking optimizations have been used. The verification results affirm the scalability and correctness of the models of the HSM, FAR, and UBS. The work corroborates that the (a) HLPNs can be effectively exploited to depict the communication processes in the opportunistic environments and (b) formal verification can be capitalized upon to design efficient routing solutions. As a part of our future endeavors, we intend to design, model, analyze, and verify the platforms for opportunistic data transfer, content sharing, job distribution, and information search, in the IoT environments. We also aim at investigating modeling techniques that eliminate the requirement of model checking optimizations.
Abbreviations
- 3GPP:
-
Third Generation Partnership Project
- AL:
-
Acknowledgment list
- AP:
-
Access point
- AU:
-
Aggregated utility
- CD:
-
Contact duration
- CI:
-
Connection initiator
- CN:
-
Connected node
- CPN:
-
Colored Petri Nets
- CTL:
-
Computational tree logic
- DTN:
-
Delay tolerant networks
- FAR:
-
Forecast and relay
- HLPN:
-
High-level Petri Net
- HSM:
-
Hybrid scheme for message replication
- ICT:
-
Inter-contact time
- IoT:
-
Internet of Things
- KBPS:
-
Kilobits per second
- MB:
-
Megabytes
- ML:
-
Message list
- MSN:
-
Mobile social networks
- NuSMV:
-
New symbolic model verifier
- ONE:
-
Opportunistic network environment
- P2P:
-
Peer to peer
- PML:
-
Passed message list
- POI:
-
Point of interest
- RL:
-
Received list
- T2T:
-
Terminal to terminal
- TTL:
-
Time to live
- UBS:
-
Utility-based scheme
References
“IDC FutureScape: worldwide Internet of Things 2017 Predictions,” 20 Nov 2018. [Online]. Available: https://www.idc.com/research/viewtoc.jsp?containerId=US40755816
K. Bilal, O. Khalid, A. Erbad, S. Khan, Potentials, trends, and prospects in edge technologies: fog, cloudlet, mobile edge, and micro data centers. Comput. Netw. 130, 94–120 (2018)
F. Rebecchi, M.D. Amorim, V. Conan, A. Passarella, R. Bruno, M. Conti, Data offloading techniques in cellular networks: a survey. IEEE Commun. Surv. Tutorials 2, 17 (2015)
H. Zhou, H. Wang, X. Li, V.C.M. Leung, A survey on mobile data offloading technologies. IEEE Access 6, 5101–5111 (2018)
D. Xu, Y. Li, X. Chen, J. Li, P. Hui, S. Chen, J. Crowcroft, A survey of opportunistic offloading. IEEE Commun. Surv. Tutorials (2018). https://doi.org/10.1109/COMST.2018.2808242
I. Rhee, M. Shin, S. Hong, K. Lee, S.J. Kim, S. Chong, On the levy-walk nature of human mobility. IEEE/ACM Trans. Network. (TON) 19(3), 630–643 (2011)
C. Song, Z. Qu, N. Blumm, A.L. Barabási, Limits of predictability in human mobility. Science 327, 1018–1021 (2010)
F. Xia, J. Wang, X. Kong, Z. Wang, J. Li, C. Liu, Exploring human mobility patterns in urban scenarios: a trajectory data perspective. IEEE Commun. Mag. 56(3), 142–149 (2018)
S. Ali, G. Rizzo, V. Mancuso, M.A. Marsan, in IEEE Conference on Computer Communications (INFOCOM). Persistence and availability of floating content in a campus environment (2015)
S. Trifunovic, S.T. Kouyoumdjieva, B. Distl, A decade of research in opportunistic networks: challenges, relevance, and future directions. IEEE Commun. Mag. 55(1), 168–173 (2017)
Y.P.E. Wang, X. Lin, A. Adhikary, A. Grovlen, Y. Sui, Y. Blankenship, J. Bergman, H.S. Razaghi, A primer on 3GPP narrowband internet of things. IEEE Commun. Mag. 55(3), 117–123 (2017)
“DieselNet Trace Data,” [Online]. Available: http://traces.cs.umass.edu/index.php/Network/Network. [Accessed 20 Nov 2018]
A. Anjum, S.R. Malik, K.R. Choo, A. Khan, N. Ahmad, B. Raza, An efficient privacy mechanism for electronic health records. Comput. Secur. 72, 196–211 (2018)
W. Reisig, G. Rozenberg, Lectures on Petri Nets I: Basic models, advances in Petri Nets, Vol. 1491 (Springer, Berlin, 1998)
“Cisco visual networking index: global mobile data traffic forecast update, 2016–2021 White Paper,” 20 Nov 2018. [Online]. Available: https://www.cisco.com/c/en/us/solutions/collateral/service-provider/visual-networking-index-vni/mobile-white-paper-c11-520862.html
T. Wang, P. Li, X. Wang, Y. Wang, T. Guo, Y. Cao, A comprehensive survey on mobile data offloading in heterogeneous network. Wirel. Netw, 1–12 (2017). https://doi.org/10.1007/s11276-017-1576-0
W.C. Ahn, S.H. Chung, SDN-based mobile data offloading scheme using a femtocell and WiFi networks. Mob. Inf. Syst. 2017, 1–15 (2017)
N. Cheng, N. Lu, N. Zhang, X. Zhang, X.S. Shen, J.W. Mark, Opportunistic WiFi offloading in vehicular environment: a game-theory approach. IEEE Trans. Intell. Transp. Syst. 17(7), 1944–1955 (2016)
M.H. Cheung, J. Huang, Dawn: Delay-aware Wi-Fi offloading and network selection. IEEE J. Sel. Areas Commun. 33(6), 1214–1223 (2015)
N. Cheng, N. Lu, N. Zhang, X.S. Shen, J.W. Mark, in In 2014 IEEE Global Communications Conference (GLOBECOM). Opportunistic WiFi offloading in vehicular environment: a queueing analysis (2014)
Y. Onoue, M. Tamai, K. Yasumoto, in 2014 IEEE 79th Vehicular Technology Conference (VTC). Spring. Energy-constrained Wi-Fi offloading method using prefetching (2014)
Z. Lu, X. Sun, T.L. Porta, Cooperative data offload in opportunistic networks: from mobile devices to infrastructure. IEEE/ACM Trans. Networking 25(6), 3382–3395 (2017)
X. Bao, Y. Zhang, J. Ding, M. Song, Offloading cellular traffic through opportunistic networks: a Stackelberg-Game perspective (11th International Conference on Computer Science & Education (ICCSE), Nagoya, 2016)
H. Deng, I.-H. Hou, Online scheduling for delayed mobile offloading (IEEE Conference on Computer Communications (INFOCOM, Kowloon, 2015)
L. Valerio, F.B. Abdesslemy, A. Lindgreny, A. Passarella, M. Luoto, Offloading cellular traffic with opportunistic networks: a feasibility study (14th Annual Mediterranean Ad Hoc Networking Workshop (MED-HOC-NET), Vilamoura, 2015)
L. Valerio, R. Bruno, A. Passarella, Cellular traffic offloading via opportunistic networking with reinforcement learning. Comput. Commun. 71, 129–141 (2015)
B. Han, P. Hui, A. Kumar, M.V. Marathe, J. Shao, A. Srinivasan, Mobile data offloading through opportunistic communications and social participation. IEEE Trans. Mob. Comput. 11(5), 821–834 (2012)
A. Lindgren, A. Doria, E. Davies and S. Grasic, “Probabilistic routing protocol for intermittently connected networks,” 20 Nov 2018. [Online]. Available: http://tools.ietf.org/html/rfc6693
O. Khalid, R.N.B. Rais, S.A. Madani, Benchmarking and modeling of routing protocols for delay tolerant networks. Wirel. Pers. Commun. 94(3), 859–888 (2017)
C. Shi, M.H. Ammar, E.W. Zegura, M. Naik, Computing in cirrus clouds: the challenge of intermittent connectivity (2012)
S. Pal, T. Henderson, in 8th ACM MobiCom Workshop on Challenged Networks. MobOCloud: extending cloud computing with mobile opportunistic networks (2013)
D. Zeng, S. Guo, I. Stojmenovic, S. Yu, in 8th IEEE Conference on Industrial Electronics and Applications. Stochastic modeling and analysis of opportunistic computing in intermittent mobile cloud (2013)
R. Beraldi, K. Massri, H. Alnuweiri, in International Conference on P2P, Parallel, Grid, Cloud and Internet Computing. Erasure-coding based dissemination protocol for mobile clouds (2013)
C. Shi, V. Lakafosis, M.H. Ammar, E.W. Zegura, in 13th ACM International Symposium on Mobile Ad Hoc Networking and Computing. Serendipity: enabling remote computing among intermittently connected mobile devices (2012)
Y. Wang, J. Wu, W. Yang, Cloud-based multicasting with feedback in mobile social networks. IEEE Trans. Wirel. Commun. 12(12), 6043–6053 (2013)
M. Musolesi, C. Mascolo, CAR: Context-aware adaptive routing for delay-tolerant mobile networks. IEEE Trans. Mob. Comput. 8(2), 246–260 (2009)
A. Balasubramanian, B.N. Levine, A. Venkataramani, in IEEE/ACM Trans Networking (TON), Vol. 18, no. Replication routing in DTNs: a resource allocation approach (2010)
J. Ott, A. Keränen, E. Hyytiä, in 3rd Extreme Conference on Communication: The Amazon Expedition. BeachNet: propagation-based information sharing in mostly static networks (2011)
Y. Li, P. Hui, D. Jin, L. Su, L. Zeng, in IEEE International Conference on Communications. Performance evaluation of routing schemes for energy-constrained delay tolerant networks (2011)
K. Akkarajitsakul, E. Hossain, D. Niyato, Cooperative packet delivery in hybrid wireless mobile networks: a coalitional game approach. IEEE Trans. Mob. Comput. 12(5), 840–854 (2013)
Y. Wang, H. Wang, C. Xia, in International Conference on Computational and Information Sciences. An anycast communication model for opportunistic network (2011)
V. Mahendran, R. Gunasekaran, C. Murthy, in IEEE Transactions on Mobile Computing. Performance modeling of delay-tolerant network routing via queueing petri nets (2013)
M. Jung, K. Han, J. Cho, Advanced verification on WBAN and cloud computing for u-health environment. Multimed. Tools Appl. 74, 1–18 (2014)
O. Khalid, S.U. Khan, S.A. Madani, K. Hayat, L. Wang, D. Chan, R. Ranjan, in Handbook on Data Centers. Opportunistic databank: a context-aware on-the-fly data center for mobile networks (Springer-Verlag, New York, 2015)
“NuSMV Overview,” [Online]. Available: http://nusmv.fbk.eu/NuSMV/index.html. [Accessed 20 Nov 2018]
“NuSMV 2.5 User Manual,” [Online]. Available: http://nusmv.fbk.eu/NuSMV/userman/v25/nusmv.pdf. [Accessed 20 Nov 2018]
P. Arcaini, A. Gargantini, E. Riccobene, in Software Testing, Verification and Reliability. Using mutation to assess fault detection capability of model review (2014)
A. Keränen, J. Ott and T. Kärkkäinen, “The ONE simulator for DTN protocol evaluation,” [Online]. Available: https://akeranen.github.io/the-one/. [Accessed 20 Nov 2018]
“OpenJUMP,” [Online]. Available: http://www.openjump.org/. [Accessed 20 Nov 2018]
“Infocom06 connectivity trace dataset,” [Online]. Available: https://crawdad.org/uoi/haggle/20160828/one/. [Accessed 1 Dec 2018]
Funding
There is no specific funding to support this work.
Availability of data and materials
The dataset that we used for analysis is hosted online by the contributors on the following URLs:
DieselNet Fall 2007. DieselNet Fall 2007 - AP Connectivity. URL: http://traces.cs.umass.edu/index.php/Network/Network
Author information
Authors and Affiliations
Contributions
AG is the primary contributor in drafting the paper. OK contributed in designing the mobile data offloading strategies. RNBR performed the critical technical review and suggested the improvements in proposed strategies. SURM contributed in formulating the formal verification section. IAK and AR contributed in reviewing, editing, and verifying the draft for English or technical anomalies. All authors read and approved the final manuscript.
Corresponding author
Ethics declarations
Authors’ information
Ankan Ghosh received a B.Tech. degree in Electronics and Communication Engineering, from WBUT, WB, India. Currently, he pursued his M.S. degree, from the North Dakota State University, Fargo, ND, USA. His research interests include the wired, wireless, opportunistic, and mobile networks, modeling, and verification.
Osman Khalid completed Masters in Computer Engineering from CASE—Pakistan, and Ph.D. from North Dakota State University, Fargo, USA. He is Assistant Professor in COMSATS University, Pakistan. His areas of research include Internet of Things (IoT), Fog Computing, opportunistic networks, recommendation, trust, and reputation systems. His website is http://osman.pakproject.com
Saif U. R. Malik received his MS degree from COMSATS Institute of Information Technology, Islamabad, Pakistan, and a PhD from the North Dakota State University, Fargo, ND, USA. His primary research interests include formal verification, modeling, cyber physical systems, cloud computing systems, routing protocols, and HPC.
Rao N. B. Rais received his MS and PhD degrees in Computer Engineering with specialization in Networks and Distributed Systems from University of Nice, Sophia Antipolis, France in 2007 and 2011 respectively. Before that, he got BE in Computer Systems from National University of Science and Technology, Pakistan in 2002. He is currently working as Associate Professor of College of Engineering and Information Technology, Ajman University, Ajman, UAE.
Imran A. Khan received his PhD from China. He is serving as Associate Professor in computer sciences department, COMSATS University. His research interests include, distributed computing and wireless ad hoc networks.
Amjad Khan did is Ph.D. from Universiti Teknologi Malaysia, Malaysia. He is Assistant Professor and Chairman MIS Department COBA Al Yamamah University Riyadh 11512 Saudi Arabia.
Competing interests
The authors declare that they have no competing interests.
Publisher’s Note
Springer Nature remains neutral with regard to jurisdictional claims in published maps and institutional affiliations.
Appendix
Appendix
Here, we explain the notations and detailed transitions involved in the communication processes of the three proposed schemes.
1.1 Notations and transitions details for HSM scheme
The acronyms considered in the tables in this section are: acknowledgment (ACK), communicating nodes (Com-N), destination (D), and with respect to (w.r.t).
Equation (14) shows the pre-conditions and post conditions of the successful firing of transition C_S_D, when the connection is successfully established with the peer node. The specific details of this transition are mentioned in Section 4.3. The below equation details the transition C_S_D shown in Fig. 3.
In the above formula, the connectivity between the CI and CN is checked through the function conn and information is exchanged for a successful connection. The functions M _ L, Rcvd _ L, and Ackn _ L provide access to the MLs, RLs, and Als of the communicating nodes that are placed at Msg _ L, Rec _ L, and Ack _ L, respectively. The function Avlbl _ Buff furnishes the available space in the buffers of the communicating nodes from Buff. In (14), the CI deletes those M_IDs from the ML whose life-times did not expire and that are in the (a) RL of the CN and (b) AL of the CN. The function Size returns the total size of the messages deleted through (a) and (b). The buffer space is updated accordingly. Finally, the CI sends those messages from its ML that are destined for the CN. The CN adds the M_IDs of the incoming messages to its RL. On receiving the ACKs, the CI adds the M_IDs of the sent messages to its AL, removes them from the ML, and updates the buffer space accordingly.
Subsequently, the CN will execute the same process (14) on the CI. The exchange of the messages that are destined for the two nodes is complete. The N_IDs of the two nodes and the attributes of the remaining messages in the ML of the CI are passed to R _ Info to commence the replication in (14). The replications require the computation of the CD- and ICT-based utilities. Therefore, C _ CD and C _ ICT are fired. The pre/post conditions of the successful contact duration transition is mentioned in the below equation.
The pre/post conditions of the successful inter-contact time transition is mentioned in the below equation. This transition is shown in the petri net of HSM in Fig. 3.
In (15) and (16), the information on the nodes and messages is extracted to CD and ICT from R _ Info, and the functions Comp _ CD and Comp _ ICT are used to compute the CD- and ICT-based utilities. The computed utilities of the communicating nodes with the destinations of the remaining messages in the ML of the CI are recorded in CD and ICT. The messages are processed one by one and the utilities are made available at R _ Info. Rel is fired to initiate the replication. The pre/post conditions of message relay transition are shown in below equation. This is the transition as defined in the Fig. 3 of the petri net model of HSM.
The replication process is instantiated in (17), aided by the information on the communicating nodes, messages, and the utilities, made available at R _ Info through (14), (15), and (16). The MLs and buffers of the communicating nodes are accessed from Msg _ L and Buff, through the functions M _ L and Avlbl _ Buff, respectively. The function Buff _ Size is used to retrieve the buffer sizes of the nodes.
In (17), each of the remaining messages in the ML of the CI whose life-times did not expire and that are not in the ML of the CN are processed for replication. Only the messages that are smaller in size, as compared to the buffer size and the available buffer space of the CN, are processed. A message is conditionally replicated on the CN if and only if the (a) CD-based utility of the CN is higher than that of the CI or (b) if both of the utilities (CD- and ICT-based) of the CN are higher than that of the CI. The corresponding M_ID is added to the ML of the CN and after the buffer space is updated, an ACK is sent to the CI. For the case (b), on receiving the ACK, the M_ID is conditionally deleted from the ML of the CI, and its buffer space is updated accordingly. If the CN cannot accommodate an incoming message due to the lack of space in the buffer, the function Del _ Old _ Msgs _ Until _ Spc is used to delete the older messages to create space. The message is accommodated after the space is created in the buffer. Thereafter, the CN executes the process (17), on the CI.
After the communication between the CI and CN is completed, the CI looks for the availability of the remaining CNs in Con _ N. The same procedures are instantiated with each one of the CNs. All of the abovementioned processes will be repeated for each of the CIs in the network (through the presented formulae). Therefore, the model captures the behavior of all of the nodes in the network. Evidently, the model does not check if an incoming message to a node had been previously replicated by the node.
1.2 Notation meanings and transitions details for FAR scheme
Apart from the acronyms declared previously, the meeting quality (MQ) is the only acronym introduced in Tables 6 and 7.
The below Eq. (18) shows the pre/post conditions of message relay transition for FAR protocol as shown in the petri net model of Fig. 4.
The information on the communicating nodes, messages, and forecasted meeting qualities are passed to R _ Info. Subsequently, Rel is fired. In (18), the only differences as compared to the replication process of the HSM in (17) are (a) a message is replicated by the CI on the CN, if and only if the CN bears a better forecasted meeting quality with the destination of the message, instead of the CD- and ICT-based utilities in (17) and (b) there is no conditional deletion. The rest of the process is the same as (17). Again, the model does not check if an incoming message to a node had been previously replicated by the node.
1.3 Notation meanings and transitions details for UBS scheme
Equation (19) shows the pre/post conditions of the petri net model depicted in Fig. 5.
In (19), the subtracted aggregate utility values of the CI and CN for each of the messages in the ML of the CI are the inputs to the function AU _ SSA. The function sorts the values in an ascending order and stores them at R _ Info. The function PM _ L provides access to the PMLs of the communicating nodes, placed at PML. The function Update _ N1 _ ML reorders the ML of the CI according to the sorted aggregate utilities, and is introduced in the model.
Rights and permissions
Open Access This article is distributed under the terms of the Creative Commons Attribution 4.0 International License (http://creativecommons.org/licenses/by/4.0/), which permits unrestricted use, distribution, and reproduction in any medium, provided you give appropriate credit to the original author(s) and the source, provide a link to the Creative Commons license, and indicate if changes were made.
About this article

Cite this article
Ghosh, A., Khalid, O., Rais, R.N.B. et al. Data offloading in IoT environments: modeling, analysis, and verification. J Wireless Com Network 2019, 53 (2019). https://doi.org/10.1186/s13638-019-1358-8
Received:
Accepted:
Published:
DOI: https://doi.org/10.1186/s13638-019-1358-8