
Abstract
Background
Intracerebral inoculation of extracts from post-mortem human Alzheimer’s disease brains into mice produces a prion-like spreading effect of amyloid-β. The differences observed between these extracts and the synthetic peptide, in terms of amyloid-β internalization and seed and cell-to-cell transmission of cytosolic protein aggregates, suggest that brain extracts contain key contributors that enhance the prion-like effect of amyloid-β. Nevertheless, these potential partners are still unknown due to the complexity of whole brain extracts.
Methods
Herein, we established a method based on sequential detergent solubilization of post-mortem samples of human brains affected by Alzheimer’s disease that strongly enrich amyloid-β aggregates by eliminating 92% of the remaining proteins. Internalization of Aβ1–42 from the enriched AD extracts was evaluated in vitro, and internalization of fluorescent-labeled AD extracts was also investigated in vivo. Furthermore, we carried out a molecular characterization of the Aβ-enriched fraction using label-free proteomics, studying the distribution of representative components in the amygdala and the olfactory cortex of additional human AD brain samples by immunohistochemistry.
Results
Aβ1–42 from the enriched AD extracts are internalized into endothelial cells in vitro after 48 h. Furthermore, accumulation of fluorescent-labeled Aβ-enriched extracts into mouse microglia was observed in vivo after 4 months of intracerebral inoculation. Label-free proteomics (FDR < 0.01) characterization of the amyloid-β-enriched fraction from different post-mortem samples allowed for the identification of more than 130 proteins, several of which were significantly overrepresented (i.e., ANXA5 and HIST1H2BK; p < 0.05) and underrepresented (i.e., COL6A or FN1; p < 0.05) in the samples with Alzheimer’s disease. We were also able to identify proteins exclusively observed in Alzheimer’s disease (i.e., RNF213) or only detected in samples not affected by the disease (i.e., CNTN1) after the enrichment process. Immunohistochemistry against these proteins in additional tissues revealed their particular distribution in the amygdala and the olfactory cortex in relation to the amyloid-β plaque.
Conclusions
Identification and characterization of the unique features of these extracts, in terms of amyloid-β enrichment, identification of the components, in vitro and in vivo cell internalization, and tissue distribution, constitute the best initial tool to further investigate the seeding and transmissibility proposed in the prion-like hypothesis of Alzheimer’s disease.
Background
Alzheimer’s disease (AD) is the main cause of dementia worldwide [1, 2]. From a neuropathological point of view, Alzheimer’s disease (AD) is characterized by the deposition of insoluble forms of amyloid-β (Aβ) in the brain parenchyma and abnormal hyperphosphorylation of tau protein, forming, respectively, plaques and neurofibrillary tangles [3]. Even though these pathological features are well-known, the etiology of the disease is still unknown. Together with the accepted amyloid hypothesis [4, 5], the prion-like hypothesis is gaining strength to explain the etiology of neurodegenerative diseases characterized by proteinopathies—such as AD [6], whose initial stages reportedly begin in the mesial temporal structures [7]. This hypothesis is based on the capacity of Aβ to induce abnormal folding of native adjacent proteins and cell-to-cell propagation of Aβ and tau, resembling a prion-like seeding and spreading mechanism [8]. This idea is supported by the fact that inoculation of human brain extracts obtained either from patients with AD [9,10,11] or from APP23 mice [12] into transgenic mice [9,10,11,12] or marmosets (Callithrix jacchus) [13] induces the development of diffuse plaques far from the injection site [9, 10].
Prion-like spreading of AD appears to follow a three-step process. First, after injection of AD extracts, the seeds (mostly oligomers and protofibrils) are internalized by using a variety of mechanisms [14]. Second, internalized seeds nucleate the fibrillation of native monomers in the cytoplasm of the recipient cell, and a positive feedback loop starts [15]. Finally, cell-to-cell transmission of cytosolic protein aggregates starts after their release into the extracellular space in their “naked” form [15]. Different proteomic analyses have been performed using Aβ-enriched extracts [16,17,18,19,20,21,22] and micro-dissected plaques coupled with LC-MS/MS [23,24,25,26], in order to identify additional components which may be relevant to both transmissibility and seeding process. Usually, AD brain extracts are inoculated directly into the brain of APP23 [10, 11] or tg2576 transgenic mice [9] to evaluate the prion-like hypothesis. To our knowledge, none of the published studies has assessed the possibility of injection of fractions enriched with Aβ plaques. This study proposes a method that strongly enriches Aβ aggregates from human AD samples while retaining their ability to internalize Aβ in vitro and in vivo. Proteomic characterization of these extracts revealed the presence of several proteins either over- or underrepresented in AD-enriched fractions, which may contribute to plaque integrity and/or Aβ internalization.
Materials and methods
Human brain samples
Human tissue blocks were provided by biobanks IDIBAPS (Barcelona), BT-CIEN (Madrid), and BIOBANC-MUR (Murcia). Experimental procedures were approved by the Ethical Committee for Clinical Research of the Ciudad Real University Hospital. Twelve human brain samples containing the olfactory cortex, amygdala, and hippocampus were used (five diagnosed AD cases, six cases with no AD diagnosis, and one case with incidental plaques but no AD diagnosis; Additional file 1: Table S1). The exact locations of the brain sections used in this study are shown in Additional file 2: Figure S1.
Enrichment of Aβ plaque-containing fractions from human brains
To obtain Aβ-enriched fractions, we used two samples from human brains with no AD diagnosis, two cases diagnosed as AD (stage VI), and one case with incidental Aβ plaques but no AD diagnosis (Additional file 1: Table S1). Approximately 10 g from each sample was cut into 1-cm3 blocks and homogenized in lysis buffer (20 mM Tris pH 7.4, 100 mM NaCl and 5 mM CaCl2) supplemented with protease inhibitor. Homogenization was performed on a mechanical homogenizer on ice. The homogenates were incubated on ice with DNase I. An efficient enrichment of Aβ plaques from the human brain was achieved using a protocol based on four centrifugation steps using Triton X (1%) and SDS (1.75%) followed by acetone precipitation (Additional file 2: Figure S2A). This protocol was applied to two human brain samples with no evidence of AD pathology (non-AD; n = 2), samples from two AD patients (AD; n = 2), and also one sample from a patient with diffuse plaques but no evidence of AD (DP; n = 1), for comparison. An overview of the process is shown in Additional file 2: Figure S2A. The resulting precipitate was resuspended in Hank’s solution and stored at − 20 °C.
Determination of the efficacy of Aβ enrichment
The Aβ1–42 content (the major component of Aβ plaques in the brain parenchyma) of the fractions was examined with dot blot (Additional file 2: Figure S2B-C) and western blot (Fig. 1A). Dot blot was carried out with 1 μl of each fraction resulting from the enrichment procedure, which was set on PVDF membranes. PVDF membranes were dried during 2 h at 60 °C and blocked with 5% BSA (VWR, Solon; OH, USA) in TTBS (200 mM Tris-HCl pH 8.8, 6 mM NaCl and 1% Tween20) for 1 h at room temperature. Membranes were blotted with Aβ1–42 (1:5000) and tau (1:1000) antibodies. For western blot, all the protein extracts were quantified using bicinchoninic acid assay (BCA; Sigma Aldrich). Sixty micrograms of protein for each sample (all supernatants and pellet) was prepared using 12.5-μL sample buffer (Bio-Rad), 2.5-μL reducing buffer (Bio-Rad), and deionized water, and boiled for 5 min. Samples were electrophoresed on Criterion™ XT Precast Gel 12% Bis-Tris (Bio-Rad) with XT MES running buffer (Bio-Rad) at 180 V for 45 min. The proteins were transferred to a PVDF membrane (Bio-Rad) for 50 min at 0.25 mA constant in transfer buffer (50 mM Tris-HCL, pH 8.8, 192 mM glycine, 0.02% SDS and 20% methanol). Membranes were stained with ponceau red and destained with 1% acetic acid and blocked in 5% BSA in TTBS for 1 h at room temperature and then incubated with Aβ1–42 antibody (1:1000; 2.5% BSA in TTBS) overnight at 4 °C. After secondary antibody incubation, the membranes were washed with TTBS and developed with Clarity Western ECL substrate according to the manufacturer’s directions. To evaluate the effectiveness of the enrichment Aβ1–42, western blot results were compared with Coomassie blue staining of 20 μg of all the fractions by quantifying the ratio with ImageJ.
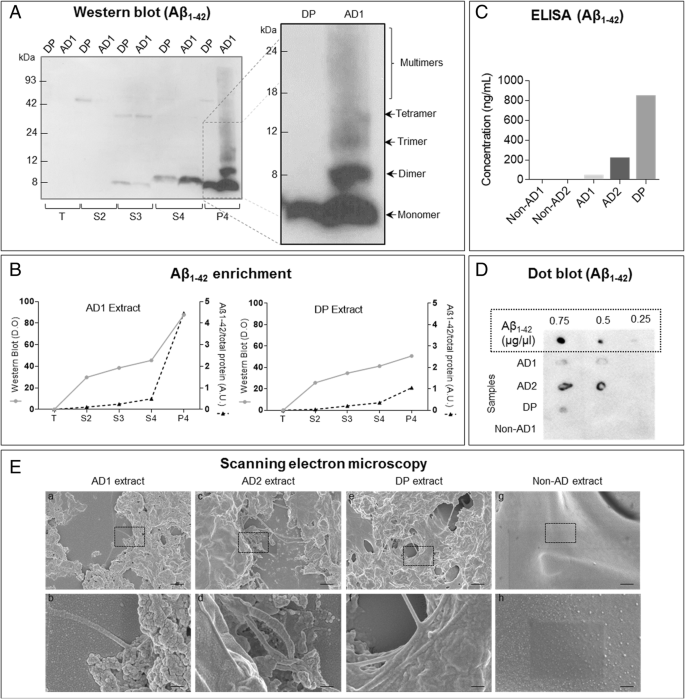
Quantification and evaluation of the Aβ-enriched extracts. a Western blot of AD sample 1 (AD1) and diffuse plaque sample (DP) using Aβ1–42 antibody. The last fraction enriched in Aβ plaques is shown boxed in order to identify Aβ monomer (4-kDa band), dimers, and multimers. b Ratio between western blot signal and Coomassie blue staining that reflects Aβ enrichment in the fractions. c ELISA of Aβ1–42 carried out with non-AD (non-AD1 and non-AD2), AD (AD1 and AD2), and DP samples. c Dot blot on the enriched extracts (P4) of the samples previously analyzed with western blot and ELISA. SEM images of AD1 extracts (a, b), AD2 extracts (c, d), DP extracts (e, f), and non-AD extracts (g, h). Scale bars: a, c, e, g, 1 μm and b, d, f, h, 200 nm
Quantification of Aβ1–42 contents in the enriched fraction
Quantification of the Aβ contents in the final enriched fraction was done by dot blot and ELISA after sonicating the samples. ELISA was performed using an Aβ42 Human ELISA Kit (Invitrogen; Vienna, Austria) following the manufacturer’s instructions. The samples were sonicated (Branson Ultrasonics™ Sonifier™ SFX150) for 1 min. Dot blot was performed as described previously using different dilutions of the extract and dilutions of the synthetic Aβ1–42 peptide with known concentrations.
Scanning electron microscopy (SEM)
The presence of aggregates in the Aβ-enriched extracts was confirmed by SEM after sonication. The homogenates were diluted in methanol and centrifuged at 16100g for 10 min at 4 °C, twice. The resulting pellets were resuspended in pure methanol, then deposited in silicon and left to dry. Samples were metallized with gold chips and observed using a Zeiss GeminiSEM 500 scanning electron microscope.
In vitro Aβ1–42 internalization into endothelial cells
Internalization of Aβ1–42 from enriched extracts was examined in vitro. As endothelial cells are the first to interact with the circulating Aβ, we used for these studies the endothelial cell line bEnd.3 (ATCC CRL-2299). Cells were cultured in DMEM containing 10% fetal bovine serum (FBS) and 1% antibiotic/antimycotic, at 37 °C and 5% CO2. They were then seeded in eight-well μ-Slides (Ibidi, Martinsried, Germany) and incubated with AD and non-AD extracts. After 48 h, cells were fixed and permeabilized in 4% paraformaldehyde (PFA). To analyze Aβ incorporation, cells were sequentially incubated with Aβ1–42 antibody (1 h) and AlexaFluor® 488-conjugated anti-mouse antibody (1 h). Cells were co-stained with 1 μg/ml Hoechst and ActinRed™ 555 and examined using an LSM 800 confocal microscope (Zeiss; Jena, Germany) with a × 63 objective.
In vivo microinjection of Aβ-enriched fractions
In vivo experiments were carried out with female C57BL/6J mice (000654, The Jackson Laboratory, USA). Three different experimental groups were established: saline microinjection (n = 6), human non-AD extract microinjection (n = 6), and human AD Aβ-enriched extract microinjection (n = 6). Animals were anesthetized using vaporized isoflurane. The animals were placed in a Kopf (Tujunga, CA) stereotaxic apparatus, and the skull trepanned at the injection spot into the dorsal part of the left anterior olfactory nucleus (AONd, coordinates from Bregma [27] were AP = + 2.8 mm, L = 1 mm, and depth = − 2.75 mm, from the dura mater). This structure was chosen because it is preferentially vulnerable and directly involved in Aβ aggregation [28, 29]. Next, saline, 6 μg/μl of human non-AD and 6 μg/μl of human Aβ1–42-enriched extracts (all extracts were previously tagged with AlexaFluor® 488 nm [green] labeling dye [Molecular Probes]) were injected in a constant infusion (0.2 μl/min) for 10 min using a microsyringe (10 μL Neuros Model 1701 RN, point style 4, SYR, Hamilton Co., Nevada, USA). Animals were kept on the stereotaxic apparatus for additional 5 min to favor the diffusion of the extract before removing the syringe. The animals were housed on a standard 12/12 h light/dark cycle, at 21 °C with food and water ad libitum. All the animal research procedures described herein were in agreement with European (Directive 2010/63/EU) and Spanish (RD 53/2013) legislation on the protection of animals used for scientific purposes. All experiments described were approved by the Ethical Committee for Animal Research of the University of Castilla-La Mancha (SAF2016-75768-R).
Isolation of mouse brain for immunostaining
Four months after injection, animals were anesthetized with a mixture of ketamine hydrochloride (1.5 mL/kg, 75 mg/kg, Ketolar, Madrid, Spain) and xylazine (0.5 mL/kg, 10 mg/kg, Xilagesic, Calier, Barcelona, Spain) and perfused with saline solution followed by 4% w/v para-formaldehyde fixative (phosphate-buffered; 0.1 M sodium phosphate, pH 7.2). Brains were post-fixed in 4% w/v paraformaldehyde, cryo-protected in 30% w/v sucrose, and coronally sectioned (50 μm) employing a freeze sliding microtome. To visualize the injection site, sections were counterstained with DAPI. To study the extracts injected into the AONd, saline, human non-AD extracts, and human Aβ1–42-enriched extracts were tagged with AlexaFluor® 488 nm (green) dye, following the manufacturer’s instructions. Immunofluorescence labeling against Iba-1 (1:1000) and AlexaFluor® 568 nm (1:200) was performed in order to detect microglia.
Label-free proteomics of human brain extracts
For proteomics analysis, two AD samples, two non-AD samples, and one corresponding to a patient with pre-amyloid diffuse plaques but without evidence of AD were used (all samples were enriched as described in the previous section). The protein extracts (150 μg per sample) were concentrated on gel and analyzed by reverse phase liquid chromatography-tandem mass spectrometry (RP-LC-MS/MS) using an Easy-nLC II system coupled to a linear ion trap mass spectrometer model LTQ (Thermo Scientific) as previously described [30]. The MS/MS raw files were searched against the Uniprot–Human proteome database (70,931 entries in January 2019) (http://www.uniprot.org) using the SEQUEST algorithm (Proteome Discoverer 1.4, Thermo Scientific). The following constraints were used for the searches: tryptic cleavage after Arg and Lys, up to two missed cleavage sites, and tolerances of 1 Da for precursor ions and 0.8 Da for MS/MS fragment ions and the searches were performed allowing optional Met oxidation and Cys carbamidomethylation. A false discovery rate (FDR < 0.01) and at least two peptides per protein was considered as a condition for successful peptide assignments. For the semiquantitative analysis of proteins, the total number of peptide-spectrum matches (PSMs) for each protein was normalized against the total number of PSMs in each sample and compared between AD and non-AD samples using the chi-square test (p < 0.05).
Gene ontology analysis study was carried out with the proteomic profiles obtained for both AD and non-AD-enriched extracts to identify overrepresentation profiles. To that end, we use GOrilla (http://cbl-gorilla.cs.technion.ac.il; [31]), a bioinformatics tool previously used in several studies (i.e., [32]). As a background, we used the most recent database of a global quantitative analysis of the human brain proteome in Alzheimer’s disease, extracted from [33] (16,559 recognized proteins in GOrilla; database updated June 2019). We set p value to 10− 6 in order to avoid unreliable data. Gene ontology was investigated at three levels: biological process, biological function, and biological component.
Immunofluorescence and immunohistochemical procedures
Immunofluorescence analysis was performed in 4% phosphate-buffered formaldehyde-fixed samples. Afterwards, all blocks were post-fixed in fresh 4% phosphate-buffered paraformaldehyde for 45 days. Coronal sections of the amygdala, olfactory cortex, and hippocampus (50 μm) were obtained using a freezing sliding microtome Microm HM 450. For these experiments, a total of six antibodies against Aβ1–42, RNF213, COL6A, ANXA5, CNTN1, and GFAP were used (Additional file 1: Table S2). Tissue antigenicity was unmasked by boiling the tissue under pressure for 2 min in citrate buffer. Sections were immersed in formic acid for 3 min and rinsed in phosphate buffer. Endogenous peroxidase activity was inhibited by a 30-min bath in 1% H2O2 in phosphate-buffered saline. Blocking consisted of 5% NDS+ 0.3% Triton X-100 in PBS. Sections were incubated overnight at 4 °C with primary antibodies containing 0.3% Triton X-100 and 5% normal serum in phosphate-buffered saline. Controls included omitting primary or secondary antibodies. Sections were counterstained using DAPI (Santa Cruz Biotechnology; Inc.; Sc-3598) or Nissl and coverslipped with PVA-DABCO or DPX after dehydrating. Human tissue autofluorescence was not reduced. Images were captured using an LSM 800 confocal microscope and analyzed using ZEN software.
Results
Detergent-centrifugation method allows efficient enrichment of insoluble Aβ1–42
The presence of Aβ1–42 in the five samples during the different steps was monitored by dot blot [Additional file 2: Figure S2B (non-AD1, AD1 and DP) and Additional file 2: Figure S2C (non-AD2 and AD2)]. As expected, the results showed no Aβ1–42 in the non-AD samples. The SDS 1.75% supernatants (S3–S4) showed immunostaining both in AD and DP samples, suggesting that part of the soluble Aβ1–42 was diluted using this concentration of SDS. In AD samples, the pellet from the last step was extremely difficult to reconstitute and showed a strong Aβ1–42 signal (probably corresponding to the Aβ plaques). Interestingly, the DP samples did not show reactivity in the insoluble fraction (Additional file 2: Figure S2B), and tau protein was mainly eliminated in the second wash with SDS (Additional file 2: Figure S2D). A 4-kDa band was observed with strong immunoreactivity against Aβ1–42 in the last fraction of the AD and DP samples (Fig. 1A), probably corresponding to monomeric Aβ1–42. Aβ1–42 dimers, trimers, and oligomers appeared only in the AD samples (Fig. 1A, right), indicating that AD and DP experience different aggregation strengths.
Estimation of Aβ1–42 enrichment (Fig. 1B) was attempted by comparing western blot and Coomassie blue staining (Additional file 2: Figure S2E). In AD samples, the concentration of Aβ1–42 increased according to the ratio western blot/Coomassie blue staining (Fig. 1B, left). In the DP sample, the ratio did not change (Fig. 1B, right). In order to accurately quantify Aβ1–42 concentration, a human Aβ1–42 ELISA (Invitrogen; Fig. 1C) was performed. Despite the sensitivity of the kit, non-AD samples did not show immunoreactivity against Aβ1–42. It is especially relevant that although AD samples contained 50 ng/mL (AD1) and 210 ng/mL (AD2) of Aβ1–42, the DP sample showed a higher concentration of Aβ1–42 (over 0.8 μg/ml). This result is completely opposite to that obtained with western blot and dot blot. To quantify Aβ concentration in the extracts, dot blot with diluted concentrations of the Aβ-enriched fractions and known dilutions of synthetic Aβ1–42 [34] (Sigma Aldrich; Fig. 1D) was carried out. The results indicated a concentration of Aβ1–42 in the sample ranging from 0.1 to 0.5 μg/μL. Although we are aware that neither of the methods developed so far for insoluble Aβ1–42 quantification are accurate, the examination of our samples by electron microscopy revealed the presence of aggregates (with the presence of fibrils) in AD (Fig. 1E, a–d) and DP (Fig. 1E, e–f) sonicated extracts, which were not observed in non-AD samples (Fig. 1E, g–h).
Aβ internalization from the enriched fractions into cultured microvascular endothelial cells
Our Aβ plaque enrichment protocol was aimed at maintaining the plaque integrity and to preserve its prion-like properties. Therefore, we first evaluated the in vitro incorporation Aβ1–42 internalization into bEnd.3 cells were tested by adding AD-enriched extracts (a volume corresponding to approximately 1 μg of Aβ1–42 according to dot blot quantification) to the cell culture. Figure 2 shows immunofluorescence against the Aβ1–42 antibody and ActinRed™ 555 labeling after 48-h incubation with non-AD extracts (Fig. 2a) and Aβ-enriched extracts from AD1 (Fig. 2b, c) and AD2 (Fig. 2d, e). This strategy allowed us to visualize internalized Aβ1–42 in vesicle-like structures using confocal z-stacks (Fig. 2b–e). Additional file 3: Video S1. shows different angles of the Aβ1–42 internalized in the cell from Fig. 2b.

Immunofluorescence against Aβ1–42 in ActinRed™ 555-labeled endothelial cells (bEnd.3) after 48-h incubation with the enriched extracts. a Non-AD extracts. b, c Two representative cells after incubation with AD1-enriched extracts. d, e Two representative cells after incubation with AD2-enriched extracts. Z-stacks are shown on the top and right sides of each image. Pictures were acquired using a confocal microscope with a × 63 objective. Scale bars a–d = 10 μm
Additional file 3: Video S1 (MP4 2166 kb)
In vivo injection of Aβ plaque-enriched extracts in mouse brain and Aβ1–42 internalization
Aβ-enriched extracts tagged with AlexaFluor® 488 nm (green) were injected into the dorsal part of the anterior olfactory nucleus. Labeled saline injections (images not shown) did not reveal any fluorescence near the injection site. Inoculation with the extracts obtained non-AD sample allowed for the identification of the injection site, but no fluorescence was detected inside the cells (Fig. 3a, b). In contrast, the fluorescence of the sections 4 months after inoculation of Aβ1–42-containing extracts could be observed inside the cells closer to the injection location (Fig. 3c, d). Internalization of human Aβ extracts (green) in microglia was also examined using Iba-1 antibody (red; Fig. 3e). Figure 3f shows an Iba-1-positive cell within the z-stack.

Microinjection and internalization of Aβ1–42 in the dorsal anterior olfactory nucleus. Images show the region where the AlexaFluor 488-labeled extracts were injected. Human non-AD extracts (a, b) and human Aβ1–42-enriched extracts (c, d). Nuclei are shown in blue (DAPI), and labeled extracts appear in green. Images e and f correspond to the tissue of samples injected with labeled extracts (green) together with Iba-1 labeling (red). Z-stack images are also shown. Scale bars a, c = 130 μm, b = 20 μm, d = 40 μm, e = 10 μm, f = 3 μm. AO anterior olfatory nucleus (D, dorsal; L, lateral; M, medial; V, ventral)
Proteomic characterization of Aβ-enriched extracts
Next, the enriched fraction containing insoluble Aβ was characterized in order to identify possible protein components bound to the Aβ plaque that had not been observed in the non-AD extracts. To that end, proteomic analysis on enriched extracts of two AD and two non-AD samples was performed. Specifically, 149 and 133 proteins were identified in AD-enriched samples, and 144 and 131 in non-AD samples (Additional file 4: Table S3.) In AD samples, six of these proteins were overrepresented and three proteins were underrepresented (Table 1). Proteins that were exclusively detected in AD or non-AD extracts were also examined (Table 2; 1% FDR, target-decoy database approach). A total of 34 proteins were identified at least in one of the two AD samples, while 12 proteins were identified in the non-AD extracts, which probably correspond to proteins that decrease in AD-enriched extracts. Several proteins previously related to AD were identified as overrepresented in the Aβ-enriched fraction [APOE [35], ANXA2 [36], or MAPT [37]]. The rest of the identified proteins are shown in Table 2.
GO enrichment analysis was carried out with the proteins observed in the enriched samples of both AD and non-AD, using whole brain proteome as background. This study retrieved significant results when biological process was inquired (Additional file 2: Figure S3). Thus, negative regulation of wound healing and homeostasis were identified an AD while cell morphogenesis and cell junction assembly appeared in the non-AD samples.
Distribution of the proteins in the amygdala and olfactory cortex sections
GFAP, ANXA5, and COL6A expression was evaluated by immunofluorescence. Since proteomics had been performed in regions containing mostly amygdala (see Additional file 2: Figure S1), immunohistochemical experiments were performed in the same regions using additional AD samples. Furthermore, several of the proteins in the olfactory cortex area were also examined in order to evaluate whether the changes induced in AD could also be observed in this section of the brain—since olfactory deficits usually precede the clinical onset of cognitive and memory deficits in AD pathology [38]. GFAP expression was examined as a control of the enrichment process, since it has been previously shown to co-localize with the Aβ plaque in AD [39]. The results indicated that although there was co-localization between Aβ1–42 and GFAP, GFAP immunolabeling in AD could be observed in all the tissue (Fig. 4A). ANXA5 was also overrepresented in Aβ1–42 extracts. Immunostaining was higher in AD samples than in non-AD samples in both the amygdala (Fig. 4B) and the olfactory cortex (Additional file 2: Figure S4A). However, in contrast with GFAP, the ANXA5 signal increase was especially noticeable surrounding the plaques in human AD brain samples. As for COL6A, which was highly represented in non-AD samples, it also showed reduced immunostaining in AD samples (Fig. 4C).

Double immunofluorescence against Aβ1–42, and GFAP (A), Aβ1–42 and ANXA5 (B) and Aβ1–42 and COL6A (C). Confocal images of amygdala sections of human AD samples and non-AD samples, used to study the distribution of GFAP (green, A), ANXA5 (green, B), or COL6A (green, C). Immunostaining against Aβ1–42 (red, a–b) was also included to identify the Aβ plaques. Nuclei are labeled in blue with DAPI. Calibration bars 50 μm
Finally, a triple immunofluorescence was carried out in amygdala with Aβ1–42 (Fig. 5a, b, red) and two of the proteins observed exclusively in AD samples (RNF213; Fig. 5c, d, green) and non-AD samples (CNTN1; Fig. 5e, f, purple). It is especially relevant that CNTN1 expression in non-AD samples was strong and widespread when compared to AD samples (Fig. 5e, f). On the other hand, RNF213 immunostaining (which, as expected, appears in the nuclei of the cells) seems to be overexpressed in AD samples. Together with the Aβ1–42 fluorescence (Fig. 5g, h), a noteworthy increase in RNF213 intensity (twofold increase) could be appreciated when the nuclei were located into Aβ plaques (arrow). Similar experiments performed in the olfactory cortex of AD patients revealed that CNTN1 was also highly abundant in non-AD samples in this section of the brain (Additional file 2: Figure S4B) while RNF213 appeared strongly associated within the limits of the Aβ plaque (Additional file 2: Figure S4B).

Triple immunofluorescence against Aβ1–42, RNF213, and CNTN1. Confocal images showing a triple-immunofluorescence against Aβ1–42 (a, b), RNF213 (c, d), and CNTN1 (e, f) in coronal sections of non-AD (a, c, e, and g) and AD human brain (b, d, f, and h). Calibration bar a–h 50 μm. Yellow arrowheads indicate the highly RNF213 immunofluorescence identified nuclei
Discussion
Aβ enrichment from AD patients and pre-amyloid diffuse plaques
Several laboratories have developed protocols to extract Aβ and other components from AD plaques [17, 19, 22, 40] although those with higher success rates (70–99% formic acid; [22]) involve aggressive treatments of the Aβ plaque and solubilize the core structure of amyloid fibrils [22]. In this study, we aimed at preserving as much fibrillar structures as possible and therefore we used a four-step enrichment protocol based on detergent centrifugations. We avoided the combination of detergent extraction with high molarity urea or guanidinium salts as it may result in increased solubilization of fibrillar structures [41]. We also avoided sonication during the process as it has been shown that it produces the redistribution of Aβ species from plaques to more soluble fractions [41].
In AD, Aβ aggregates start as pre-amyloid diffuse plaques [42] that contain smaller amounts of Aβ and are not as organized into fibrils as in more advanced stages. In this study, a strong precipitate was observed in Aβ-enriched samples of stage VI AD patients, and dimers and oligomers remained in western blot experiments. The presence of such insoluble material was not observed in non-AD samples and barely observed in the extract from the patient with diffuse plaques. Nevertheless, in order to obtain accurate information of the soluble Aβ that was present in each enriched extract used for the different experiments, we avoided the use of formic acid or guanidinium salts for ELISA. Quantification in such conditions uncovered the presence of five to ten times higher Aβ1–42 in DP than in AD. In this sense, it has been shown that ELISA usually works fine with soluble Aβ but not with insoluble Aβ aggregates as it underestimates the concentration of total Aβ1–42 of the Aβ plaque [43]. Taking into consideration the solubility of Aβ in the AD samples, it was not possible to ascertain their Aβ1–42 concentration, and only dot blot analysis (which has previously been used for this purpose) [34] gave an approximated concentration of 0.5 μg/μl of Aβ in the final pellet. Although we are aware that the presence of insoluble material may introduce some bias in the process of protein quantification, as far as we know, this concentration constitutes the highest Aβ enrichment tested to date in vivo and in vitro.
Labeled extracts from Aβ-enriched fractions are internalized in vitro and in vivo
This study provides the first evidence that AD-enriched extracts, but not non-AD extracts, are efficiently incorporated into the cells surrounding the injection site 4 months post-injection, which constitutes the first step toward Aβ transmissibility. Additional labeling with Iba-1 demonstrates that among the cells that incorporate labeled extracts of AD patients in vivo there are glial cells (microglia). This fact has been previously described in vitro [34], where it was proposed that Aβ1–42 protofibrils were more efficiently internalized by microglia than monomers [34]. In fact, microglia might play a crucial role in AD [44]. We cannot assure that the long-lived component of the extracts incorporated into Iba-1-positive cells is exclusively Aβ1–42 as we labeled whole Aβ1–42-enriched extracts. In fact, there exists the possibility that the observed fluorescence corresponds to additional labeled proteins that are not enriched in control extracts, as these extracts are not internalized. In this sense, previous experiments injecting preparations of soluble or fibrillar synthetic Aβ40, Aβ42, or a mixture of both [11] and Aβ1–40, Aβ1–42, and Aβ40–1 synthetic Aβ peptides [13] did not generate such a prion-like effect as AD brain extracts, suggesting that these extracts may contain unique features important for the internalization and transmission of the seeding. Also, further attempts to initiate the aggregation of Aβ in vivo with synthetic peptides in combination with several of the components known to be associated with the Aβ plaque, such as ApoE [11], did not reach success reinforcing the idea that other plaque components should be participating in this phenomenon. This is especially relevant, and we are currently undergoing further experiments to identify the nature of the incorporated proteins. In addition, our study also found that cultured endothelial cells, as the primary components of the blood–brain barrier, uptake Aβ extracts from Aβ-enriched fractions in what may constitute the pathway for Aβ to reach the bloodstream.
Proteomics analysis identified components that were over- and underrepresented in plaque-containing AD extracts
Previous studies [39, 45] have related a hyper-reactivity of the GFAP protein to Aβ deposition. In this study, the GFAP signal was found to be intense in the amygdala of AD patients, corroborating those findings. Two members of the annexin family were also enriched in AD extracts. One of them, annexin A5 (ANXA5), has been proposed as an AD biomarker since its plasma levels, commonly used to detect apoptotic cells, are significantly higher in AD patients [46, 47]. Intense ANXA5 immunoreactive spots were observed in an AD transgenic mouse model [47]. Our study shows for the first time that the ANXA5 signal is especially intense several micrometers around the plaque. In this sense, GO enrichment analysis revealed overrepresentation of two biological processes in AD extracts, where ANXA5, together with ANXA2, APOE, and CD9 proteins take part: negative regulation of wound healing and homeostasis. These biological processes are not found in non-AD extracts and enhance the potential importance of these four proteins for systemic inflammation, or other processes that lead to the brain homeostasis collapse in advanced Alzheimer’s disease stages [48].
It is especially intriguing that the presence of HIST1H2BK among the most significant proteins is overrepresented in Aβ-enriched extracts. This fact has been observed for histone H3 previously in full extracts off AD by iTRAQ [49] and in laser proteomics of the plaques for histone H4 [25]. Search for ligands of b-APP using ligand blotting showed strong affinity for histones specially H4 [50], and although we do not know whether histones bind or not to APP-derived peptides, their consistent finding in proteomic studies points toward a deep histone-amyloid plaque relation. This fact is especially relevant and deserves a deeper analysis, even more if we take into account that extracellular histones induce inflammation and other toxic effects [51, 52]. It is also relevant the result that suggests that fibronectin is reduced in AD extracts vs non-AD as major changes in the molecular composition of the vascular basement membranes (BM) are observed in acute and chronic neuropathological settings [53]. Other proteins of the extracellular matrix (ECM) intimately related with the BM such as fibrinogen or laminin A5 are more abundant in non-AD extracts while no differences were found on tubulins or vimentin between non-AD and AD samples. Therefore, the dissimilar distribution of these structural components of the BM and the ECM between AD and non-AD extracts reflects alteration of the BM that occurs in AD [54].
It also shows that the alpha-3 subunit of type VI collagen decreases in patients with AD. Collagen VI is an extracellular matrix protein which, according to previous studies [55], protects neurons from the toxicity of Aβ peptides. Consequently, brains with collagen VI deficiency can be expected to show greater vulnerability to apoptosis, due to alterations in oxidative stress triggered by Aβ deposits [56]. This protein could be a promising focus for future treatments.
On the other hand, one of the most interesting proteins observed exclusively in both samples of Aβ-enriched extracts is the E3 ubiquitin-protein ligase RNF213 [57]. RNA expression of the gene encoding this protein was found in genomic microarrays from AD patients [57]. Recent studies suggest that RNF213 plays an important role in cerebral blood flow maintenance under ischemic conditions by affecting angiogenesis [58], processes whose alteration usually precede development of amyloid plaques in AD patients and AD animal models [59]. Immunoreactivity is mostly observed in the nucleus (increased in those located inside the plaque), although, in the olfactory cortex, the protein is also found within the plaque. The distribution of RNF213 immunostaining reveals a potential direct Aβ plaque biomarker. Contrary to RNF213, CNTN1 was highly expressed in non-AD, as opposed to AD, samples. The contactin family has been known to interact with the extracellular domain of amyloid precursor protein (APP). For instance, contactin-2 regulates APP cleavage by secretases, a process important for neurotoxic Aβ liberation and production of the APP intracellular domain [60]. Also, it is implied in synaptic plasticity [61].
It is interesting that a number of specific calcium binding (ANXA2, ANXA5, and FN1; [62,63,64]) or calcium-sensitive (COL6A3 [65]) proteins are differentially enriched in proteomics of both AD and non-AD extracts. This fact may be related to the importance that calcium plays in the progression of AD ([66]) where calcium increases are associated with increased production of Aβ and also with reductions in macroautophagy—a clearance pathway for intracellular aggregates—[67].
Conclusions
In conclusion, the obtained enriched Aβ fractions of human AD brains retain their ability to be internalized in vitro by cultured cells, but also the intracellular detection in vivo of the labeled extracts was marked after 4 months post-inoculation. Therefore, the enriched Aβ extract allows for easy traceability by immunofluorescence as the increased concentration of Aβ plaques amplifies the cell exposure to Aβ. We have deeply characterized the components of Aβ-enriched fractions identifying several proteins with dissimilar distribution between AD and non-AD extracts and investigating the distribution of the most representative findings in amygdala and olfactory cortex. These unique characteristics in terms of Aβ enrichment and extract characterization made these extracts the finest tool to further investigate seeding and transmissibility of the proposed prion-like hypothesis of AD.
Availability of data and materials
The data generated during in this study is included in this article and its additional files.
Abbreviations
- AD:
-
Alzheimer’s disease
- ANXA2:
-
Annexin A2
- ANXA5:
-
Annexin A5
- AONd:
-
Dorsal part of the anterior olfactory nucleus
- APOE:
-
Apolipoprotein E
- APP:
-
Amyloid precursor protein
- Aβ:
-
Amyloid beta
- BCA:
-
Bicinchoninic acid assay
- BM:
-
Basement membranes
- BSA:
-
Bovine serum albumin
- Cc:
-
Corpus callosum
- Cd:
-
Caudate nucleus
- CNTN1:
-
Contactin 1
- COL6A:
-
Collagen alpha-3(VI) chain
- DMEM:
-
Dulbecco’s modified Eagle medium
- DPX:
-
Dstyrene plasticizer xylene
- ECM:
-
Extracellular matrix
- ELISA:
-
Enzyme-linked immunosorbent assay
- Ent:
-
Entorhinal cortex
- FBS:
-
Fetal bovine serum
- FDR:
-
False discovery rate
- GFAP:
-
Glial fibrillary acidic protein
- HiH:
-
Hippocampal head
- HIST1H2BK:
-
Histone cluster 1 H2B family member k
- ic:
-
Internal capsule
- iTRAQ:
-
Isobaric tags for relative and absolute quantitation
- LC-MS/MS:
-
Liquid chromatography-tandem mass spectrometry
- LV:
-
Lateral ventricle
- MAPT:
-
Microtubule-associated protein tau
- NDS:
-
Normal donkey serum
- OlfA:
-
Olfactory area
- PBS:
-
Phosphate-buffered saline
- PFA:
-
Paraformaldehyde
- PHG:
-
Parahippocampal gyrus
- Pir:
-
Piriform cortex
- PRC:
-
Perirhinal cortex
- PSM:
-
Peptide-spectrum matches
- Pu:
-
Putamen
- PVA-DABCO:
-
Polyvinylalcohol-1,4 diazoabicyclo [2.2.2] octane
- RNF213:
-
Ring finger protein 213
- RPLC-MS/MS:
-
Reverse phase liquid chromatography-tandem mass spectrometry
- SDS:
-
Sodium dodecyl sulfate
- SEM:
-
Scanning electron microscopy
- SG:
-
Straight gyrus
- TLV:
-
Temporal horn of the lateral ventricle
- Un:
-
Uncus
References
Scheltens P, Blennow K, Breteler MM, de Strooper B, Frisoni GB, Salloway S, Van der Flier WM. Alzheimer’s disease. Lancet. 2016;388:505–17.
Masters CL, Bateman R, Blennow K, Rowe CC, Sperling RA, Cummings JL. Alzheimer’s disease. Nat Rev Dis Primers. 2015;1:15056.
Selkoe DJ. Cell biology of protein misfolding: The examples of Alzheimer´s and Parkinson´s diseases Nature Cell Biology 2004;6:1054–61.
Pearson HA, Peers C. Physiological roles for amyloid beta peptides. J Physiol. 2006;575:5–10.
Shirwany NA, Payette D, Xie J, Guo Q. The amyloid beta ion channel hypothesis of Alzheimer’s disease. Neuropsychiatr Dis Treat. 2007;3:597–612.
Walker LC, Schelle J, Jucker M. The Prion-Like Properties of Amyloid-beta Assemblies: Implications for Alzheimer's Disease. Cold Spring Harb Perspect Med. 2016;6:1–16.
Braak H, Alafuzoff I, Arzberger T, Kretzschmar H, Del Tredici K. Staging of Alzheimer disease-associated neurofibrillary pathology using paraffin sections and immunocytochemistry. Acta Neuropathol. 2006;112:389–404.
Eisele YS, Duyckaerts C. Propagation of Ass pathology: hypotheses, discoveries, and yet unresolved questions from experimental and human brain studies. Acta Neuropathol. 2016;131:5–25.
Morales R, Duran-Aniotz C, Castilla J, Estrada LD, Soto C. De novo induction of amyloid-beta deposition in vivo. Mol Psychiatry. 2012;17:1347–53.
Kane MD, Lipinski WJ, Callahan MJ, Bian F, Durham RA, Schwarz RD, Roher AE, Walker LC. Evidence for seeding of b-amyloid by intracerebral infusion of Alzheimer brain extracts in β-amyloid precursor protein transgenic mice. J Neurosci. 2000;20:3606–11.
Meyer-Luehmann M. Exogenous induction of cerebral -amyloidogenesis is governed by agent and host. Science. 2006;313:1781–4.
Watts JC, Giles K, Grillo SK, Lemus A, DeArmond SJ, Prusiner SB. Bioluminescence imaging of Aβ deposition in bigenic mouse models of Alzheimer’s disease. Proc Natl Acad Sci. 2010;108:2528–33.
Ridley RM, Baker HF, Windle CP, Cummings RM. Very long term studies of the seeding of beta-amyloidosis in primates. J Neural Transm. 2006;113:1243–51.
Wesen E, Jeffries GDM, Matson Dzebo M, Esbjorner EK. Endocytic uptake of monomeric amyloid-beta peptides is clathrin- and dynamin-independent and results in selective accumulation of Abeta(1-42) compared to Abeta(1-40). Sci Rep. 2017;7:2021.
Guo JL, Lee VM. Cell-to-cell transmission of pathogenic proteins in neurodegenerative diseases. Nat Med. 2014;20:130–8.
Adav SS, Gallart-Palau X, Tan KH, Lim SK, Tam JP, Sze SK. Dementia-linked amyloidosis is associated with brain protein deamidation as revealed by proteomic profiling of human brain tissues. Mol Brain. 2016;9:20.
Izco M, Pesini P, Perez-Grijalba V, Fandos N, Sarasa M. Optimized protocol for amyloid-beta extraction from the brain. J Alzheimers Dis. 2013;34:835–9.
Roher A, Wolfe D, Palutke M, Kukuruga AD. Purification, ultrastructure, and chemical analysis of Alzheimer disease amyloid plaque core protein. Proc Natl Acad Sci. 1986;83:2662–6.
Diner I, Nguyen T, Seyfried NT. Enrichment of detergent-insoluble protein aggregates from human postmortem brain. J Vis Exp. 2017;128:e55835.
Tsuji TS, S. Kamiya, S. Sazuka, T. Ohara, O.: Analysis of brain proteins in Alzheimer’s disease using high-resolution two-dimensional gel electrophoresis. J Neurol Sci 1999, 166:100–106.
Tsuji TS. Analysis of the proteomic profiling of brain tissue in Alzheimer’s disease. Dis Markers. 2001;17:247–57.
Rostagno A, Ghiso J. Isolation and biochemical characterization of amyloid plaques and paired helical filaments. Curr Protoc Cell Biol. 2009; Chapter 3:Unit 3:1–31.
Hadley KC, Rakhit R, Guo H, Sun Y, Jonkman JE, McLaurin J, Hazrati LN, Emili A, Chakrabartty A. Determining composition of micron-scale protein deposits in neurodegenerative disease by spatially targeted optical microproteomics. eLife. 2015;4.
Hondius DC, van Nierop P, Li KW, Hoozemans JJ, van der Schors RC, van Haastert ES, van der Vies SM, Rozemuller AJ, Smit AB. Profiling the human hippocampal proteome at all pathologic stages of Alzheimer’s disease. Alzheimers Dement. 2016;12:654–68.
Liao L, Cheng D, Wang J, Duong DM, Losik TG, Gearing M, Rees HD, Lah JJ, Levey AI, Peng J. Proteomic characterization of postmortem amyloid plaques isolated by laser capture microdissection. J Biol Chem. 2004;279:37061–37,068.
Drummond E, Nayak S, Faustin A, Pires G, Hickman RA, Askenazi M, Cohen M, Haldiman T, Kim C, Han X, et al. Proteomic differences in amyloid plaques in rapidly progressive and sporadic Alzheimer’s disease. Acta Neuropathol. 2017;133:933–54.
Paxinos G, Franklin K. The mouse brain in stereotaxic coordinates. San Diego: Elsevier; 2008.
Ubeda-Banon I, Saiz-Sanchez D, de la Rosa-Prieto C, Argandona-Palacios L, Garcia-Munozguren S, Martinez-Marcos A. alpha-Synucleinopathy in the human olfactory system in Parkinson’s disease: involvement of calcium-binding protein- and substance P-positive cells. Acta Neuropathol. 2010;119:723–35.
Saiz-Sanchez D, Flores-Cuadrado A, Ubeda-Banon I, de la Rosa-Prieto C, Martinez-Marcos A. Interneurons in the human olfactory system in Alzheimer’s disease. Exp Neurol. 2016;276:13–21.
Villar M, Ayllon N, Alberdi P, Moreno A, Moreno M, Tobes R, Mateos-Hernandez L, Weisheit S, Bell-Sakyi L, de la Fuente J. Integrated metabolomics, transcriptomics and proteomics identifies metabolic pathways affected by Anaplasma phagocytophilum infection in tick cells. Mol Cell Proteomics. 2015;14:3154–72.
Eden E, Navon R, Steinfeld I, Lipson D, Yakhini Z. GOrilla: a tool for discovery and visualization of enriched GO terms in ranked gene lists. BMC Bioinformatics. 2009;10:48.
Witztum J, Persi E, Horn D, Pasmanik-Chor M, Chor B. Hierarchical partitioning of metazoan protein conservation profiles provides new functional insights. PLoS One. 2014;9:e90282.
Ping L, Duong DM, Yin L, Gearing M, Lah JJ, Levey AI, Seyfried NT. Global quantitative analysis of the human brain proteome in Alzheimer’s and Parkinson’s disease. Sci Data. 2018;5:180036.
Gouwens LK, Makoni NJ, Rogers VA, Nichols MR. Amyloid-beta42 protofibrils are internalized by microglia more extensively than monomers. Brain Res. 2016;1648:485–95.
Kim J, Basak JM, Holtzman DM. The role of apolipoprotein E in Alzheimer’s disease. Neuron. 2009;63:287–303.
Eberhad DA, Brown MD, VandenBerg SR. Alterations of Annexin expression in pathological neuronal and glial reactions. Am J Pathol. 1994;145:640–8.
Zhang C-C, Zhu J-X, Wan Y, Tan L, Wang H-F, yU J-T, Tan L. Meta-analysis of the association between variants in MAPT and neurodegenerative diseases. Oncotarget. 2017;8:44994–45,007.
Vasavada MM, Wang J, Eslinger PJ, Gill DJ, Sun X, Karunanayaka P, Yang QX. Olfactory cortex degeneration in alzheimer’s disease and mild cognitive impairment. J Alzheimers Dis. 2015;45:947–58.
Kamphuis W, Middeldorp J, Kooijman L, Sluijs JA, Kooi EJ, Moeton M, Freriks M, Mizee MR, Hol EM. Glial fibrillary acidic protein isoform expression in plaque related astrogliosis in Alzheimer’s disease. Neurobiol Aging. 2014;35:492–510.
Gozal YM, Duong DM, Gearing M, Cheng D, Hanfelt JJ, Funderburk C, Peng J, Lah JJ, Levey AI. Proteomics analysis reveals novel components in the detergent-insoluble subproteome in Alzheimer’s disease. J Proteome Res. 2009;8:5069–79.
Jimenez S, Navarro V, Moyano J, Sanchez-Mico M, Torres M, Davila JC, Vizuete M, Gutierrez A, Vitorica J. Disruption of amyloid plaques integrity affects the soluble oligomers content from Alzheimer disease brains. PloS one. 2014;9:e114041.
Davies CA, Mann DMA. Is the “preamyloid” of diffuse plaques in Alzheimer’s disease really nonfibrillar? Am J Pathol. 1993;143:1594–605.
Esparza TJ, Wildburger NC, Jiang H, Gangolli M, Cairns NJ, Bateman RJ, Brody DL. Soluble amyloid-beta aggregates from human Alzheimer’s disease brains. Sci Rep. 2016;6:38187.
Salter MW, Stevens B. Microglia emerge as central players in brain disease. Nat Med. 2017;23:1018–27.
Hol EM, Roelofs RF, Moraal E, Sonnemans MAF, Sluijs JA, Proper EA, de Graan PNE, Fischer DF, van Leeuwen FW. Neuronal expression of GFAP in patients with Alzheimer pathology and identification of novel GFAP splice forms. Mol Psychiatry. 2003;8:786–96.
Sohma H, Imai S, Takei N, Honda H, Matsumoto K, Utsumi K, Matsuki K, Hashimoto E, Saito T, Kokai Y. Evaluation of annexin A5 as a biomarker for Alzheimer’s disease and dementia with Lewy bodies. Front Aging Neurosci. 2013;5:15.
Yamaguchi M, Kokai Y, Imai S, Utsumi K, Matsumoto K, Honda H, Mizue Y, Momma M, Maeda T, Toyomasu S, et al. Investigation of annexin A5 as a biomarker for Alzheimer’s disease using neuronal cell culture and mouse model. J Neurosci Res. 2010;88:2682–92.
Frere S, Slutsky I. Alzheimer’s disease: from firing instability to homeostasis network collapse. Neuron. 2018;97:32–58.
Minjarez B, Calderon-Gonzalez KG, Rustarazo ML, Herrera-Aguirre ME, Labra-Barrios ML, Rincon-Limas DE, Del Pino MM, Mena R, Luna-Arias JP. Identification of proteins that are differentially expressed in brains with Alzheimer’s disease using iTRAQ labeling and tandem mass spectrometry. J Proteomics. 2016;139:103–21.
Potempska A, Ramakrishna N, wisniewski HM, Miller DL. Interaction between the β-amyloid peptide precursor and histones. Arch Biochem Biophys. 1993;204:448–53.
Xu J, Zhang X, Pelayo R, Monestier M, Ammollo CT, Semeraro F, Taylor FB, Esmon NL, Lupu F, Esmon CT. Extracellular histones are major mediators of death in sepsis. Nat Med. 2009;15:1318–21.
Chen R, Kang R, Fan XG, Tang D. Release and activity of histone in diseases. Cell Death Dis. 2014;5:e1370.
Thomsen MS, Routhe LJ, Moos T. The vascular basement membrane in the healthy and pathological brain. J Cereb Blood Flow Metab. 2017;37:3300–17.
Morris AW, Carare RO, Schreiber S, Hawkes CA. The cerebrovascular basement membrane: role in the clearance of beta-amyloid and cerebral amyloid angiopathy. Front Aging Neurosci. 2014;6:251.
Cheng JS, Dubal DB, Kim DH, Legleiter J, Cheng IH, Yu GQ, Tesseur I, Wyss-Coray T, Bonaldo P, Mucke L. Collagen VI protects neurons against Abeta toxicity. Nat Neurosci. 2009;12:119–21.
Cescon M, Chen P, Castagnaro S, Gregorio I, Bonaldo P. Lack of collagen VI promotes neurodegeneration by impairing autophagy and inducing apoptosis during aging. Aging. 2016;8:1083–98.
Bai Z, Stamova B, Xu H, Ander BP, Wang J, Jickling GC, Zhan X, Liu D, Han G, Jin LW, et al. Distinctive RNA expression profiles in blood associated with Alzheimer disease after accounting for white matter hyperintensities. Alzheimer Dis Assoc Disord. 2014;28:226–33.
Morimoto T, Enmi JI, Hattori Y, Iguchi S, Saito S, Harada KH, Okuda H, Mineharu Y, Takagi Y, Youssefian S, et al. Dysregulation of RNF213 promotes cerebral hypoperfusion. Sci Rep. 2018;8:3607.
Farkas E, Luiten PG. Cerebral microvascular pathology in aging and Alzheimer’s disease. Prog Neurobiol. 2001;64:575–611.
Medway C, Shi H, Bullock J, Black H, Brown K, Vafadar-isfahani B, Matharoo-ball B, Ball G, Rees R, Kalsheker N, Morgan K. Using in silico LD clumping and meta-analysis of genome-wide datasets as a complementary tool to investigate and validate new candidate biomarkers in Alzheimer’s disease. Int J Mol Epidemiol Genetics. 2010;1:133–44.
Gulisano W, Bizzoca A, Gennarini G, Palmeri A, Puzzo D. Role of the adhesion molecule F3/Contactin in synaptic plasticity and memory. Mol Cell Neurosci. 2017;81:64–71.
Gabel M, Delavoide F, Royer C, Tahouly T, Gasman S, Bader MF, Vitale N, Golaz S. Phosphorylation cycling of Annexin A2 Tyr23 is critical for calcium-regulated exocytosis in neuroendocrine cells. Biochimica et Biophysica Acta (BBA) - Mol Cell Res. 2019;7:1207–17.
Huber R, Schneider M, Mayr I, Romisch J, Paques EP. The calcium binding sites in human annexin V by crystal structure analysis at 2.0 A resolution Implications for membrane binding and calcium channel activity. FEBS Lett. 1990;275:15–21.
Amphlett GW, Hrinda ME. The binding of calcium to human fibronectin. Biochem Biophys Res Commun. 1983;111:1045–53.
Quill B, Rnaten M, Docherty NG, McElnea EM, Wallace DM, Clark AF, O’Brien CJ. Calcium channel blockade reduces mechanical strain-induced extracellular matrix gene response in lamina cribrosa cells. Br J Ophthalmol. 99:1009–14.
Wang Y, Shi Y, Wei H. Calcium Dysregulation in Alzheimer's Disease: A Target for New Drug Development. J Alzheimers Dis Parkinsonism. 2017;7:1–15.
Penke B, Bogar F, Fulop L. β-Amyloid and the Pathomechanisms of Alzheimer's Disease: A Comprehensive View. Molecules. 2017;22:1–32.
Mai JK, Paxino G, Voss T. Atlas of the human brain. San Diego: Press EA; 2008.
Acknowledgements
We are indebted to the IDIBAPS, BTCIEN, and BIOBANC-MUR Biobanks for the sample and data procurement. We thank Sara Fairén and Calum Ross for the English edition of this manuscript.
Funding
Sponsored by the Spanish Ministry of Economy and Competitiveness-FEDER (grant # SAF2016-75768-R) to AMM, MINECO-RETOS (AEI-FEDER) to MDP, and the Autonomous Government of Castilla-La Mancha/FEDER (grant no. SBPLY/17/180501/000430) to AMM and DSS.
Author information
Authors and Affiliations
Contributions
JRP and AMM contributed to the conceptualization and directed the study. CMPP performed the protocol for amyloid β enrichment and in vitro research, she also performed all dot blots, western blots, ELISA and SDS-PAGE, and prepared the tables and figures. AFC, DSS and IUB did the in vivo experiments and prepared tissue for immunohistochemistry. LMH and MV, performed the proteomic study. JFR, MDP and AFC provided technical assistance. CMPP, MV, JRP, and MDP contributed to the analysis of the results (in vitro, in vivo and proteomic results). CMPP, JRP, and AMM wrote the original draft of the manuscript. FJA, JF, and MDP reviewed, and edited the manuscript. We want to thank Patricia Villanueva for technical assistance. All authors read and approved the final manuscript.
Authors’ information
NA
Corresponding authors
Ethics declarations
Ethics approval and consent to participate
Animal procedures strictly followed the Institutional Animal Care and Use Committee guidelines approved protocols at the University of Castilla La-Mancha.
Consent for publication
All authors read and approved the final manuscript.
Competing interests
The authors declare that they have no competing interests.
Additional information
Publisher’s Note
Springer Nature remains neutral with regard to jurisdictional claims in published maps and institutional affiliations.
Additional files
Additional file 1:
Table S1. Data of patients used in the present study. AD, Alzheimer disease; non-AD, non-Alzheimer disease; M, Male; F, Female; y, years; P, Proteomic study; E, ELISA; D, dot blot; I, immunofluorescence. *Human brain tissue used for the optimization of the enrichment protocol. Table S2. Antibodies used in the present study. (PPTX 47 kb)
Additional file 2:
Figure S1. Schemes showing the medial view of the brain and the corresponding levels: A) Coronal sections of olfactory (B) and amygdaloid (C) areas analyzed [Bregma − 5.8 and − 6.7 mm respectively, according to [68]]. The corresponding tissue blocks (D, E) and Nissl-stained, mosaic-reconstructed sections (F, G) are also illustrated. Calibration bars 1 cm. A: amygdala; aic: anterior limb of internal capsule; AONc: anterior olfactory nucleus, cortical part; C: claustrum; cc: corpus callosum; Cd: caudate nucleus; HiH: hippocampal head; ic: internal capsule; LV: lateral ventricle; OlfA: olfactory area; Pir: piriform cortex; PHG: parahippocampal gyrus; Pu: putamen; SG: straight gyrus; TLV: temporal horn of lateral ventricle; un: uncus; Ent: Entorhinal cortex; PRC: perirhinal cortex. Figure S2. Overview of the protocol for the enrichment of Aβ plaques (A). Dot blot of the steps of Aβ plaque enrichment using Aβ1–42 antibody (B–C) and tau antibody (D). Coomassie blue of the steps of Aβ enrichment. AD, Alzheimer disease; Non-AD, non-Alzheimer disease; DP, diffuse plaques; LB, lysis buffer; T, total extract; S, supernatant; P, pellet. Numbers indicate steps in the procedure. Figure S3. Gene ontology overrepresentation study. “p value” is the enrichment p value computed according to the mHG or HG model. “FDR q value” is the correction of the above p value for multiple testing using the Benjamini and Hochberg (1995) method. Figure S4. Double immunofluorescence against Aβ1–42, and ANXA5 (A), and triple immunofluorescence against Aβ1–42, RNF213 and CNTN1 (B). Confocal images of human olfactory cortex sections of human AD samples and non-AD samples to study the distribution of ANXA5 (green, A), RNF213 (green, B), or CNTN1 (purple, B). Immunostaining against Aβ1–42 (red, A and B) was also included to identify Aβ plaques. Nuclei are labeled in blue with DAPI. The arrow indicates nuclei located inside the plaque. Calibration bars 50 μm. (PPTX 11881 kb)
Additional file 4:
Table S3. Proteins identified by reverse-phase liquid chromatography coupled to tandem mass spectrometry (RP-LC-MS/MS) in AD1, AD2, non-AD1, and non-AD2 extracts. PSM, peptide-spectrum matches. Coverage: % of the protein identified. #peptides, number of the identified peptides corresponding to the identified protein. (XLSX 60 kb)
Rights and permissions
Open Access This article is distributed under the terms of the Creative Commons Attribution 4.0 International License (http://creativecommons.org/licenses/by/4.0/), which permits unrestricted use, distribution, and reproduction in any medium, provided you give appropriate credit to the original author(s) and the source, provide a link to the Creative Commons license, and indicate if changes were made. The Creative Commons Public Domain Dedication waiver (http://creativecommons.org/publicdomain/zero/1.0/) applies to the data made available in this article, unless otherwise stated.
About this article

Cite this article
Pedrero-Prieto, C.M., Flores-Cuadrado, A., Saiz-Sánchez, D. et al. Human amyloid-β enriched extracts: evaluation of in vitro and in vivo internalization and molecular characterization. Alz Res Therapy 11, 56 (2019). https://doi.org/10.1186/s13195-019-0513-0
Received:
Accepted:
Published:
DOI: https://doi.org/10.1186/s13195-019-0513-0