
Abstract
Backgrounds
UDP-glucuronosyltransferase 1A subfamily (UGT1A) enzymes can inactivate cytarabine (Ara-C) by glucuronidation, and thus serves as candidate genes for interindividual difference in Ara-C response. UGT1A1 is a major UGT1A isoform expressed in human liver.
Methods
UGT1A1*6 and *28 polymorphisms resulting in reduced UGT1A1 activity were genotyped in 726 adult acute myeloid leukemia (AML) patients treated with Ara-C based regimens. Influences of both polymorphisms on chemosensitivity and disease prognosis of the patients were evaluated.
Results
After one or two courses of Ara-C based induction chemotherapy, the complete remission (CR) rate was significantly higher in patients carrying the UGT1A1*6 (77.0%) or the UGT1A1*28 (76.4%) alleles as compared with corresponding wild-type homozygotes (66.9 and 68.5%, respectively). Carriers of the UGT1A1*6 or *28 alleles showed significantly decreased risk of non-CR (OR = 0.528, 95% CI 0.379–0.737, P = 1.7 × 10⁻⁴) and better overall survival (HR = 0.787, 95% CI 0.627–0.990, P = 0.040) as compared with homozygotes for both polymorphisms.
Conclusion
Our results suggest that UGT1A1*28 and UGT1A1*6 are associated with improved clinical outcomes in Chinese AML patients treated with Ara-C.
Background
Acute myeloid leukemia (AML) is a heterogeneous hematological malignance derived from the hemopoietic progenitors with highly diverse clinical traits, molecular pathogenesis and clinical outcomes [1]. Apart from known prognostic factors including age, white blood cell (WBC) counts, complex karyotype, antecedent hematologic disease and secondary leukemia [2], accumulated evidence has shown that the presence of somatic mutations in genes such as fms-like tyrosine kinase 3 (FLT3), nucleophosmin 1 (NPM1), CCAAT enhancer binding protein alpha (CEBPA), KIT proto-oncogene receptor tyrosine kinase (KIT), tumor protein p53 (TP53) [3] and DNA methyltransferase 3 alpha (DNMT3a) [4, 5] have clinical prognostic significance. Chemotherapy with cytarabine (Ara-C) based regimen remains the major therapy for AML except for the M3 subtype, and the complete remission (CR) rate varies between 60 and 70% for the adult patients during induction therapy [6]. Half of the patients achieved CR in primarily induction chemotherapy relapsed due to the existence of minimal residual disease [7]. Overall long-term survival rate of AML ranges from 21.9 to 44% [8]. Primary or acquired chemoresistance is the major problem faced in AML treatment [9]. Therefore, identification of factors related to Ara-C-resistance and better elucidation of potential mechanisms involved in Ara-C resistance will help optimize regimens for treatment of AML and improve the clinical outcomes as well.
Ara-C is a prodrug and undergoes biotransformation into the active metabolite cytarabine triphosphate (Ara-CTP) to exert its pharmacological activity; the latter can incorporate into replicating DNA and interfere with DNA synthesis, resulting in apoptosis of cells. Three kinases are required to accomplish intracellular phosphorylation of Ara-C to the formation of Ara-CTP: the rate-limiting enzyme deoxycytidine kinase (DCK), deoxycytidine monophosphate kinase and nucleoside diphosphate kinase [10]. On the other hand, 5′-nucleotidases [11], cytidine deaminase (CDA) [12] and SAM domain and HD domain-containing protein 1 (SAMHD1) [13, 14] are the major deactivating enzymes of Ara-C that act through prevention of the formation or directly increase the degradation of the active triphosphate metabolite. Alteration in the activity of enzymes involved in Ara-C metabolism may result in a change in the proportion of its active form in the cells, and thus affects both sensitivity and toxicity of Ara-C in AML patients receiving Ara-C based chemotherapy [15]. Our previous studies have reported that polymorphisms in DCK, nucleoside diphosphate kinase 2 (NME2), ribonucleotide reductase catalytic subunit M2 (RRM2), and SAMHD1 are associated with chemosensitivity to Ara-C based therapy and disease prognosis in Chinese AML patients [10, 16].
The Hedgehog (HH)/Glioma-associated Oncogene Homolog (GLI) signaling pathway that plays a role in chemotherapy resistance and cellular self-renewal is supposed to be a novel therapeutic target in AML [17]. In a phase 2 clinical trial with AML and high-risk myelodysplastic syndromes (MDS) patients, combined therapy with low dose Ara-C and a selective HH/GLI pathway inhibitor glasdegib is observed to improve overall survival (OS) as compared with Ara-C treatment alone [18]. Our recent study also showed that GLI1 expression was upregulated in bone marrow mononuclear cells from patients with refractory or relapsed AML, and GLI1 inhibition is sufficient to increase Ara-C sensitivity [19]. Furthermore, Zahreddine and colleagues demonstrated that UDP-glucuronosyltransferase 1A subfamily (UGT1A) enzymes can inactivate Ara-C through glucuronidation in leukemia cells, and GLI1 is involved in Ara-c resistance through enhancing the stability of UGT1A enzymes [20]. However, there is no report on associations of genetic polymorphisms in GLI1 and the UGT1A subfamily with Ara-C presently.
The human UGT1A subfamily enzymes are encoded by the UGT1A gene locus on Chromosome 2q37.1 by alternative splicing. Nine functional proteins (UGT1A1, 1A3, 1A4, 1A5, 1A6, 1A7, 1A8, 1A9, and 1A10) were translated by the locus. All the isoforms share 4 common exons from exon 2 to exon 5, but have unique exon 1 and individual promoter pairs in turn of 1A8, 1A10, 1A9, 1A7, 1A6, 1A5, 1A4, 1A3, 1A1 in the UGT1A pre-mRNA [21]. The UGT1A1 exon 1/promoter is the nearest one to the common exon 2. UGT1A1 plays important roles in the clearance and metabolism of many endogenous or exogenous compounds such as irinotecan [22]. Two functional single nucleotide polymorphisms (SNPs) in UGT1A1, i.e. UGT1A1*28 (rs8175347) and UGT1A1*6 (rs4148323) are reported. The UGT1A1*28 polymorphism that results in TA repeating number alteration in the TATA box in the promoter can decrease the UGT1A1 expression and accounts for increased risk for irinotecan-induced neutropenia [23, 24] and myelosuppression [25, 26]. In 2005, the USA Food and Drug Administration (FDA) warned that patients with UGT1A1*28/*28 genotype are at increased risk for neutropenia when irinotecan is used, and a lower starting dose of irinotecan was recommended for UGT1A1*28/*28 homozygotes [27]. UGT1A1*6 is a missense variants (Gly71Arg) in UGT1A1 exon 1 that leads to decreased UGT1A1 enzyme function [28] and is also a risk factor for irinotecan toxicity. UGT1A1*6 variant is mainly observed in the Asians with allele frequency ranges in 15–30%. In 2008, the Ministry of Health, Labour, and Welfare of Japan also warned increased risk of severe irinotecan-related neutropenia in Japanese patients carrying the UGT1A1*6 or *28 allele, and approved diagnostic test for UGT1A1 genotypes [29]. As UGT1A is involved in Ara-C detoxification, we hypothesized that the functional polymorphisms in UGT1A1 may affect chemosensitivity to Ara-C based therapies in AML patients through influence Ara-C metabolism, which could eventually improve responses to Ara-C and AML prognosis.
In this study, we investigated the impact of UGT1A1*28 and *6 variants on CR rate after induction chemotherapy, treatment-related mortality (TRM), OS and event-free survival (EFS) in 726 Chinese AML patients treated with Ara-C.
Methods
Study design and patient population
In this study, a total of 726 patients were enrolled at Xiangya Hospital, Central South University between May 2009 and Feb 2017. This study was approved by the Ethics Committee of Institute of Clinical Pharmacology of Central South University (No. CTXY-120025-2) and conducted in compliance with the provisions of the Declaration of Helsinki (Chinese Clinical Trial Register: ChiCTR-PPC-14005297). All patients provided written informed consent that explicitly included genetic information sharing with qualified investigators before enrollment.
The patients > 14 years of old of age, diagnosed with de novo AML or secondary AML (according to the WHO criteria), and were planned to be treated with Ara-C based induction chemotherapy were enrolled. Those diagnosed as acute promyelocytic leukemia (M3 AML), therapy-related AML (T-AML), acute mixed lineage leukemia, or accompanied by other serious diseases were excluded from this study. For the induction therapy, patients received a standard-dose of Ara-C (100–200 mg/m2 continuous infusion × 7 days) in combination with one of the anthracyclines (daunorubicin 45–90 mg/m2, or idarubicin 10–20 mg/m2, or aclarubicin 20 mg/m2, or pirarubicin 30 mg/m2, or mitoxantrone 8–16 mg/m2 × 3 day). Granulocyte colony-stimulating factor (G-CSF) were used for some patients for the prevention or treatment of myelosuppression. Some elderly patients received low-intensity therapy regimens included low-dose Ara-C (10–20 mg/m2 × 14 days) were also enrolled. Once CR was achieved, the patients were treated with sequential consolidation therapy consisting of Ara-C and anthracyclines or hematopoietic stem cell transplantation (HSCT). Clinical information of the patients was collected from the medical records, regular outpatient review, and trimonthly telephone following-up. All clinical events were recorded at least once per 3 months and the follow-up ended on Nov 31st, 2017. A flow diagram of the process for participant recruitment was illustrated in Additional file 5: Fig. S2.
Response criteria and evaluation of end points
The primary endpoint was drug response, which was categorized as CR or non-CR after the second cycle of the induction chemotherapy according to the criteria of International Working Group AML criteria [30]. The criteria of CR was defined as follows: less than 5% blasts and no blasts with Auer rods in the bone marrow, no persistence of extramedullary disease, absolute neutrophil count of > 1×10⁹/l and platelets of > 100 × 109/l, and independent of transfusion. Participants with other treatment outcomes including partial remission, non-remission and TRM after two courses of induction chemotherapy were classified as non-CR group. As mortality tended to be decreased sharply in 4 weeks after the initiation of induction therapy in de novo AML [31], TRM was defined as death within 28 days after initiation of induction therapy. OS was calculated from the date of diagnosis until death from any cause, and EFS was calculated since the date of CR until the date of relapse or death from any cause. Patients who underwent HSCT after achievement of CR were censored at the date of HSCT for OS and EFS. For those patients living or with no evidence of relapse by the end of the study follow-up, time for OS or EFS was censored on the date of the patient’s last follow-up [30].
Genotyping of UGT1A1*6 and *28
Peripheral venous blood samples were collected into EDTA-anticoagulate tubes. Genomic DNA was extracted using a E.Z.N.A.® SQ Blood DNA Kit II (Omega Bio-Tek, USA) according to the manufacturer’s instructions and stored at − 80 °C until use. Genotyping of UGT1A1 polymorphisms was carried out by polymerase chain reaction (PCR) and pyrosequencing as described previously [32]. Briefly, The DNA fragments flanking the UGT1A1*28 or *6 polymorphisms were amplified using Mastercycler (Eppendorf, Germany) in a final reaction volume of 50 µl, which contained 2 µl DNA, 5 µl PCR buffer, 1.5 µl dNTP, 0.5 ul DNA polymerase, 0.05 nM of each amplification primer (Additional file 1: Table S1), and 40 μl sterile double-distilled water. The thermal cycling of PCR was used as follows: degeneration at 94 °C for 5 min; 35 cycles of 94 °C for 30 s, 58 °C or 66 °C for 30 s respectively, and 72 °C for 30 s; and a final extension 72 °C for 7 min. The PCR products were verified by agarose electrophoresis, followed by pyrosequencing on the PyroMark Q24 Advanced platform (Qiagen, Germany) using PyroMark Reagents (Qiagen, Germany) with the pyrosequencing primer (Additional file 1: Table S1). Genotyping results of each SNP were verified in 5% samples selected randomly using Sanger sequencing.
Statistical analysis
Comparisons of continuous data between genotype groups were performed by independent Student’s T test or Mann–Whitney U test. Fisher’s exact test, Continuity correction or Pearson Chi Square test were applied to assess differences in chemotherapy response, toxicity and other clinical information between the genotypes. Logistic regression analysis was carried out to estimate the relative risk of non-CR adjusted for age, risk stratification, and WBC count. The Kaplan–Meier curves were depicted and log-rank test was performed to determine the differences in OS and EFS between/among genotype groups. Hazard ratios for OS and EFS were estimated by Cox proportional hazards model adjusting for potential confounding covariates (including risk stratification, WBC count, and age). All analyses were performed using the SPSS software version 18.0 (IBM Corporation, USA), and the level of statistical significance was defined as P < 0.05 in a two-sided test. The HaploView 4.2 software was used to analyze Hardy–Weinberg equilibrium (HWE) of the genotypes and linkage disequilibrium between the SNPs.
Results
Patient characteristics and follow-up
A total of 726 AML patients were eligible and adopted in the study. The baseline characteristics of the patients were summarized in Table 1. The mean age of the patients was 41 years, and 78 patients (10.7%) were aged 60 or more. M2 (51.2%) was the most frequent French–American–British (FAB) subtype for the patients, followed by M4 (20.5%) and M5 (20.1%). Risk stratification based on cytogenetic and molecular abnormalities was available for 622 patients: 152 low risk, 330 intermediate risk, and 140 high risk. FLT3 mutation status, karyotypes and the first induction therapy regimens were shown in Additional file 2: Table S2. During the first induction therapy, 692 patients received standard-dose Ara-C with anthracycline or mitoxantrone regimens, and 34 (4.7%) patients received low-intensity regimens of decitabine and subcutaneous Ara-C. G-CSF was given to 137 (18.9%) patients simultaneously to avoid myelosupression (Additional file 2: Table S2).
The overall CR rate after the first cycle of induction therapy was 40.2% (288/716). Assessment of response to chemotherapy after two courses of Ara-C based induction chemotherapy was available for 697 patients, and 489 (70.1%) patients achieved CR after 2 cycles of induction therapy. A total of 567 patients achieved CR ultimately after induction therapy. The mean and median follow-up periods for the 726 patients were 667 and 434 days, respectively (range 25–2903 days). The median EFS and OS values for the patients were 488 days and 607 days, respectively. During the follow-up, 232 (40.9%, 232/567) patients relapsed after achievement of CR, and 373 (51.4%, 373/726) patients died by the end of the follow-up period.
UGT1A1*6 and UGT1A1*28 polymorphisms were genotyped in the patient cohort. For the UGT1A1*6 polymorphism, genotype frequencies for the *1/*1, *1/*6, and *6/*6 were 493 (67.9%), 209 (28.8%), and 24 (3.3%), respectively. For the UGT1A1*28 polymorphism, genotype frequencies for the *1/*1, *1/*28 and *28/*28 were 79.8% (579 patients), 18.2% (132 patients), and 2.0% (15 patients), respectively. The genotype distribution was in accordance with HWE for the UGT1A1*6 polymorphism (P = 0.819) but not the UGT1A1*28 polymorphism (P = 0.048). No obvious linkage disequilibrium (LD) between the two polymorphisms was observed (r2 = 0.027). Overall, no significant difference in baseline characteristics was observed between patients carrying the wild-type and mutant UGT1A1 genotypes (Table 1).
Associations between UGT1A1 polymorphisms and response to chemotherapy
Comparisons of response to two courses of induction therapy among the UGT1A1 genotypes were shown in Table 2. Patients carrying the UGT1A1*6 allele (*1/*6 + *6/*6 genotypes) showed significantly higher CR rate after two cycles of induction therapy compared to those carrying the *1/*1 genotype (77.0% vs 66.9%, P = 0.007). Similarly, carriers of the UGT1A1*28 allele (*1/*28 + *28/*28 genotypes) also showed marginally significantly increased CR rate than the *1/*1 homozygotes (76.4% vs 68.5%, P = 0.068). When combined genotypes for both polymorphisms were considered, wildtype homozygotes for both polymorphisms showed the lowest CR rate (63.8%), carries of the UTG1A1*6 alone, UTG1A1*28 alone, and each of the variant allele (*6 or *28) showed a CR rate of 77.3, 76.8, and 76.9%, respectively. Results of unconditional logistic regression showed that carriers of UTG1A1*6 showed significantly reduced risk of non-CR (OR = 0.604; 95% CI 0.419–0.869, P = 0.007), and carriers of the UTG1A1*28 showed marginally decreased risk of non-CR (OR = 0.673, 95% CI 0.440–1.029, P = 0.068) as compared with corresponding wildtype genotype. As the two polymorphisms showed low LD in our patients, association of the combined genotypes with non-CR risk was also analyzed. Significantly decreased risk of non-CR was observed in patients carrying the UGT1A1*6 or *28 alleles as compared with homozygotes for both polymorphisms (OR = 0.528, 95% CI 0.379–0.737, P = 1.7 × 10⁻⁴, Table 1). Patients with the UGT1A1*28/− or *6/− also showed decreased risk of non-CR after the first induction therapy (OR = 0.672, 95% CI 0.498–0.907, P = 0.009, Additional file 3: Table S3). No significant difference in TRM among the UGT1A1*6 and UGT1A1*28 genotypes was observed (Additional file 4: Table S4).
When adjusted by clinical factors, results of multivariate analysis showed that AML risk stratification, pretreatment WBC count, UGT1A1 genotypes based on *6 and *28 concomitantly, and age showed significant association with non-CR risk after two-courses of induction therapy (Table 3). In details, carriers of the UGT1A1*6 or *28 allele showed decreased risk of non-CR (OR = 0.547, 95% CI 0.375–0.797, P = 0.002); low risk stratification and high risk stratification showed decreased (OR = 0.457, 95% CI 0.269–0.776, P = 0.004) and increased (OR = 2.045, 95% CI 1.331–3.140, P = 0.001) risk of non-CR, respectively, as compared with intermediate risk stratification; pretreatment WBC count and age was associated with increased risk of non-CR (WBC count: OR = 1.004, 95% CI 1.001–1.007, P = 0.008 for; Age: OR = 1.014, 95% CI 1.001–1.028, P = 0.036). Association between UGT1A1*6 or *28 carrying status, risk stratification and pretreatment WBC count were also associated with risk of non-CR for the first induction therapy (Table 3).
Association between UGT1A1 polymorphisms and AML prognosis
Association of the UGT1A1 polymorphisms with OS and EFS of the AML patients was also analyzed. In univariate analysis, patients carrying the UGT1A1*28 allele (P = 0.047) or carrying at least one of the UGT1A1*28 and UGT1A1*6 alleles (P = 0.007) showed significantly better OS (Fig. 1), carriers of the UGT1A1*6 allele alone showed marginally better OS (P = 0.091, Fig. 1e). Median OS was 727 days (range 530–924 day) for carriers of the UGT1A1*28 or UGT1A1*6 alleles, and was 514 days (range 427–601 day) for the UGT1A1*1/*1 homozygotes. In cox proportional hazards model, carrier of at least one of the UGT1A1*28 and UGT1A1*6 alleles showed better OS (HR = 0.787, 95% CI 0.627–0.990, P = 0.04), while high risk stratification, WBC count and age were associated with worse OS (Table 4). High risk stratification was also associated with worse EFS (HR = 1.652, 95% CI 1.188–2.297, P = 0.003) for the patients. Neither UGT1A1*28 nor UGT1A1*6 polymorphism was associated with EFS of the patients (Additional file 5: Fig. S1).
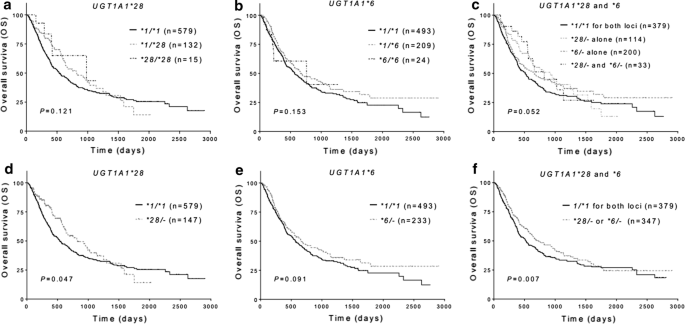
Influence of UGT1A1*28 and *6 polymorphisms on overall survival (OS) in AML patients. a, d Comparison of OS among genotypes of UGT1A1*28. b, e Comparison of among genotypes of UGT1A1*6. c, f Combined effects of UGT1A1*28 and *6 on OS
Discussion
UGT1A is a newly identified enzyme subfamily that is involved in Ara-C detoxification. In this study, we performed an association study on UGT1A1 polymorphisms with responses to Ara-C and disease prognosis in AML patients for the first time. We observed that carriers of the UGT1A1*6 variant or carriers of any of the UGT1A1*6 and UGT1A1*28 alleles showed significantly decreased risk of non-CR after one and two courses of Ara-C based induction chemotherapy for AML patients. We also observed that carriers of the UGT1A1*6 or UGT1A1*28 alleles showed significantly better OS in AML patients.
Glucuronidation is an important way of metabolism for many small endogenous and exogenous lipophilic compounds and is mediated by UDP-glucuronosyltransferases (UGTs) located in the endoplasmic reticulum. UGT1A1 is the most abundant member of the UGT1A family in human liver and is also the major isoform responsible for the glucuronidation of bilirubin (UGT1A1 specific), SN-38 (the active metabolite of irinotecan), β-estradiol, etc. [33, 34]. UGT1A1*6 and *28 are two functional polymorphisms that lead to decreased glucuronidation activity. UGT1A1*28 is characterized by an extra TA repeat (TA-7) in UGT1A1 promoter that decreases the gene transcription, and SN-38 glucuronidating activity was decreased by approximately 25 and 50%, respectively, in liver microsomes from UGT1A1*28 heterozygotes and homozygotes [35]. Similarly, UGT1A1*6 is a missense variant that results in decreased UGT1A1 activity by about 50% as indicated by bilirubin and SN-38 glucuronidation [36, 37], and the variant is primarily observed in the Asians. Clinical studies have shown that the two polymorphisms were associated with increased risk of Gilbert’s syndrome or irinotecan-reduced toxicity in Caucasians and Asians [38].
A previous study by Zahreddine reported for the first time that Ara-C is a substrate of UGT1A enzymes and could be inactivated through glucuronidation [20]. Increased UGT1A expression in Ara-C resistant M5 AML THP-1 cells and relapsed AML after standard Ara-C therapies were observed, and elevation in GLI1 expression is sufficient to drive UGT1A dependent glucuronidation of Ara-C and drug resistance [20]. However, by analyzing the mRNA expression profile of the Cancer Genome Atlas (TCGA) dataset, we observed that the expression of UGT1A1 in blast cells from AML patients was nearly negligible in contrast to the main Ara-C inactivating enzyme CDA (Additional file 5: Fig. S3) [39]. These findings suggest that the observed influence of UGT1A1*28 and *6 polymorphisms on Ara-C response in AML patients is less likely to be explained by decreased Ara-C detoxification in AML blast cells. As the UGT1A subfamily is mainly expressed in human liver, we speculate that the UGT1A1*28 and *6 polymorphisms may improve Ara-C response and OS of the AML patients through decreasing hepatic glucuronidation and increasing the systemic exposure of Ara-C. It’s a pity that we failed to detect the plasma concentrations of Ara-C during Ara-C infusion. Of note, AML is usually treated by combined therapy with Ara-C and anthracyclines, and whether UGT1A1 is involved in the metabolism of anthracyclines remains unknown. Therefore, we could not rule out the possibility that difference in disease outcomes among UGT1A1 genotypes is due to difference in anthracycline metabolism. Influence of both UGT1A1 polymorphisms on pharmacokinetics and systemic exposure of Ara-C and glucuronidated Ara-C (AraC-Glu) deserved further study in future.
We noticed that the predictive value of UGT1A1*28 and *6 polymorphisms on CR after Ara-C based induction therapy is modest in AML patients (CR rate 76.9% in carriers of the UGT1A1*28 and *6 alleles and 63.8% in UGT1A1*1/*1 for both loci), and the association of UGT1A1*28 alone with non-CR risk was nonsignificant after Bonferroni correction for two SNPs (significance set at P < 0.05/2 for 2 SNPs). This may be explained by two reasons: firstly, the lower allele frequency of the UGT1A1*28 polymorphism in our patient cohort. Secondly, the multigenic characteristic of drug response including Ara-C. In our previous studies, we observed that polymorphisms in other genes encoding enzymes in the Ara-C metabolic pathway such as DCK, NME2 (DNPK-B), RRM2, and SAMHD1 are also associated drug response to Ara-C based therapies in AML [10, 16]. We suggest that the construction of a decision tree based on multiple genetic variations concomitantly may increase the predictive values of pharmacogenetics biomarkers in AML induction therapy. Of course, the exact usefulness requires to be explored with a large sample size.
Regarding disease prognosis including OS and EFS, we observed better OS in carriers of UGT1A1*28, or carriers of at least one of the UGT1A1*6 and *28 alleles. Neither polymorphisms nor the combined genotypes were associated with EFS in our study. As EFS was considered only in patients achieved CR after induction therapies, lack of association between UGT1A1 polymorphisms and EFS observed in our study suggests other mechanisms other than chemosensitivity might also play a role in AML prognosis.
Conclusions
In summary, we identified UGT1A1 functional variants as independent factors for better response to Ara-C based chemotherapy and disease prognosis in Chinese AML patients. These findings provide new insightful information for individualized chemotherapy for AML patients. Consideration the ethnic difference in allele frequencies of the UGT1A polymorphisms, the positive findings in our study deserved further validation in AML patient cohorts with different ethnic background. Future prospective studies to evaluate influence of UGT1A1 genotypes on pharmacokinetics and metabolism of Ara-C are also warranted to explore the exact mechanisms of our clinical findings.
Abbreviations
- UGT1A1:
-
UDP-glucuronosyltransferase family 1 member A1
- UGT1A:
-
UDP-glucuronosyltransferase 1A subfamily
- Ara-C:
-
cytarabine
- AML:
-
acute myeloid leukemia
- CR:
-
complete remission
- OR:
-
odds ratio
- CI:
-
confidence interval
- OS:
-
overall survival
- HR:
-
hazard ratio
- WBC:
-
white blood cell
- FLT3 :
-
Fms-like tyrosine kinase 3
- NPM1 :
-
nucleophosmin 1
- CEBPA :
-
CCAAT/enhancer binding protein alpha
- KIT :
-
KIT proto-oncogene receptor tyrosine kinase
- TP53 :
-
tumor protein p53
- DNMT3a :
-
DNA methyltransferase 3 alpha
- Ara-CTP:
-
cytarabine triphosphate
- DCK:
-
deoxycytidine kinase
- CDA:
-
cytidine deaminase
- SAMHD1:
-
SAM domain and HD domain-containing protein 1
- NME2 :
-
nucleoside diphosphate kinase 2
- RRM2 :
-
ribonucleotide reductase catalytic subunit M2
- HH:
-
Hedgehog
- GLI:
-
Glioma-associated Oncogene Homolog
- MDS:
-
myelodysplastic syndromes
- SNPs:
-
single nucleotide polymorphisms
- TRM:
-
treatment-related mortality
- EFS:
-
event-free survival
- T-AML:
-
therapy-related AML
- G-CSF:
-
granulocyte colony-stimulating factor
- HSCT:
-
hematopoietic stem cell transplantation
- PCR:
-
polymerase chain reaction
- TCGA:
-
Cancer Genome Atlas
- FAB:
-
French–Britain–American
- HWE:
-
Hardy–Weinberg Equilibrium
- LD:
-
linkage disequilibrium
- UGTs:
-
UDP-glucuronosyltransferases
- LDH:
-
lactate dehydrogenase
- RBC:
-
red blood cell
- AraC-Glu:
-
glucuronidated Ara-C
- AA:
-
aclacinomycin and cytarabine
- DA:
-
daunorubicin and cytarabine
- IA:
-
idarubicin and cytarabine
- MA:
-
mitoxantrone and cytarabine
- TA:
-
pirabucin and cytarabine
References
Dohner H, Weisdorf DJ, Bloomfield CD. Acute myeloid leukemia. N Engl J Med. 2015;373:1136–52.
Arber DA, Orazi A, Hasserjian R, Thiele J, Borowitz MJ, Le Beau MM, et al. The 2016 revision to the World Health Organization classification of myeloid neoplasms and acute leukemia. Blood. 2016;127:2391–405.
Papaemmanuil E, Gerstung M, Bullinger L, Gaidzik VI, Paschka P, Roberts ND, et al. Genomic classification and prognosis in acute myeloid leukemia. N Engl J Med. 2016;374:2209–21.
Gale RE, Lamb K, Allen C, El-Sharkawi D, Stowe C, Jenkinson S, et al. Simpson’s paradox and the impact of different DNMT3A mutations on outcome in younger adults with acute myeloid leukemia. J Clin Oncol. 2015;33:2072–83.
Yuan XQ, Zhang DY, Yan H, Yang YL, Zhu KW, Chen YH, et al. Evaluation of DNMT3A genetic polymorphisms as outcome predictors in AML patients. Oncotarget. 2016;7:60555–74.
Wiernik PH, Banks PL, Case DC Jr, Arlin ZA, Periman PO, Todd MB, et al. Cytarabine plus idarubicin or daunorubicin as induction and consolidation therapy for previously untreated adult patients with acute myeloid leukemia. Blood. 1992;79:313–9.
Pastore F, Dufour A, Benthaus T, Metzeler KH, Maharry KS, Schneider S, et al. Combined molecular and clinical prognostic index for relapse and survival in cytogenetically normal acute myeloid leukemia. J Clin Oncol. 2014;32:1586–94.
Santamaria CM, Chillon MC, Garcia-Sanz R, Perez C, Caballero MD, Ramos F, et al. Molecular stratification model for prognosis in cytogenetically normal acute myeloid leukemia. Blood. 2009;114:148–52.
Kell J. Considerations and challenges for patients with refractory and relapsed acute myeloid leukaemia. Leuk Res. 2016;47:149–60.
Zhang DY, Yuan XQ, Yan H, Cao S, Zhang W, Li XL, et al. Association between DCK 35708 T>C variation and clinical outcomes of acute myeloid leukemia in South Chinese patients. Pharmacogenomics. 2016;17:1519–31.
Galmarini CM, Thomas X, Graham K, El Jafaari A, Cros E, Jordheim L, et al. Deoxycytidine kinase and cN-II nucleotidase expression in blast cells predict survival in acute myeloid leukaemia patients treated with cytarabine. Br J Haematol. 2003;122:53–60.
Bhatla D, Gerbing RB, Alonzo TA, Conner H, Ross JA, Meshinchi S, et al. Cytidine deaminase genotype and toxicity of cytosine arabinoside therapy in children with acute myeloid leukemia. Br J Haematol. 2009;144:388–94.
Herold N, Rudd SG, Ljungblad L, Sanjiv K, Myrberg IH, Paulin CB, et al. Targeting SAMHD1 with the Vpx protein to improve cytarabine therapy for hematological malignancies. Nat Med. 2017;23:256–63.
Schneider C, Oellerich T, Baldauf HM, Schwarz SM, Thomas D, Flick R, et al. SAMHD1 is a biomarker for cytarabine response and a therapeutic target in acute myeloid leukemia. Nat Med. 2017;23:250–5.
Marin JJ, Briz O, Rodriguez-Macias G, Diez-Martin JL, Macias RI. Role of drug transport and metabolism in the chemoresistance of acute myeloid leukemia. Blood Rev. 2016;30:55–64.
Zhu KW, Chen P, Zhang DY, Yan H, Liu H, Cen LN, et al. Association of genetic polymorphisms in genes involved in Ara-C and dNTP metabolism pathway with chemosensitivity and prognosis of adult acute myeloid leukemia (AML). J Transl Med. 2018;16:90.
Aberger F, Hutterer E, Sternberg C, Del Burgo PJ, Hartmann TN. Acute myeloid leukemia—strategies and challenges for targeting oncogenic Hedgehog/GLI signaling. Cell Commun Signal. 2017;15:8.
Cortes JE, Heidel FH, Heuser M, Fiedler W, Smith BD, Robak T, et al. A phase 2 randomized study of low dose ara-c with or without glasdegib (PF-04449913) in untreated patients with acute myeloid leukemia or high-risk myelodysplastic syndrome. Blood. 2016;128:99.
Liang H, Zheng QL, Fang P, Zhang J, Zhang T, Liu W, et al. Targeting the PI3 K/AKT pathway via GLI1 inhibition enhanced the drug sensitivity of acute myeloid leukemia cells. Sci Rep. 2017;7:40361.
Zahreddine HA, Culjkovic-Kraljacic B, Assouline S, Gendron P, Romeo AA, Morris SJ, et al. The sonic hedgehog factor GLI1 imparts drug resistance through inducible glucuronidation. Nature. 2014;511:90–3.
Rowland A, Miners JO, Mackenzie PI. The UDP-glucuronosyltransferases: their role in drug metabolism and detoxification. Int J Biochem Cell Biol. 2013;45:1121–32.
Mazerska Z, Mroz A, Pawlowska M, Augustin E. The role of glucuronidation in drug resistance. Pharmacol Ther. 2016;159:35–55.
Innocenti F, Undevia SD, Iyer L, Chen PX, Das S, Kocherginsky M, et al. Genetic variants in the UDP-glucuronosyltransferase 1A1 gene predict the risk of severe neutropenia of irinotecan. J Clin Oncol. 2004;22:1382–8.
Ramchandani RP, Wang Y, Booth BP, Ibrahim A, Johnson JR, Rahman A, et al. The role of SN-38 exposure, UGT1A1*28 polymorphism, and baseline bilirubin level in predicting severe irinotecan toxicity. J Clin Pharmacol. 2007;47:78–86.
Hoskins JM, Goldberg RM, Qu P, Ibrahim JG, McLeod HL. UGT1A1*28 genotype and irinotecan-induced neutropenia: dose matters. J Natl Cancer Inst. 2007;99:1290–5.
Toffoli G, Cecchin E, Corona G, Russo A, Buonadonna A, D’Andrea M, et al. The role of UGT1A1*28 polymorphism in the pharmacodynamics and pharmacokinetics of irinotecan in patients with metastatic colorectal cancer. J Clin Oncol. 2006;24:3061–8.
Maitland ML, Vasisht K, Ratain MJ. TPMT, UGT1A1 and DPYD: genotyping to ensure safer cancer therapy? Trends Pharmacol Sci. 2006;27:432–7.
Sai K, Saeki M, Saito Y, Ozawa S, Katori N, Jinno H, et al. UGT1A1 haplotypes associated with reduced glucuronidation and increased serum bilirubin in irinotecan-administered Japanese patients with cancer. Clin Pharmacol Ther. 2004;75:501–15.
Akiyama Y, Fujita K, Nagashima F, Yamamoto W, Endo H, Sunakawa Y, et al. Genetic testing for UGT1A1*28 and *6 in Japanese patients who receive irinotecan chemotherapy. Ann Oncol. 2008;19:2089–90.
Cheson BD, Bennett JM, Kopecky KJ, Buchner T, Willman CL, Estey EH, et al. Revised recommendations of the International Working Group for Diagnosis, Standardization of Response Criteria, Treatment Outcomes, and Reporting Standards for Therapeutic Trials in acute myeloid leukemia. J Clin Oncol. 2003;21:4642–9.
Walter RB, Othus M, Borthakur G, Ravandi F, Cortes JE, Pierce SA, et al. Prediction of early death after induction therapy for newly diagnosed acute myeloid leukemia with pretreatment risk scores: a novel paradigm for treatment assignment. J Clin Oncol. 2011;29:4417–23.
King CR, Marsh S. Pyrosequencing of clinically relevant polymorphisms. Methods Mol Biol. 2013;1015:97–114.
Izukawa T, Nakajima M, Fujiwara R, Yamanaka H, Fukami T, Takamiya M, et al. Quantitative analysis of UDP-glucuronosyltransferase (UGT) 1A and UGT2B expression levels in human livers. Drug Metab Dispos. 2009;37:1759–68.
Court MH, Zhang X, Ding X, Yee KK, Hesse LM, Finel M. Quantitative distribution of mRNAs encoding the 19 human UDP-glucuronosyltransferase enzymes in 26 adult and 3 fetal tissues. Xenobiotica. 2012;42:266–77.
Iyer L, Hall D, Das S, Mortell M, Ramirez J, Kim S, et al. Phenotype-genotype correlation of in vitro SN-38 (active metabolite of irinotecan) and bilirubin glucuronidation in human liver tissue with UGT1A1 promoter polymorphism. Clin Pharmacol Ther. 1999;65:576–82.
Udomuksorn W, Elliot DJ, Lewis BC, Mackenzie PI, Yoovathaworn K, Miners JO. Influence of mutations associated with Gilbert and Crigler–Najjar type II syndromes on the glucuronidation kinetics of bilirubin and other UDP-glucuronosyltransferase 1A substrates. Pharmacogenet Genomics. 2007;17:1017–29.
Jinno H, Tanaka-Kagawa T, Hanioka N, Saeki M, Ishida S, Nishimura T, et al. Glucuronidation of 7-ethyl-10-hydroxycamptothecin (SN-38), an active metabolite of irinotecan (CPT-11), by human UGT1A1 variants, G71R, P229Q, and Y486D. Drug Metab Dispos. 2003;31:108–13.
Stingl JC, Bartels H, Viviani R, Lehmann ML, Brockmoller J. Relevance of UDP-glucuronosyltransferase polymorphisms for drug dosing: a quantitative systematic review. Pharmacol Ther. 2014;141:92–116.
Cancer Genome Atlas Research N, Ley TJ, Miller C, Ding L, Raphael BJ, Mungall AJ, et al. Genomic and epigenomic landscapes of adult de novo acute myeloid leukemia. N Engl J Med. 2013;368:2059–74.
Authors’ contributions
PC and K-WZ collected the clinical samples, genotyped, performed the follow-up, analyzed the data and prepared the manuscript. D-YZ, HY, HL, and Y-LL collected and characterized the data. SC, GZ, HZ, S-PC, X-LZ and JY contributed to patients’ recruitment, X-PC designed the study and revised manuscript. All authors read and approved the final manuscript.
Acknowledgements
We thank all patients who participated in this study, all doctors and medical staff (Department of Hematology, Xiangya Hospital) for recruitment of patients.
Competing interests
The authors declare that they have no competing interests.
Availability of data and materials
The datasets supporting the conclusions of this article are included within the article (and its additional files).
Consent for publication
Not applicable
Ethics approval and consent to participate
This study was approved by the Ethics Committee of Institute of Clinical Pharmacology, Central South University (Registration Number: CTXY-120025-2). Clinical study admission (Registration Number: ChiCTR-PPC-14005297) was approved by the Chinese Clinical Trial Register and informed consent was obtained from each patient or their family members.
Funding
This work was supported by the National Natural Science Foundation of China (Nos. 81673518, 81422052), the National key R&D program (No. 2017YFC0909302), and the Clinical Research Foundation of Xiangya Hospital (No. 2016L04).
Publisher’s Note
Springer Nature remains neutral with regard to jurisdictional claims in published maps and institutional affiliations.
Author information
Authors and Affiliations
Corresponding author
Additional files
Additional file 1: Table S1.
Primer sequences used to genotype UGT1A1*28 and *6.
Additional file 2: Table S2.
Clinical features of AML patients according to UGT1A1 genotypes (additional).
Additional file 3: Table S3.
Comparison of CR rate among UGT1A1 genotypes after the first course of induction therapy.
Additional file 4: Table S4.
Comparison of TRM among UGT1A1 genotypes after two cycles of induction therapy in AML patients.
Additional file 5: Fig. S1.
Impact of UGT1A1*28 or *6 on event-free survival (EFS) in AML patients. (a, d) comparison of EFS among genotypes of UGT1A1*28. (b, e) comparison of among genotypes of UGT1A1*6. (c, f) combined effects of UGT1A1*28 and *6 on EFS. Fig. S2. Flow chart of the study population. Fig. S3. Gene expression of CDA and UGT1A1 mRNA in blasts from AML patients from the Cancer Genome Atlas (TCGA) dataset (n = 173). AML blast cells scarcely express UGT1A1.
Rights and permissions
Open Access This article is distributed under the terms of the Creative Commons Attribution 4.0 International License (http://creativecommons.org/licenses/by/4.0/), which permits unrestricted use, distribution, and reproduction in any medium, provided you give appropriate credit to the original author(s) and the source, provide a link to the Creative Commons license, and indicate if changes were made. The Creative Commons Public Domain Dedication waiver (http://creativecommons.org/publicdomain/zero/1.0/) applies to the data made available in this article, unless otherwise stated.
About this article

Cite this article
Chen, P., Zhu, KW., Zhang, DY. et al. Influence of UGT1A1 polymorphisms on the outcome of acute myeloid leukemia patients treated with cytarabine-base regimens. J Transl Med 16, 197 (2018). https://doi.org/10.1186/s12967-018-1579-3
Received:
Accepted:
Published:
DOI: https://doi.org/10.1186/s12967-018-1579-3