
Abstract
Background
Recent studies provide evidence that hepatocellular adenomas (HCAs) frequently take up gadoxetic acid (Gd-EOB) during the hepatobiliary phase (HBP). The purpose of our study was to investigate how to differentiate between Gd-EOB-enhancing HCAs and focal nodular hyperplasias (FNHs). We therefore retrospectively included 40 HCAs classified as HBP Gd-EOB-enhancing lesions from a sample of 100 histopathologically proven HCAs in 65 patients. These enhancing HCAs were matched retrospectively with 28 FNH lesions (standard of reference: surgical resection). Two readers (experienced abdominal radiologists blinded to clinical data) reviewed the images evaluating morphologic features and subjectively scoring Gd-EOB uptake (25–50%, 50–75% and 75–100%) for each lesion. Quantitative lesion-to-liver enhancement was measured in arterial, portal venous (PV), transitional and HBP. Additionally, multivariate regression analyses were performed.
Results
Subjective scoring of intralesional Gd-EOB uptake showed the highest discriminatory accuracies (AUC: 0.848 (R#1); 0.920 (R#2)—p < 0.001) with significantly higher uptake scores assigned to FNHs (Cut-off: 75%-100%). Typical lobulation and presence of a central scar in FNH achieved an accuracy of 0.750 or higher in at least one reader (lobulation—AUC: 0.809 (R#1); 0.736 (R#2); central scar—AUC: 0.595 (R#1); 0.784 (R#2)). The multivariate regression emphasized the discriminatory power of the Gd-EOB scoring (p = 0.001/OR:22.15 (R#1) and p < 0.001/OR:99.12 (R#2). The lesion-to-liver ratio differed significantly between FNH and HCA in the PV phase and HBP (PV: 132.9 (FNH) and 110.2 (HCA), p = 0.048 and HBP: 110.3 (FNH) and 39.2 (HCA), p < 0.001)), while the difference was not significant in arterial and transitional contrast phases (p > 0.05).
Conclusion
Even in HBP-enhancing HCA, characterization of Gd-EOB uptake was found to provide the strongest discriminatory power in differentiating HCA from FNH. Furthermore, a lobulated appearance and a central scar are more frequently seen in FNH than in HCA.
Key points
-
1.
High signal intensity during the HBP, hence significant Gd-EOB enhancement, is not uncommon for HCA and may be a pitfall in differentiating HCA from FNH.
-
2.
The scoring system we introduced was found to provide high discriminatory power in differentiating HCA from FNH and may overcome imaging pitfalls.
-
3.
Acceptable accuracies were also achieved with a lobulated appearance and presence of a central scar as both features are more common in FNH than in HCA.
Introduction
Focal nodular hyperplasia (FNH) and hepatocellular adenoma (HCA) are among the most benign solid neoplasms of the liver and have the highest incidence in young adolescent to middle aged women [1]. Especially for HCA, a correlation with intake of oral contraceptive pills (OCPs) has been reported [2,3,4]. Reliable noninvasive differentiation by liver imaging is crucial as treatment differs for FNH and HCA. FNHs are commonly treated conservatively, while HCA should be resected because subtypes tend to bleed spontaneously or may undergo malignant transformation [5,6,7,8,9,10,11,12,13].
Magnetic resonance imaging (MRI) is the imaging modality of choice for characterizing focal liver lesions (FLLs). Evidence is high for differentiation of benign liver lesions (especially HCA and FNH) using liver-specific contrast agents such as gadoxetic acid (Gd-EOB; Primovist or Eovist, Bayer Pharma, Berlin, Germany) or gadobenate dimeglumine (Gd-BOPTA; Multihance, Bracco Imaging, Italy) [5, 12, 14,15,16,17,18,19].
Published studies report significant hepatobiliary phase (HBP) Gd-EOB uptake for the majority of FNHs, resulting in iso- to hyperintensity to the surrounding liver, while most HCAs appear hypointense [8, 14, 15, 20, 21]. Occasional, FNHs may show atypical HBP appearances such as partial hypointensity or rim enhancement [5, 15, 22]. In contrast, a significant portion of HCAs, have recently been shown to appear (partially) hyperintense during the HBP, even mimicking the appearance of FNHs on Gd-EOB MRI [23,24,25]. These findings point to important pitfalls in differentiating FNH and HCA which could lead to unnecessary procedures like biopsies or surgery.
The purpose of this study was to determine how significantly Gd-EOB-enhancing HCA and FNH can be differentiated [26].
Materials and methods
Patients
Our institutional review board (Charité Ethics Committee, Charité – University Medicine Berlin) approved this retrospective study (internal registration number EA2/016/14) and waived informed consent due to its retrospective nature. The study protocol conforms to the ethical guidelines of the 2002 Declaration of Helsinki. Imaging datasets were evaluated by two independent radiologists specialized in abdominal imaging (> 10 years of liver MRI experience). Primary endpoint was the discrimination between benign focal liver lesion, either FNH or HCA.
Patient enrollment
In a first step, all patients with histopathologically confirmed HCA lesions (n = 100) who underwent Gd-EOB-enhanced liver MRI between January 2008 and March 2019 were retrospectively identified from our institutional databases. A “blinded” pathologist evaluated all macroscopic and microscopic features of the lesions, followed by reprocessing for immunohistochemical analysis. HCAs were classified into the four major molecular subgroups based on their genetic and phenotypic characteristics according to the Bordeaux classification from 2006 (HNF-1a-mutated adenoma (HHCA), inflammatory adenoma (IHCA—formerly telangiectatic FNH), β-catenin-activated adenoma (bHCA), and unclassified adenoma (UHCA)) [11, 27,28,29]. Subdivided by subtype the 100 adenomas consisted out of 41% IHCA, 29% HHCA, 6% bHCA and 24% UHCA.
In a second step, two readers rated intralesional Gd-EOB uptake in steps of 25%. Both readers in consensus identified 40 HCA lesions with an intralesional Gd-EOB uptake greater than 25%, which were defined as significantly enhancing lesions [25]. In a third step, all histopathologically confirmed FNHs from January 2008 to March 2019 were retrospectively identified (n = 28) from the institutional databases who were examined with a Gd-EOB MRI. This inclusion process resulted in a final sample of 68 lesions—28 FNHs and 40 HCAs.
Some of the HCA patients participated in previous studies [15, 19, 25].
Imaging*
MRI was performed at either 1.5 T or 3.0 T MR scanner. Phased-array body coils were used in every patient. Standard imaging protocols included the following sequences: pre-contrast T2-weighted (T2-w) sequences with and without fat saturation (FS); T1-weighted (T1-w) sequences with and without FS (including in-/opposed-phase technique). After intravenous injection of Gd-EOB (0.025 mmol/kg body weight; flow rate of approximately 1–2 mL/s) and a 40 mL saline flush, multiphase T1-w 3D sequences with FS were acquired during breath-holds (arterial phase with a fixed delay of 18 s, portal venous phase with 55 s delay, and transitional phase with 90 s delay). The hepatobiliary phase was acquired with a 3D T1-w FS sequences 20 min after contrast administration [25].
Qualitative analysis
All images were read by two experienced radiologists specialized in abdominal / liver imaging (one with over 7 years and the other with over 10 years of MRI experience). Both readers were blinded to clinical data. The following qualitative parameters were recorded:
Gd-EOB-specific characteristics:
-
Intralesional HBP Gd-EOB uptake was rated subjectively as intralesional percentage of iso- to hyperintense areas on a five-point scale (0: 0%; 1: 10–25%; 2: 25–50%; 3: 50–75%, and 4: > 75%) (Fig. 1). Gd-EOB uptake scores of 0–1 were classified as “non-enhancing” and scores of 2–3 as “significantly enhancing lesion” [25]. Lesions with greater 75% uptake (score 4) were classified as “entirely enhancing lesion” (Fig. 1).
Fig. 1 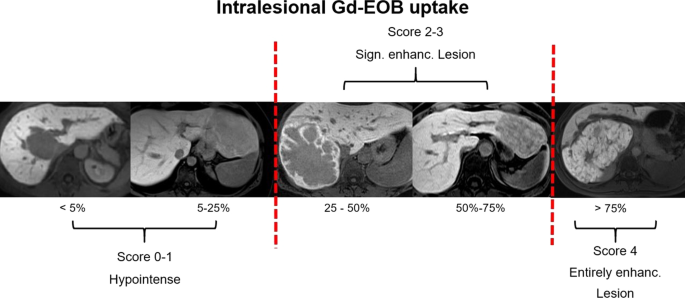
Intralesional Gd-EOB uptake in the HBP was rated subjectively as iso- to hyperintensity percentage on a 5-point scale (score 0: 0%; score 1: 10–25%; score 2: 25–50%; score 3: 50–75%; score 4: > 75%). Lesions with scores of 0–1 were defined as hypointense and excluded during compilation of the sample. Lesions with scores of 2–3 were defined as “significantly enhancing lesions” while a lesion with a score of 4 was defined as “entirely enhancing lesions”
-
Gd-EOB uptake pattern: homogeneous vs. heterogeneous/patchy (incomplete enhancement caused by a pseudocapsule, central scar or the appearance of an atoll sign were not rated as a sign of a heterogeneous Gd-EOB uptake) (Fig. 2).
Fig. 2 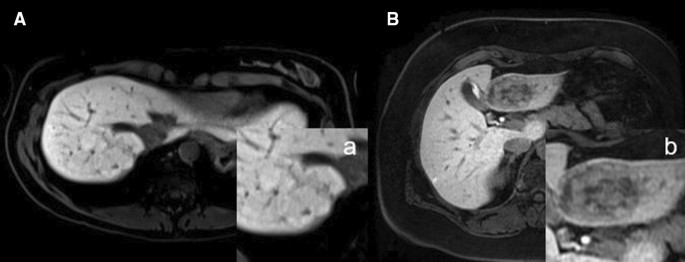
A/a shows a homogeneously and strongly HBP Gd-EOB-enhancing FNH in the left liver lobe. The lesion was classified as “entirely enhancing lesion” based on intralesional Gd-EOB uptake of more than 75% (score of 4). B/b shows HCA (inflammatory subtype (IHCA)) with heterogeneous / patchy HBP Gd-EOB uptake of 50–75% (score of 3), hence defined as “significantly enhancing lesion”


Qualitative MRI features:
-
Contrast enhancement (CE) behavior:
-
Arterial hyperenhancement (AHE): yes vs. no.
-
Portal venous (PV) wash-out: yes vs. no.
-
-
Largest axial diameter (mm).
-
Lobulated: yes vs. no.
-
Pseudocapsule (defined as a thin (mm) T2 hyperintense line around the lesions representing a compression of the surrounding liver tissue, vessels and a consecutive inflammatory reaction): yes vs. no.
-
Central scar (defined as a central T2/T2fs hyperintensity and/or T1w hypointensity representing fibrotic tissue): yes vs. no.
-
Intralesional fat deposition (i.e., signal drop on opposed-phase images compared to in-phase images): yes vs. no.
-
Atoll sign (defined as a hyperintense rim in T2/T2fs sequences probably representing dilated sinusoid spaces with the periphery of adenomas): yes vs. no.
Some of these features are displayed in Fig. 3.

A/a shows an entirely enhancing FNH with a heterogeneous uptake pattern during the HBP. The FNH has a central scar and also appears lobulated. B/s also shows another entirely enhancing FNH during the HBP with a pseudocapsule. In C/c, the same lesion as in B/b clearly shows a T2-hyperintense central scar in the T2w FS sequence. D/d shows the classic atoll sign in an inflammatory subtype of HCA in the right liver lobe. An atoll sign is characterized by a hyperintense rim and a hypointense center in T2w images
After analyzing the qualitative features of the lesions. Each of the two readers had to conclude a diagnosis of either FNH or HCA.
Quantitative analysis*
Dynamic CE behavior
For each liver lesion, a 2D region of interest (ROI) including the entire lesion at its maximum cross-sectional diameter was placed manually. First relative signal intensity (SI) for each lesion and the liver was measured:
Therefore, ROIs were placed in the arterial phase sequence and cloned to the subsequent pre-contrast and post-contrast phase sequences (PV, transitional, and HBP). An additional circular ROI with a fixed 10-mm diameter was placed in healthy liver parenchyma sparing vessels and bile ducts. Furthermore, relative (Rel.) lesion-to-liver enhancement was calculated for the different contrast phases as follows:
Statistics*
Statistical analysis was performed with XLSTAT (Version 2011.0.01; Addinsoft SARL, New York, New York). Proportional distributions were calculated using contingency tables. Descriptive parameters are given as mean and standard deviation. Based on histograms and quantile plots, normal distribution was not assumed for metric parameters, and therefore nonparametric tests were performed. Differences in contrast enhancement between FNHs and HCAs were analyzed using the Mann–Whitney U-test. Cross-tables and the Pearson chi-square test were used to investigate the association of categorical variables. To test inter-reader correlation, a pairwise two-sided Spearman rank correlation test was performed. Diagnostic accuracy in terms of sensitivity and specificity was tested throughout by performing ROC curve analysis. After identifying the parameters with significant univariate accuracy, a multivariate regression was performed for the three most accurate parameters. All tests were two-sided with a level of significance of 0.05 [25].
*As mentioned above some of the patients participated in previous studies with similar methods (see Material and Methods section: Imaging, Quantitative analyses and Statistics) [25].
Results
Patients
During enrollment, we identified 36 patients with a total of 68 pathologically proven FNH or HCA lesions with at least 25% intralesional Gd-EOB uptake. There were 41% (28/68) FNHs and 59% (40/68) HCAs. By far the most common subtype according to the Bordeaux classification was inflammatory HCA, accounting for, 92.5% (37/40), while there were only 2.5% HHCAs, bHCAs, and UHCAs each (1/40) [27,28,29]. Out of the FNH subgroup 14.5% (4/28) developed from fatty liver or alcoholic liver disease while in the HCA subgroup 35% (14/40) of all lesions derived from this background of liver disease (Table 1).
Diagnostic accuracy
The two readers achieved the same overall accuracy rate of 94% (64/68), while for FNH Reader 1 achieved an accuracy of 89% (25/28) and Reader 2 100% (28/28). For HCA, Reader 1 achieved 97.5% (39/40) and Reader 2 90% (36/40). There was excellent and significant interreader agreement with 0.835 and p < 0.001 (Table 1).
Gd-EOB MRI characteristics
In the total study population, 60% (41/68) of all lesions were rated as significantly enhancing (scores of 2–3) and 40% were rated as entirely enhancing (40/79) (score > 4) in HBP. Eighty-two percent of all FNH lesions (23/28) were classified as entirely enhancing lesions and 12.5% (5/40) as “only” significantly enhancing. In the HCA group, 87.5% of all lesions (35/40) were classified as significantly enhancing. The difference between the two groups of lesions was statistically significant. Interreader agreement of Gd-EOB scoring in HBP was excellent for both readers (p < 0.001–0.872).
In addition to percentage Gd-EOB uptake, we also evaluated the uptake pattern as either homogeneous or heterogeneous/patchy (Fig. 2). Of all lesions, 79.5% (54/58) were classified as homogeneously Gd-EOB-enhancing. When subdivided, 93% (26/28) of all FNHs were described as homogeneously enhancing while the majority of HCAs, 70% (28/40), were classified as heterogeneously enhancing (p < 0.001). Interreader agreement of uptake pattern evaluation was good (0.604) and significant (p < 0.001) (Table 1).
Subjective CE behavior
During the arterial phase, the majority of all lesions, 89% (58/65) were classified as enhancing. There was no significant difference between FNHs (88%, 22/25) and HCAs (87.5%, 35/40). Wash-out during the portal venous phase was noted in only 9% (6/65) of all lesions—4% in the FNH subgroup (1/25) and 12.5% in the HCA subgroup (5/40) (p = 0.249).
Morphological MRI features
Among all qualitative MRI features investigated here, only lobulation and presence of a central scar differed significantly between FNH and HCA. Overall, 52% (36/68) of all lesions were classified as lobulated—89% (25/28) of all FNHs as opposed to only 27.5% (11/40) of all HCAs. A central scar was described in 35.5% (24/68) of all lesions. In the FNH subgroup, a central scar was observed in 46.5% (13/28) versus only 27.5% of all HCAs (11/40). The results for all qualitative MRI features are compiled in Table 1.
Accuracies—ROC analysis
Accuracies were evaluated for all binary parameters. Gd-EOB uptake behavior, assessed using the above introduced scoring system, showed the highest accuracies for both readers as compared to all other parameters (Reader#1 AUC: 0.848—Sens./Spec.: 82.0/87.5 and PPV/NPV: 82.0/87.5; Reader#2 AUC: 0.920—Sens./Spec.: 96.5/87.5 and PPV/NPV: 84.5/97.0). In line with the results of our contingency table analysis, lobulation and presence of a central scar achieved acceptable accuracies of 0.750 or higher for at least one reader (Lobulation—Reader#1 AUC: 0.809—Sens./Spec.: 89.5/72.5 and PPV/NPV: 69.5/90.5; Reader#1 AUC: 0.736—Sens./Spec.: 82.0/65.0 and PPV/NPV: 62.0/84.0 and Central scar – Reader#1 AUC: 0.595—Sens./Spec.: 46.5/72.5 and PPV/NPV: 54.0/66.0; Reader#2 AUC: 0.784—Sens./Spec.: 89.0/67.5 and PPV/NPV: 66.0/90.0 (Fig. 4). All other accuracy results are displayed in Table 2.

ROC curve analysis. (A/B) Calculated for intralesional Gd-EOB uptake behavior (both readers). (C/D) Calculated for lobulated appearance. (E/F) Calculated for presence of central scar
Multivariate regression model
The Multivariate Regression Model was calculated for both readers out of the three univariate parameters with the highest accuracy levels (HBP-behavior, lobulation and scar). For both readers only the HBP appearance was significant with p = 0.001 / OR: 22.15 (R#1) and p < 0.001 / OR: 99.12 (R#2). For both readers none of the other parameters turned out to be significant (p = 0.067–0-715 / ORs: 0.40–5.62) (Fig. 5).

Multivariate regression model
Dynamic CE behavior
ROI-based relative lesion-to-liver enhancement in the HBP was found to differ significantly between the two types of liver lesions (p < 0.001) with a higher mean ratio for FNH than for HCA. Portal-venous wash-out was found to be stronger for HCA than for FNH (p = 0.048). Mean ratios in the arterial and venous phases did not differ significantly (p = 0.279 and p = 0.107). All results are displayed in Table 1 and Fig. 6.

Relative lesion-to-liver (%) enhancement in the arterial (AP), portal venous (PVP), transitional (TR), and hepatobiliary (HBP) phases for the FNH subgroup (A) and the HCA subgroup (B). C shows a significant difference between the means of FNH and HCA
Discussion
Our results show that Gd-EOB MR imaging provides additional information for differentiating FNH and HCA based on enhancement during the hepatobiliary phase even in Gd-EOB enhancing HCAs. FNHs can be differentiated reliably based on their typical strong and homogeneous HBP uptake behavior, corresponding to more than 75% enhancement of the lesion area, hence defined as entirely enhancing lesion using the system presented here. Adding morphologic features such as a lobulated appearance and the presence of a central scar, can support the discrimination between FNH and Gd-EOB enhancing HCAs. Our scoring system of Gd-EOB uptake appears to be a promising tool for differentiate these two entities even in significantly Gd-EOB enhancing HCA providing a potential solution for not false diagnosing these lesions as FNH.
Although both FNHs and HCAs are rare benign lesions of the liver, their non-invasive differentiation is important for determining further treatment algorithms. FNH does not have a risk for malignant transformation or bleeding and can be described as a so called “do not touch” lesions. In HCA, depending on their size and histological subtype, surgical resection is recommended due to the risk for malignant transformation or bleeding. It is therefore important to discriminate routinely between FNH and HCA with the help of MRI correctly [8, 28]. Earlier studies provide evidence that Gd-EOB-enhanced MRI contributes to the differentiation of FNH from HCA with the former appearing hyperintense and the latter hypointense to the surrounding liver [5, 15]. However, the most recent data show that signal hyperintensity is not uncommon in HCA, and atypical appearances have been reported for both entities [15, 23,24,25]. Thomeer et al. (2014) reported areas of iso- to hyperintensity in 12 of 17 patients (71%) with histopathologically proven HCA of the inflammatory subtype (IHCA) after gadobendate dimenglumine injection [23]. They concluded that, for IHCAs, other imaging features than for noninflammatory HCAs should be used to distinguish between HCAs and FNHs [23]. Agarwar et al. (2014) even conclude that IHCA can mimic the appearance of FNH on Gd-EOB MRI including HBP hyperintensity [24]. These results are in line with a recently published study from our group, in which we presented results suggesting an added benefit of Gd-EOB-enhanced MRI for HCA subtype differentiation [25]. In line with the data of Thomeer et al. and Agawar et. al., we found that the majority of significantly enhancing lesions were of the inflammatory subtype [25].
Unlike Thomeer et al., however, we assume that HBP imaging still provides the highest discriminatory power to distinguish HCA and FNH in the noncirrhotic liver. In the present study, we only analyzed lesions with more than 25% intralesional Gd-EOB uptake. As reported before, we classified intralesional Gd-EOB uptake in steps of 25% [25]. Additionally, we introduced the term “entirely enhancing” for lesions with uptake of more than 75% (Fig. 1). The two readers in our study achieved the highest accuracy rates with sensitivities of 82–96% and specificities of 87.5% when then study lesions were subdivided into “entirely enhancing” and “significantly enhancing” lesions. In comparison to Gd-EOB uptake behavior, only two other features—lobulated appearance of FNHs (sensitivity: 82.0–89.5% and specificity: 65.0–72.5%) and presence of a central scar in FNHs (sensitivity: 46.5–89.0% and specificity: 67.5–72.5%)—achieved acceptable accuracy levels. The Gd-EOB uptake pattern, divided into homogeneous versus heterogeneous enhancement, achieved high sensitivity rates (86.0–93.0%), while specificity (30–42.5%) was poor, as 30% of all HCAs were classified as homogeneously enhancing as well.
As expected, arterial hyperintensity provided high levels of sensitivity without any strong discriminatory power as both FNH and HCA are characterized by hyperintensity in the arterial phase [5, 19, 30]. Even though Grazioli et al. (2012) reported higher arterial signal intensity in FNH than in HCA, it must be borne in mind that IHCA shows greater arterial enhancement than the other subtypes, which is important for this study as the HCA subgroup mainly consisted out of IHCA [4, 5, 31, 32]. In our study, IHCAs accounted for 92.5% of all HCAs, thus making arterial enhancement characteristics an even more unsuitable feature to differentiate HCAs from FNHs. The high percentage of IHCAs also distorts results for portal-venous phase, which is mainly described for HHCA. while, in IHCA, which have wider interstitial spaces, the contrast agent tends to persist during transitional/equilibrium phases. This behavior potentially mimicks FNH, which appears iso- to hyperintense during portal venous and transitional / equilibrium phases [4, 31, 32].
In our cohort, five HCAs were rated as entirely enhancing lesions. We believe that this small group of lesions is highly interesting as these are HCA lesions (4 × IHCA and 1 × bHCA) with the potential of mimicking FNH in Gd-EOB MRI. However, entirely enhancing HCAs are so rare that a statement on how to distinguish them from FNH is only possible in the context of further studies.
The results of our quantitative analysis in terms of CE lesion-to-liver ratios corroborate our qualitative results regarding the discriminatory power of the intralesional Gd-EOB uptake scoring system as the higher mean value in FNH (110.3 ± 39.2), corresponds to a score of 4, and was significantly higher than in HCA (59.2 ± 38.0—p < 0.001). Referring to Thomeer et al. we assume that, although HBP hyperintensities occur frequently in HCA, it is still possible to differentiate FNH and HBP and overcome MRI pitfalls by characterizing their uptake behavior more specifically, as done in our analysis. As also supported by our quantitative lesion-to-liver ratios, the Gd-EOB scoring system presented here may become a tool easy to use in daily clinical routine to discriminate between FNH and significantly enhancing HCA.
Our study has limitations. First, we performed a retrospective study and patients were not enrolled consecutively and although basic MRI sequences were consistent, acquisition parameters differed, as due to their rarity, the collective was enrolled during a time-period of eleven years. Also, the fixed delay after injection of contrast enhanced sequences could lead to missing the optimal timing for some lesions. Second, lesion-to-liver ratios were measured in ROIs and not volumetrically. Third, we only analyzed FNHs and HCAs. Hepatocellular carcinomas can also present as HBP enhancing lesions. To minimize this bias, only patients without cirrhosis were included. Fourth, although readers were blinded, they were aware of the study design, which may have introduced detection bias, especially as only FNH were included who were surgically resected.
Even in Gd-EOB enhancing HCA during the HBP, characterization of Gd-EOB uptake was found to provide the strongest discriminatory power to differentiate HCA from FNH. The scoring system we introduce may facilitate interpretation of MRI and provide an easy-to-use diagnostic tool to overcome the imaging pitfall encountered in the differentiation of significantly enhancing HCA and FNH. Furthermore, a lobulated appearance and the presence of a central scar, which are more common in FNH than in HCA, can be used as additional features.
Availability of data and materials
The datasets used and/or analysed during the current study available from the corresponding author on reasonable request.
References
van den Esschert JW, van Gulik TM, Phoa SS. Imaging modalities for focal nodular hyperplasia and hepatocellular adenoma. Dig Surg. 2010;27:46–55.
Edmondson HA, Henderson B, Benton B. Liver-cell adenomas associated with use of oral contraceptives. N Engl J Med. 1976;294:470–2.
Rooks JB, Ory HW, Ishak KG, et al. Epidemiology of hepatocellular adenoma. The role of oral contraceptive use. JAMA 1979;242:644–648.
Katabathina VS, Menias CO, Shanbhogue AK, et al. Genetics and imaging of hepatocellular adenomas: 2011 update. Radiographics. 2011;31:1529–43.
Grazioli L, Bondioni MP, Haradome H, et al. Hepatocellular adenoma and focal nodular hyperplasia: value of gadoxetic acid-enhanced MR imaging in differential diagnosis. Radiology. 2012;262:520–9.
Barthelmes L, Tait IS. Liver cell adenoma and liver cell adenomatosis. HPB (Oxford). 2005;7:186–96.
Stoot JH, Coelen RJ, De Jong MC, et al. Malignant transformation of hepatocellular adenomas into hepatocellular carcinomas: a systematic review including more than 1600 adenoma cases. HPB (Oxford). 2010;12:509–22.
European Association for the Study of the L. EASL Clinical Practice Guidelines on the management of benign liver tumours. J Hepatol 2016;65:386–398.
Nault JC, Paradis V, Cherqui D, et al. Molecular classification of hepatocellular adenoma in clinical practice. J Hepatol. 2017;67:1074–83.
Nault JC, Couchy G, Balabaud C, et al. Molecular classification of hepatocellular adenoma associates with risk factors, bleeding, and malignant transformation. Gastroenterology. 2017;152(880–894):e886.
van Aalten SM, Terkivatan T, de Man RA, et al. Diagnosis and treatment of hepatocellular adenoma in the Netherlands: similarities and differences. Dig Surg. 2010;27:61–7.
Bieze M, Phoa SS, Verheij J, et al. Risk factors for bleeding in hepatocellular adenoma. Br J Surg. 2014;101:847–55.
Dokmak S, Paradis V, Vilgrain V, et al. A single-center surgical experience of 122 patients with single and multiple hepatocellular adenomas. Gastroenterology. 2009;137:1698–705.
Denecke T, Steffen IG, Agarwal S, et al. Appearance of hepatocellular adenomas on gadoxetic acid-enhanced MRI. Eur Radiol. 2012;22:1769–75.
Grieser C, Steffen IG, Kramme IB, et al. Gadoxetic acid enhanced MRI for differentiation of FNH and HCA: a single centre experience. Eur Radiol. 2014;24:1339–48.
Huppertz A, Breuer J, Fels LM, et al. Evaluation of possible drug-drug interaction between gadoxetic acid and erythromycin as an inhibitor of organic anion transporting peptides (OATP). J Magn Reson Imaging. 2011;33:409–16.
Mohajer K, Frydrychowicz A, Robbins JB, et al. Characterization of hepatic adenoma and focal nodular hyperplasia with gadoxetic acid. J Magn Reson Imaging. 2012;36:686–96.
Purysko AS, Remer EM, Coppa CP, et al. Characteristics and distinguishing features of hepatocellular adenoma and focal nodular hyperplasia on gadoxetate disodium-enhanced MRI. AJR Am J Roentgenol. 2012;198:115–23.
Grieser C, Steffen IG, Seehofer D, et al. Histopathologically confirmed focal nodular hyperplasia of the liver: gadoxetic acid-enhanced MRI characteristics. Magn Reson Imaging. 2013;31:755–60.
Tse JR, Naini BV, Lu DS, et al. Qualitative and quantitative gadoxetic acid-enhanced MR imaging helps subtype hepatocellular adenomas. Radiology. 2016;279:118–27.
Guo Y, Li W, Xie Z, et al. Diagnostic value of Gd-EOB-DTPA-MRI for hepatocellular adenoma: a meta-analysis. J Cancer. 2017;8:1301–10.
Fujiwara H, Sekine S, Onaya H, et al. Ring-like enhancement of focal nodular hyperplasia with hepatobiliary-phase Gd-EOB-DTPA-enhanced magnetic resonance imaging: radiological-pathological correlation. Jpn J Radiol. 2011;29:739–43.
Thomeer MG, Willemssen FE, Biermann KK, et al. MRI features of inflammatory hepatocellular adenomas on hepatocyte phase imaging with liver-specific contrast agents. J Magn Reson Imaging. 2014;39:1259–64.
Agarwal S, Fuentes-Orrego JM, Arnason T, et al. Inflammatory hepatocellular adenomas can mimic focal nodular hyperplasia on gadoxetic acid-enhanced MRI. AJR Am J Roentgenol. 2014;203:W408-414.
Auer TA, Fehrenbach U, Grieser C, et al. Hepatocellular adenomas: is there additional value in using Gd-EOB-enhanced MRI for subtype differentiation? Eur Radiol 2020.
Kitao A, Matsui O, Yoneda N, et al. Differentiation between hepatocellular carcinoma showing hyperintensity on the hepatobiliary phase of gadoxetic acid-enhanced MRI and focal nodular hyperplasia by CT and MRI. AJR Am J Roentgenol. 2018;211:347–57.
Bioulac-Sage P, Blanc JF, Rebouissou S, et al. Genotype phenotype classification of hepatocellular adenoma. World J Gastroenterol. 2007;13:2649–54.
Bioulac-Sage P, Laumonier H, Couchy G, et al. Hepatocellular adenoma management and phenotypic classification: the Bordeaux experience. Hepatology. 2009;50:481–9.
Bioulac-Sage P, Laumonier H, Laurent C, et al. Hepatocellular adenoma: what is new in 2008. Hepatol Int. 2008;2:316–21.
Donati F, Boraschi P, Gigoni R, et al. Focal nodular hyperplasia of the liver: diffusion and perfusion MRI characteristics. Magn Reson Imaging. 2013;31:10–6.
Laumonier H, Bioulac-Sage P, Laurent C, et al. Hepatocellular adenomas: magnetic resonance imaging features as a function of molecular pathological classification. Hepatology. 2008;48:808–18.
Lewin M, Handra-Luca A, Arrive L, et al. Liver adenomatosis: classification of MR imaging features and comparison with pathologic findings. Radiology. 2006;241:433–40.
Acknowledgements
Some of the patients participated in previous studies with similar methods (see Material and Methods section: Imaging, Quantitative analyses and Statistics) [25].
Funding
Open Access funding enabled and organized by Projekt DEAL.
Author information
Authors and Affiliations
Contributions
Timo Alexander Auer M.D. – Conceptualization, Data analysis, Writing the draft. Department of Radiology, Campus Virchow-Klinikum, Charité – Universitätsmedizin Berlin. Berlin Institute of Health (BIH). Thula Walter-Rittel M.D. – Reader. Department of Radiology, Campus Virchow-Klinikum, Charité – Universitätsmedizin Berlin. Dominik Geisel M.D. – Reader. Department of Radiology, Campus Virchow-Klinikum, Charité – Universitätsmedizin Berlin. Wenzel Schöning M.D. – Data curation. Department of General, Visceral and transplant Surgery, Campus Virchow-Klinikum, Charité – Universitätsmedizin Berlin. Moritz Schmelzle M.D. – Data curation. Department of General, Visceral and transplant Surgery, Campus Virchow-Klinikum, Charité – Universitätsmedizin Berlin. Tobias Müller M.D. – Data curation. Department of Internal Medicine with Gastroenterology and Hepatology, Campus Virchow-Klinikum, Charité – Universitätsmedizin Berlin. Bruno Sinn M.D. – Data curation. Institute of Pathology, Charité – Universitätsmedizin Berlin. Timm Denecke M.D. – Conceptualization. Department of Diagnostic and Interventional Radiology, Universitätsklinikum Leipzig. Bernd Hamm M.D. – Data curation. Department of Radiology, Campus Virchow-Klinikum, Charité – Universitätsmedizin Berlin. Uli Fehrenbach M.D. – Conceptualization, Editing the draft. Department of Radiology, Campus Virchow-Klinikum, Charité – Universitätsmedizin Berlin. All authors read and approved the final manuscript.
Corresponding author
Ethics declarations
Ethics approval and consent to participate
Our institutional review board (Charité Ethics Committee, Charité – University Medicine Berlin) approved this retrospective study (internal registration number EA2/016/14) and waived informed consent due to its retrospective nature. The study protocol conforms to the ethical guidelines of the 2002 Declaration of Helsinki.
Consent for publication
All authors red the manuscript and agreed for publication.
Competing interests
None.
Additional information
Publisher's Note
Springer Nature remains neutral with regard to jurisdictional claims in published maps and institutional affiliations.
Rights and permissions
Open Access This article is licensed under a Creative Commons Attribution 4.0 International License, which permits use, sharing, adaptation, distribution and reproduction in any medium or format, as long as you give appropriate credit to the original author(s) and the source, provide a link to the Creative Commons licence, and indicate if changes were made. The images or other third party material in this article are included in the article's Creative Commons licence, unless indicated otherwise in a credit line to the material. If material is not included in the article's Creative Commons licence and your intended use is not permitted by statutory regulation or exceeds the permitted use, you will need to obtain permission directly from the copyright holder. To view a copy of this licence, visit http://creativecommons.org/licenses/by/4.0/. The Creative Commons Public Domain Dedication waiver (http://creativecommons.org/publicdomain/zero/1.0/) applies to the data made available in this article, unless otherwise stated in a credit line to the data.
About this article

Cite this article
Auer, T.A., Walter-Rittel, T., Geisel, D. et al. HBP-enhancing hepatocellular adenomas and how to discriminate them from FNH in Gd-EOB MRI. BMC Med Imaging 21, 28 (2021). https://doi.org/10.1186/s12880-021-00552-0
Received:
Accepted:
Published:
DOI: https://doi.org/10.1186/s12880-021-00552-0