
Abstract
Background
Ultrasonography has become an indispensible tool in the management of obstetric patients. Accurate determination of fetal gestational age (FGA) has posed great challenge to patient management as the accuracy of traditional biometric parameters decreases with advance in gestation age. Accuracy of fetal kidney length (FKL) in the determination of FGA at third trimester has been documented in other population. This study is aimed to create baseline reference values of fetal kidney lengths in a Nigerian population as previous studies show population specific variations.
Methods
This prospective cross sectional study was carried out on 534 pregnant women between 20 and 40 weeks of gestation who met the inclusion criteria at Diamond Biomedical Services Ltd. A pilot study was conducted on 20 patients to determine the reproducibility and reliability of ultrasound measurement of FKL. Fetal kidney lengths were calculated as mean of three separate measurements. The 5th, 50th and 95th percentiles were calculated using least squared regression analysis. Third polynomial regression models were used to establish the relationship between right and left FKL and FGA.
Results
Both FKL measurements are highly reproducible with excellent correlation and agreement within and between sonographers. It correlates strongly with gestational age while the relationships between right and left kidney lengths with gestational age were established using the following regression equations: RKL = − 11.18 + 1.193 × FGA − 0.0350 × FGA2 + 0.00037 × FGA3 and LKL = − 12.57 + 1.332 × FGA − 0.0390 × FGA2 + 0.00040 × FGA3 for right and left kidneys respectively.
Conclusion
Nigerian population specific baseline reference values of FKLs for the estimation of FGA should be adopted rather than relying on the Caucasians values as universal patterns.
Background
The importance of accurate fetal gestational age (FGA) determination in the management of obstetric patients cannot be over emphasized. The choice of obstetric management decision and its outcome depends on the knowledge of the exact age of the pregnancy. Accurate FGA determination enables adequate planning for the appropriate mode of delivery and further management of neonate after delivery [1]; helps in counseling women at risk of preterm delivery and in the evaluation of fetal growth and detection of intrauterine growth retardation (IUGR) [2]. Uncertain gestational age has been associated with adverse pregnancy outcome which includes low birth weight, spontaneous preterm delivery and perinatal mortality independence of maternal characteristics [2]. Haines [3] noted that a combination of uncertain date of LMP and any obstetric high risk situation (e.g. placenta previa, pregnancy induced hypertension, IUGR) places the fetus in jeopardy because of the difficulty in deciding the optimal time of delivery.
Different methods are being employed in the determination of FGA which includes last menstrual period (LMP), ovulation date, date of conception (in case of artificial insemination), symphysis-fundal height, quickening and ultrasonography.
Ultrasound has played a vital role in the estimation of FGA and has become an integral part of obstetric practice [4]. Sonographic estimation of gestational age is derived from calculation based on fetal measurement which serves as an indirect indicator of gestational age. Numerous equations regarding the relationship between fetal biometric parameters has been described and have proven early antenatal ultrasound to be an objective and accurate means of establishing FGA [5,6,7,8]. These biometric parameters includes- gestational sac (GS), crown rump length (CRL), biparietal diameter (BPD), head circumference (HC), abdominal circumference (AC), and femur length (FL).
Accurate assessment of FGA using ultrasound has posed a serious problem to obstetricians especially as the pregnancy approaches term. This stems from the fact that there are increased fetal biological variations as pregnancy advances. These variations can be caused by maternal age, parity, pregnancy weight, geographic location and specific population characteristics. Also technical factors like interobserver error and different measuring techniques contributes to the fetal variability as pregnancy advances to term [9]. This finding was supported by Benson and.
Doubilet [10] who noted that the accuracy of these traditional predictors of FGA (GS, CRL, BPD, HC, AC and FL) decreases as the pregnancy advances to third trimester. Gottlieb and Galan [11] therefore, suggested that in addition to these traditional parameters, ancillary biometric and non biometric measurements can help narrow the biological variability between fetuses. Butt [12] and Konje et al. [13] recommended combination of multiple biometric parameters for FGA determination in the third trimester instead of relying on a single parameter. Ansari et al. [14] and Konje et al. [13] noted that the fetal kidney length (FKL) is more accurate method of determining gestational age than the other fetal biometric indices based on BPD, HC, FL, and AC between 24 weeks and 38 weeks of gestational age.
Fetal kidney can be reliably measured using transvaginal sonography (TVS) between 14 weeks and 17 weeks of gestation while it can be measured using transabdominal ultrasonography from 18 weeks of gestation and above [15]. Study by Ansari et al. [14] shows slight variation in fetal kidney length in Asian as compared to previous studies on Caucasian. This could suggest racial variation in the studied population and may be the reason why Degan [16] stated that various epidemiological factors involved in the fetal growth should be considered and specific charts for different communities should be used when possible. His stance was corroborated by Kurtz et al. [6] who stated that there were many well established charts that have been in use for a long time but marked difference between populations sometimes necessitates researchers to build a nomogram for difference races, hence, the need for this study. There are several western studies on normal FKL but reviewed literatures have shown that no such study has been undertaken in an African descent. This study is therefore aimed to create reference range nomograms of right and left FKLs for different gestational age in a Nigerian population and also to compare the result from this study with the one done by Ansari et al. [14] on Asian population.
Methods
This was a cross sectional study carried out at Diamond Biomedical Services Ltd., Portharcourt, Rivers state, Nigeria between February 2014 and December 2015. Simple random sampling method was used to select 534 pregnant women for the study. Patients with single fetus between 20 to 40 weeks of gestation and whose LMP agrees within 7 days with sonographically determined gestational age were included in the study. Excluded from the study were patients with twin gestation, known fetal anomaly, oligo- or poly-hydramnios and patients in labour. Patients were scanned once during the study, and to avoid double counting due to repeat scan or follow up scan, a combination of patients name and mobile phone number were used for identification. Ethical clearance was obtained from the Ethics committee of Diamond Biomedical Services Ltd. while informed consent was obtained from each patient before data collection began.
Equipment
All sonographic examination was performed using high resolution real time digital ultrasound scanner (DP-50 by Shenzhen Mindray Biomedical Electronics Co. Ltd. China, 2011) with 3.5 MHz frequency convex transducer.
Scanning technique
A pilot study was conducted on 20 patients to measure the reproducibility and agreement of FKL measurements within and between sonographers who have 13 years of experience each in obstetric ultrasound scan. The fetus was scanned in the transverse plane until the kidney is visualized below the stomach. The probe was then rotated through 90° to outline the longitudinal axis of the kidney. Both FKLs were measured from the outer edge of the upper pole to the outer edge of the lower pole as described by Bertagnoli et al. [17]. Care was taken so as not to include the adrenal gland in the measurement (position for Fig. 1). Most attempts to obtain the KFL were successful. Few that were difficult due to fetal position were obtained after few trials by gently but firmly shaking the maternal abdomen to elicit fetal movement. However, in a situation where it was not possible to get the kidney outlines well, the patient was excluded from the study.

Sonogram of fetal kidney lengths measurement at 35 weeks of gestation
Other measurements obtained during the study include, right and left kidney width, circumference and area. FL, BPD, HC and AC were also measured as described by Callen [18]. Three measurements of both kidney lengths and other parameters listed above were made and the average taken as the final measurement.
Statistical analysis
Data were analyzed using R statistical package (v.2.14.12, R foundation for statistical computing, 2012) linked to SPSS v.21 (IBM Corporation, 2012).Lin’s Concordance correlation coefficient, intraclass correlation coefficient and Bland Altman plots were used to measure reproducibility and agreement of measurements within and between two sonographers.
Percentile curves were obtained using least squared regression analysis as described by Royston and Wright, 1998. The adequacy of the fitted model was tested using z- scores as well as Shapiro-Wilk’s test while QQ normality plot was used to test for consistency of the centile curves. The centile curves for the various gestational ages were calculated and the results tabulated to show the 5th, 50th and 95th percentiles. Pearson’s correlation was used to test for relation between the right and left FKLs with FL, BPD, HC and AC while line chart was used to compare the result of this study with that of Ansari et al. [14].
Results
Out of 1002 patients who presented themselves for routine obstetric ultrasound scan within the period of study, 543 patients met the inclusion criteria and were selected for the study while 459 patients were excluded from the study for the following reasons; 345 patients were excluded for not remembering their LMP, 49 patients were excluded for the inability to assess the kidney outline, 59 patients were excluded for having fetus with IUGR, 3 patients presented with oligohydramnios while 3 patients had fetus with anomaly. The right FKL measurement ranges from 2.04 ± 0.38 cm at 20 weeks of gestation to 4.57 ± 0.26 cm at 40 weeks gestation while the left kidney measurement ranges from 2.10 ± 0.37 cm at 20 weeks of gestation to 4.75 ± 0.29 cm at 40 weeks of gestation.
Normal ranges
Original data was used in the analysis as log transformation increased skewness (− 0.1 to − 0.6 for the right and − 0.2 to − 0.8 for the left) (Position for Fig. 2 and Fig. 3). A third polynomial equation fitted the data for both kidneys considering the z-scores plot (Position for Fig. 4), and a linear equation was adequate for the SD since the plot between the scaled absolute residuals and FGA revealed no trend. The Shapiro-Wilk test retuned a value of 0.98 for the right kidney and 0.99 for the left kidney.
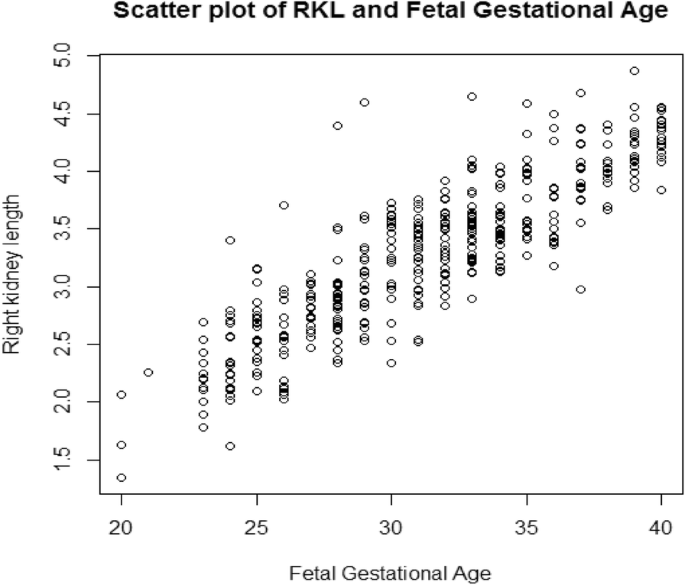
Scatter plot of Right kidney length against fetal gestational age
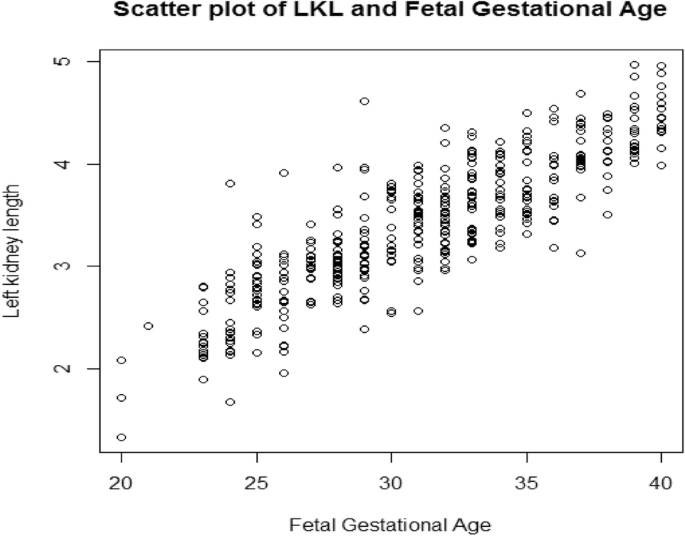
Scatter plot of Left kidney length against fetal gestational age
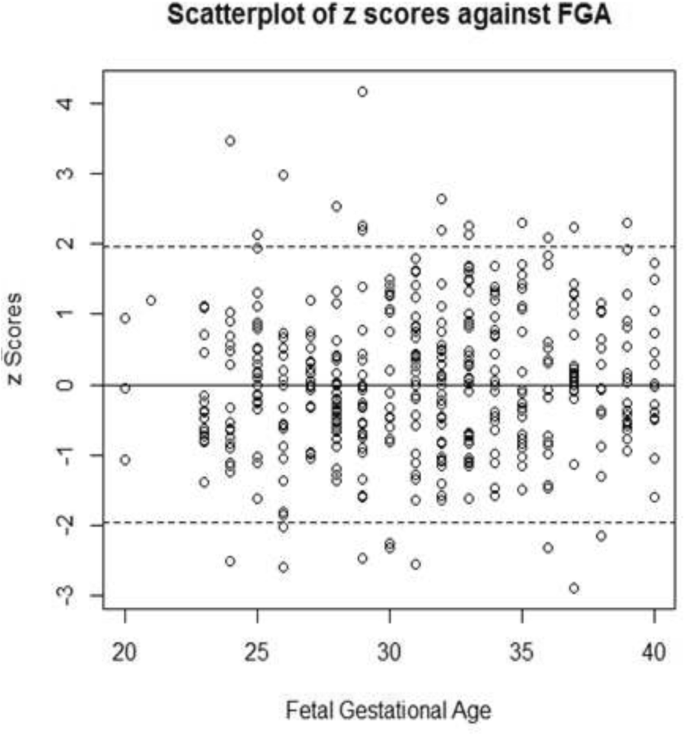
Scatter plot of z-scores against fetal gestational age
The percentile chat for both kidneys is shown in Table 1. (Position for Table 1).
Intra rater reliability
The Lin’s Concordance correlation coefficient was used to measure reproducibility for a single observer and a value of 0.977 was obtained which indicates excellent concordance between the two measurements. (Position for Fig. 5). As shown in Fig. 5, a linear relationship is demonstrated with little scatter, further indicating excellent concordance between the two measures. Using the ANOVA model, an excellent intra class correlation value of 0.989 was obtained (Position Table 2). Additionally, the bland Altman plot shows that the two measurements are not significantly different from zero (position for Fig. 6). For the two observers, a Lin’s concordance correlation gave a value of 0.997, indicating good correlation.

Scatter plot of Lin’s Concordance plot for a single Sonographer

Bland Altman’s plot for measurement between two Sonographers
Furthermore, the ICC returned an excellent correlation (0.989) (Position for Table 3) and the Bland Altman returned a value of 0.794, which indicates good agreement. A comparison between this work and the work by Ansari et al. is shown in Fig. 7 below: (Position for Fig. 7).
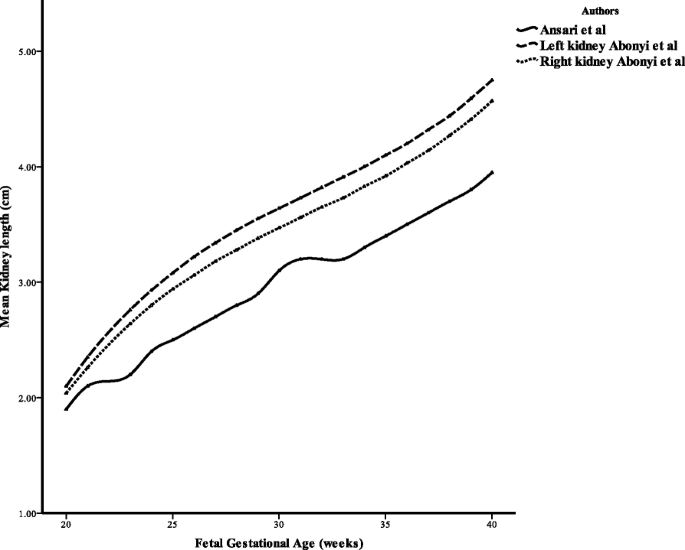
Line graph comparing our study with Ansari et al.
Discussion
Effort has been on increase in finding an appropriate biometric parameter which best predicts gestational age as pregnancy advances towards term. Such biometric parameter must meet the requirement for estimating FGA which according to Campbell [19] shall have little biological variation and can be easily measured with a high degree of reproducibility and reliability. The fetal kidney can be easily visualized and measured. In the pilot study to determine inter rater reliability, the right FKL shows very excellent concordance correlation within and between sonographers with coefficient of 0.977 and 0.988 within sonographers and a coefficient value of 0.977 between sonographers while the left FKL gives a concordance coefficient of 0.995 and 0.995 within sonographers and 0.990 between sonographers. The inter class correlation coefficient is 0.996. This implies that fetal kidney measurements have excellent intra and inter rater reproducibility and reliability thus satisfying the criteria stipulated by Campbell [19]. To further confirm the finding, the intraclass correlation was calculated using the ANOVA model which gave a coefficient of 0.989, a value that is excellent enough to be used clinically. Bland Altman plot also indicated that the measurements are significantly different from zero.
From this study, both FKLs increase in a linear fashion with increase in FGA. The right FKL increases from 2.04 ± 0.38 cm at 20 weeks of gestation to 4.74 ± 0.26 cm at 40 weeks of gestation while the left FKL increases from 2.10 ± 0.37 cm at 20 weeks of gestation to 4.75 ± 0.29 cm at 40 weeks of gestation. This is in keeping with the findings of previous studies [14, 20, 21] which found that FKL increases with increase in FGA. Since FKL correlated positively with FGA, it points to its efficacy as a good predictor of FGA at third trimester. This is supported by Konje et al. [13] who stated that between 24 and 38 weeks of gestation, FKL is a more accurate method of determining FGA than the biometric indices of BPD, HC, FL and AC. This may also explain why both FKLs correlated weakly albeit positively with other biometric parameters whose efficacy decreases as gestation increases towards term. Right FKL correlates with other biometric parameters as follows: FL (0.360, p < 0.1), BPD (0.323, p < 0.01), AC (0.379, p < 0.01) and HC (0.311, P < 0.01) while the left FKL correlates as follows: FL (0.379, p < 0.01), BPD (0.343, p < 0.01), AC(0.396, p < 0.01) and HC (0.331, p < 0.01).
The measurements obtained from this study were compared with those obtained by Ansari et al. [14] and the result shows strong correlation between the two studies. This findings conforms to that of previous studies [13, 21,22,23] which states that though kidney size, as for all other fetal organs, is affected by growth variations, FKL remains largely unchanged as it is only the anterior-posterior and transverse diameters that are predominantly affected. Line chart was used to compare our measurements with that of Ansari et al. [14] and the result revealed that measurements from Ansari et al. [14] are always lower than that from our study. This could be attributed to the difference in the ultrasound machines used or as a result of difference in the morphology of the population studied. Also noted from this study is that left kidney is slightly longer than the right kidney which is in conformity with the study by Karim et al. [24] that found that the right kidney is shorter than the left kidney.
Conclusion
Fetal kidney length increases with increase in FGA and shows excellent intra and inters class correlation coefficient which suggests good agreement and reproducibility of measurements. The nomograms thus produced will serve as indigenous charts rather than relying on those from Caucasians which from this study was found to be lower than that of our local population.
Availability of data and materials
Due to patient privacy protection, the data and corresponding materials used in this study are with the corresponding author and can only be made available upon request.
Abbreviations
- AC:
-
Abdominal circumference
- BPD:
-
Biparietal diameter
- CRL:
-
Crown rump length
- FGA:
-
Fetal gestational age
- FL:
-
Femur length
- GSD:
-
Gestational sac diameter
- HC:
-
Head circumference
- IUGR:
-
Intrauterine growth retardation
- LKL:
-
Left kidney length
- LMP:
-
Last menstrual period
- RKL:
-
Right kidney length
References
Ogunsina JA, Soyebi KO, Ogunseyinde AO, Abudu OO, Multiple F, et al. Parameters in the estimation of Gestational age in Nigerian pregnant women. West African Journal of Ultrasound. 2001;2:17–8.
Hall MH, Carr-Hill RA. The significance of uncertain gestational age for obstetric outcome. Br J Obstet Gynaecol. 1985;92:452–60.
Haines CJ, Langlois SL, Jones WR. Ultrasonic measurement of fetal femoral length in singletone and twin pregnancies. Am J Obstet Gynecol. 1986;155(4):838–41.
Kalish RB, Chervenak FA. Ultrasound assessment of gestational age. Optimal Obstetric. 2002;1:1–6.
Hadlock FP, Deter RL, Harrist RB, Park SK. Estimating gestational age. Computer assisted analysis for multiple fetal growth parameters. Radiology. 1984;152(2):497–501.
Kurtz AB, Wapner RJ, Kurtz RJ, Dershaw DD, Rubin CS, Cole-Beuglet C, Goldberg BB. Analysis of biparietal diameter as an accurate indicator of gestational age. J Clin Ultrasound. 1980;8(4):319–26.
Mul T, Mongelli M, Gardosi JA. Comparative analysis of second-trimester ultrasound dating formulas in pregnancy conceived with artificial reproductive techniques. Ultrasound Obstet Gynecol. 1996;8:397–402.
Ott WJ. Accurate gestational dating revisited. Am J Perinatol. 1994;6:404–8.
Lunt RM, Chard L. Reproducibility of measurement of fetal biparietal diameter by ultrasonic cephalometry. J Obstet Gynaecol Br Commonw. 1974;81:682.
Benson CB, Doubilet PM. Sonographic prediction of gestational age: accuracy of second- and third- trimester fetal measurement. Am J Roentgenol. 1991;157(6):1275–7.
Gottlieb AG, Galan HL. Nontraditional sonographic pearls in estimating gestational age. Semin Perinatol. 2008;32(2):154–6.
Butt K, Lim K. Society of Obstetricians and Gynaecologists of Canada. Determination of gestational age by ultrasound. J Obstet Gynaecol Can. 2014;36(2):171–83.
Konje JC, Abrams KR, Bell SC, Taylor DJ. Determination of gestational age after 24th weeks of gestation from fetal kidney measurements. Ultrasound Obstet Gynaecol. 2002;19(6):592–7.
Ansari SM, Saha M, Paul AK, Mia SR, Sohel A, Karim R. Ultrasound study of 793 Foetuses: measurement of normal foetus kidney lengths in Bangladesh. Australas Radiol. 1997;41:3–5.
Zalel Y, Lotan D, Achiron R, Mashiach S, Gamzu R. The early development of fetal kidney in an utero sonographic evaluation between 13 and 22 weeks gestation. Pernat Diagn. 2002;22(11):962–5.
Degan S. Fetal biometry: clinical, pathological and technical considerations. Obstet Gynecol Surv. 2001;56(3):159–67.
Bertagnoli L, Lalatta F, Gallicchio R, Fantuzzi M, Rusca M, Zorzoli A, Deter RL. Quantitative characterization of the growth of the fetal kidney. J Clin Ultrasound. 1983;11(7):349–56.
Callen PW. The obstetric ultrasound examination. In: Callen PW, editor. Ultrasonography in Obstetric and Gynecology. 4th ed. Philadelphia PA: WB Saunders Co; 2000. p. 1–17.
Campbell S. Gestational age determination: Second trimester. In: Chervenac FA, Isaacson GS, Campbell S, editors. Ultrasound in Obstetrics and Gynecology. Boston: Little, Brown and Company; 1993. p. 305–10.
Cohen HL, Cooper J, Eisenberg P, Mandel FS, Gross BR, Goldman MA, Barzel E, Rawlinson KF. Normal length of kidneys. Sonographic study in 397 Obstetric patients. AJR AMJ Roentgenol. 1991;157(3):545–8.
Konje JC, Okaro CL, Bell SC, de Chazal R, Taylor DJ. A cross-sectional study of changes in fetal renal size with gestation in appropriate and small for gestational age fetuses. Ultrasound Obstet Gynecol. 1997;10:22–6.
Gloor JM, Breckle RJ, Gehrking WC, Rosenquist RG, Mulholland TA, Bergstrach EJ, Ramin KD, Ogburn PL. Jr. etal renal growth evaluated by prenatal ultrasound examination. Mayo clin proc. 1997;72(2):124–9.
Konje JC, Bell SC, Morton JJ, de Chazal R, Taylor DJ. Human fetal kidney morphometry during gestation and the relationship between weight, kidney morphometry and plasma active rennin concentration at birth. Clinical science. 1996;91(2):169–75.
Karim SH, Mohammed NA, Aghaways IAH, Muhammed BA. Comparative ultrasonographic measurement of renal size and its correlation with age, gender, and body mass index in normal subjects in Sulaimani region. Eur Sci J. 2015;11(12):236–50.
Acknowledgements
We acknowledge the management and staff of Diamond Biomedical Services Ltd. for allowing us carry this study in their establishment.
Funding
None.
Author information
Authors and Affiliations
Contributions
A.K.K, A.E.O and E.C.U designed the study, A.E.O performed the ultrasound scanning, A.E.O, O.S.W.I, E.C.U and A.K.K. drafted the manuscript, and O.S.W.I analyzed the data. All the authors read the manuscript and therefore approved the final manuscript for submission.
Corresponding author
Ethics declarations
Ethics approval and consent to participate
Ethical approval was sought and obtained from the Ethical Committee of Diamond Biomedical Services Ltd. with reference number DBSL/ADMIN/201/Vol.02/13. Written informed consent were obtained from patients who can read while verbal consent were obtained after careful explanation of the procedure from patients who cannot read before they were made to thumb print on the consent form.
Consent for publication
Not applicable.
Competing interests
The authors declare that they have no competing interests.
Additional information
Publisher’s Note
Springer Nature remains neutral with regard to jurisdictional claims in published maps and institutional affiliations.
Rights and permissions
Open Access This article is distributed under the terms of the Creative Commons Attribution 4.0 International License (http://creativecommons.org/licenses/by/4.0/), which permits unrestricted use, distribution, and reproduction in any medium, provided you give appropriate credit to the original author(s) and the source, provide a link to the Creative Commons license, and indicate if changes were made. The Creative Commons Public Domain Dedication waiver (http://creativecommons.org/publicdomain/zero/1.0/) applies to the data made available in this article, unless otherwise stated.
About this article

Cite this article
Abonyi, E.O., Eze, C.U., Agwuna, K.K. et al. Sonographic estimation of gestational age from 20 to 40 weeks by fetal kidney lengths’ measurements among pregnant women in Portharcourt, Nigeria. BMC Med Imaging 19, 72 (2019). https://doi.org/10.1186/s12880-019-0371-z
Received:
Accepted:
Published:
DOI: https://doi.org/10.1186/s12880-019-0371-z